

Abstract
Protein aggregation is associated with fatal neurodegenerative diseases, including Alzheimer's and Parkinson's. Mapping out kinetics along the aggregation pathway could provide valuable insights into the mechanisms that drive oligomerization and fibrillization, but that is beyond the current scope of computational research. Here we trace out the full kinetics of the spontaneous formation of fibrils by 48 Aβ16-22 peptides, following the trajectories in molecular detail from an initial random configuration to a final configuration of twisted protofilaments with cross-β-structure. We accomplish this by performing large-scale molecular-dynamics simulations based on an implicit-solvent, intermediate-resolution protein model, PRIME20. Structural details such as the intersheet distance, perfectly antiparallel β-strands, and interdigitating side chains analogous to a steric zipper interface are explained by and in agreement with experiment. Two characteristic fibrillization mechanisms—nucleation/templated growth and oligomeric merging/structural rearrangement—emerge depending on the temperature.
Introduction
The pathological hallmark of a number of neurodegenerative diseases, including Alzheimer's, Parkinson's, and the prion diseases, is the presence of self-assembled structures, known as fibrils or amyloid (1, 2, 3). The central role of amyloid in the nearly 40 diseases that have been identified thus far has prompted a massive amount of experimental research over the last decade aimed at understanding protein aggregation in general and fibril self-assembly in particular (4, 5, 6, 7, 8, 9, 10, 11, 12, 13). Such studies are increasingly being complemented by atomistic-level simulations, which have the potential to provide details about the aggregation process that cannot be obtained directly from experiments. The huge computational demands associated with atomistic-resolution simulations, however, restrict the types of studies that can be done to simulations of the formation of small oligomers (14, 15, 16, 17, 18, 19, 20) or analysis of the thermodynamic stability of expected fibrillar structures based on known experimental results (21, 22, 23, 24, 25, 26, 27, 28, 29). Although coarse-grained models (30, 31, 32, 33, 34, 35, 36) do have the potential to analyze fibril formation and give kinetic insights, they are limited in their ability to account for amino-acid specificity, which is a handicap when examining therapeutic strategies to counter or enhance protein aggregation. We have been threading our way through the middle by performing simulations at intermediate (as opposed to atomistic or coarse-grained) resolution (37, 38). This allows us to observe the full kinetics associated with the spontaneous formation of protein aggregates while retaining the structural details and amino-acid specificity, which are vital for a complete understanding of disease-related aggregation.
The model peptide chosen for this study is Aβ16-22 (KLVFFAE), a fragment of β-amyloid (Aβ), the 40- or 42-residue peptide linked to Alzheimer's disease. As one of two centrally located hydrophobic stretches in Aβ, Aβ16-22 plays a critical role in driving the assembly of the entire peptide into oligomers and fibrils (5, 39). Aβ16-22 is known to form fibrillar structures by itself based on solid-state NMR and x-ray experiments (40), but their precise structure in terms of β-sheets stacking is unknown. Experiments and many computational studies suggest that the orientation of peptides within each sheet is antiparallel, and that between the sheets is parallel (15, 24). The mechanisms for β-sheet stacking and the number of sheets per stack predicted by all-atom stability simulations differ from study to study (23, 24, 25). A steric zipper interface has been suggested for Aβ16-22, although the interdigitized pattern is not as well defined as it is for the best-known steric zipper, GNNQQNY (4, 41). This is likely due to the lack of size and shape complementarity between the small (ALA) and large (PHE) side chains (23). Clearly, however, the number of sheets per stack, the arrangement of side chains within the steric zipper, and the parallel or antiparallel arrangement of peptides within and between the sheets are governed as much by kinetics as by thermodynamics (stability).
In this work we present the results of large-scale, intermediate-resolution molecular-dynamics (MD) simulations of the spontaneous formation of fibrils by a system containing 48 Aβ16-22 peptides based on a new, to our knowledge, implicit-solvent protein model, PRIME20 (see Methods). We are able to trace out the aggregation process of a large system of nontrivial peptides along the entire fibrillization pathway, from an initial configuration of random coils to twisted protofilaments with cross-β-structures, and to demonstrate how the kinetics dictates both the fibrillization process and the structural details of the fully formed fibril.
Methods
PRIME20
We performed simulations by applying discontinuous MD (DMD) (42), a very fast and efficient alternative to traditional MD, to proteins modeled using PRIME20, an intermediate-resolution force field for proteins. PRIME20 is an extension of PRIME, an intermediate-resolution protein model (43) previously used in DMD simulations of the aggregation of polyalanine (37) and polyglutamine (38) to describe the geometry and energetics of peptides containing all 20 amino-acid residues (44).
PRIME20 was designed to provide biophysical insights into protein folding and aggregation, and is particularly useful for studying the behavior of large systems of proteins over long timescales. Peptides are modeled using a four-spheres-per-residue representation (backbone united atoms NH, CαH, and CO, and a single sphere side chain). We assign mass to each united atom as CαH (0.866), NH (0.999), CO (1.863), and side-chain spheres K (4.865), L (3.799), V (2.866), F (6.061), A (1.000), E (4.793) in mass units of CH3 (15 amu = 1.0). Consequently, the procedures for estimating the time to the next collision and the change in momentum after events such as core collision, capture, dissociation, and bounce are modified. In estimating pair interaction parameters, the 20 amino-acid side chains are classified into 14 groups (LVI, M, F, Y, W, A, C, ED, KR, P, ST, QN, H, and G) according to their hydrophobicity, polarity, size, charge, and potential for side-chain hydrogen bonding. The 19 and 23 energy parameter sets are obtained by applying a perceptron learning algorithm plus a modified stochastic learning algorithm that optimizes the energy gap between 711 known native states from the PDB and decoy structures generated by gapless threading based on the four-sphere representation (44). We used the 19 energy parameter set from Table 2 of Cheon et al. (44), in these simulations. All pair interactions are represented in terms of reduced energies, ε∗(ij) = ε(ij)/εHB, where εHB is a hydrogen-bonding energy.
We keep the original PRIME backbone geometric parameters for the NH(i)-Cα(i), Cα(i)-CO(i), CO(i)-NH(i+1) covalent bond lengths, and for the NH(i)-CO(i), Cα(i)-NH(i+1), CO(i)-Cα(i+1), and Cα(i)-Cα(i+1) pseudo-bond distances. However, the geometric distance parameters related to the side-chain centroids are assigned separately for each amino acid, i, including side-chain sphere diameters, side chain to Cα distances (Ri-Cα), side chain to NH (Ri-NH) or CO distances (Ri-CO) (pseudo-bond lengths), and local distances between backbone and side-chain spheres (squeeze parameters). It is essential to have realistic values for all of the side-chain distance parameters because these determine whether we have accurate values of the van der Waals volume, backbone structures in agreement with native PDBs, correct backbone dihedral angles, and L-isomerization of amino acids. We initially attempted to evaluate average values for Ri-Cα, Ri-NH, and Ri-CO for each amino acid by mining data on native structures from the PDB. However, simple evaluations based on averages of these distributions were not suitable because simulations using these values gave improper backbone structures with wrong backbone dihedral angles and ultimately no secondary structure. In addition, there was a problem with L-form amino acids changing to D-form amino acids for large amino acids. Such D-form amino acids distort backbone structures, allowing all dihedral angles. The lesson we learned from these unsuccessful efforts to estimate side-chain distance-related parameters from PDB distributions is that those distances must be carefully adjusted to give allowed dihedral angles and keep L-isomerization under the 2.3% bond tolerance.
We devised an alternate and ultimately successful approach in which we determined the side-chain-related distance parameters using a trial and error approach that involved performing DMD simulations with many different sets of Ri-Cα, Ri-NH, and Ri-CO, and the squeeze distances. The test cases were 12 different 11-residue poly-X peptides (where X stands for each of the 20 possible amino acids modeled with the test geometry). After a run of 20 billion collisions, we checked to ensure that the resulting Ramachandran plots were consistent with known allowed angle regions. The test values of the parameters for the poly-X peptides were chosen to be within allowed distance values consistent with the 711 native PDB structures (all globular single-chain proteins without nucleic acids or ligands), and also to prevent the occurrence of D-form amino acids. The Cα to side-chain distances in the simulations reported here are 3.55 Å (K), 2.625 Å (L), 2.002 Å (V), 3.425 Å (F), 1.600 Å (A), and 3.180 Å (E).
Simulation procedures
The simulations proceeded in the following way: We placed 48 peptides in random locations and random coil conformations by performing DMD simulations at high temperature. The temperature was then lowered continuously from T∗ = 0.50 to 0.20 over the course of 8.6 billion collisions until t∗ = 508, at which point the constant-temperature simulation began. Extensive runs of up to 268 billion collisions (reduced time t∗ = t/σ(kBT/m)1/2≈16,000) were conducted at reduced temperatures ranging from T∗ = kBT/εHB = 0.10 to 0.205, with periodic boundary conditions at two different molar concentrations (c = 10 mM with box size 200 Å and ∼20 mM (19.46 mM) with box size 160 Å). Ten independent runs at T∗ near the transition temperature (above which fibrils do not form) at each concentration and five independent runs at lower temperatures were performed.
Results
Fibril growth from random initial configurations
Fig. 1 shows typical snapshots of fibril formation over the course of the simulation at various reduced times t∗ for simulations performed at high reduced temperature T∗ = 0.20. The starting configuration for the constant temperature portion of the run (Fig. 1 a) is a random configuration of random coils. As the simulation proceeds, a variety of structures (e.g., small disordered aggregates, single- and bilayer β-sheets, annular β-barrel, and sandwiched β-sheets; see Fig. S1 in the Supporting Material) continuously form and dissolve, but none are capable of seeding the nucleation process. After 23 billion collisions (the lag time for this simulation), a stable fibril nucleus finally forms (Fig. 1 b), consisting of a bilayer of β-sheets with four peptides per sheet. Thereafter, the nucleus grows through 1), the one-by-one addition of monomers to the ends of the first and second sheets (Fig. 1 c) via random attachment and structural adjustment of monomers; and 2), the addition of a few disordered peptides to the side of the bilayered surface, which subsequently rearrange (Fig. 1 d) in a second nucleation process to form a third layer. Fig. 1 e shows a stable trilayered β-sheet surrounded by free monomers. Finally, after very long simulation times (Fig. 1 f), a protofilament containing three β-sheet layers of comparable lengths and a few free monomers remain at equilibrium. We interpret this sequence of events as a nucleated process followed by templated assembly, meaning that soluble random-coil peptides bind to a preassembled β-sheet-rich nucleus (45). Qualitatively similar growth kinetics has also been observed in a lattice toy model introduced by Li et al. (35).
Figure 1.
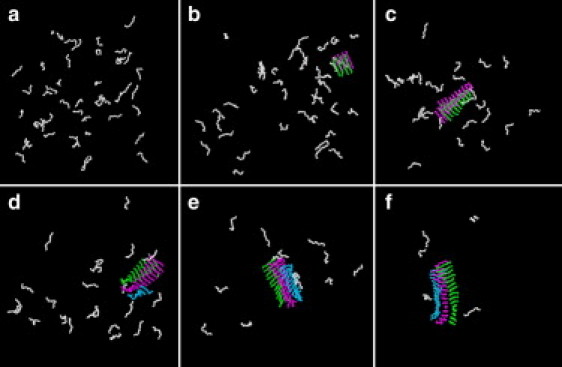
Snapshots of DMD simulations for 48 Aβ16-22 chains. Figures were drawn with the use of the VMD program. (a) Starting configuration (t∗ = 508) at temperature T∗ = 0.20 after 8.6 billion collisions in a slow cooling simulation from T∗ = 0.50 (t∗ = 0). (b) A nucleation seed consisting of a small bilayered cross-β-structure with four strands per sheet is formed after 31 billion collisions (t∗ = 1852). (c) The nucleation seed has grown into a bilayered cross-β-structure after 44 billion collisions (t∗ = 2586). (d) A third layer is formed as single peptides attach themselves to the second layer one by one after 49 billion collisions (t∗ = 2863). (e) A three-layered β-sheet, essentially a protofilament, is grown after 63 billion collisions (t∗ = 3720) and remains stable until the end of the simulation (f) at 213 billion collisions (t∗ = 12,611).
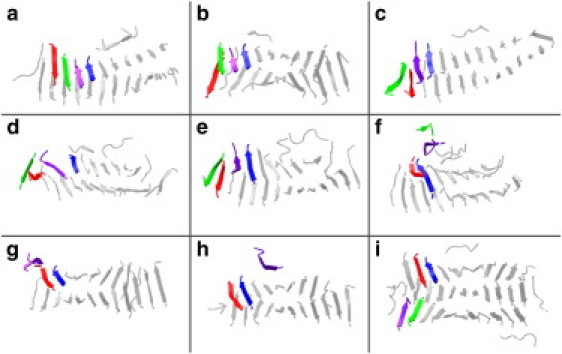
In contrast to the sequence of events observed at high temperature, fibril formation at low reduced temperatures (T∗ = 0.15–0.18) is not a simple nucleation and growth process in which free monomer peptides attach themselves to a nucleus one by one. Instead, the process involves hydrophobic collapse at an early stage, oligomeric merging of partially ordered protofilaments at an intermediate stage, and structural rearrangement at later times. Snapshots are shown in Fig. 2. The random initial configuration (Fig. 2 a) quickly evolves to a system of small oligomers (Fig. 2 b), including a disordered oligomer (green) a single-layer β-sheet (turquoise), a bilayer β-sheet (orange), and sandwiched bilayer β-sheets (purple). These merge and separate from each other over time (Fig. 2, c and d). Fig. 2 e is a snapshot of two medium-size oligomers just before they merge to form the final large oligomer; each contains ordered and disordered regions, e.g., a disordered sheet-like structure (yellow) and an annular β-barrel (green) and β-sheets (purple, orange, and turquoise). After this merging event takes place, the large oligomer undergoes a complex structural reorganization that involves transformation of disordered sheet and β-barrel into cross-β-structures, and angular rearrangement of the interface between the merging structures. The final structure is a five-layer protofilament as shown in Fig. 2 f. (Note that although we explain the kinetic process from snapshots of a single run, similar characteristics and patterns are observed for five different runs at each temperature.)
Figure 2.
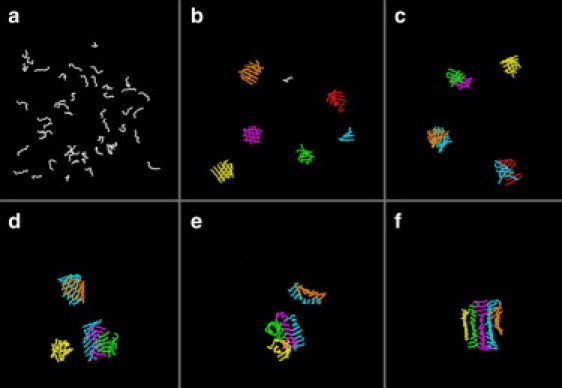
Snapshots showing oligomer merging and fibril growth at low temperature T∗ = 0.17. (a) Starting configuration (t∗ = 508) at temperature T∗ = 0.17 after 8.6 billion collisions in a slow cooling simulation from T∗ = 0.50 (t∗ = 0). (b) Several nucleation seeds consisting of small β-sheets and disordered aggregates after t∗ = 1064. Oligomer merging occurs between small oligomers after t∗ = 1895 (c) and t∗ = 2279 (d). (e) Snapshot just before final merging into a large oligomer at t∗ = 2563. A variety of partially ordered structures appear, including a disordered sheet-like structure (yellow), an annular β-barrel (green), and β-sheets (purple, orange, and turquoise) at t∗ = 2563. (f) Five-layer fibril structure at t∗ = 5198 after a long period of angular and structural rearrangements.
The differences between the kinetic aggregation mechanisms at high temperature T∗ = 0.20 and low temperature T∗ = 0.17 can be understood by reference to Fig. 3, which shows how the following four observables evolve with time: 1), the average fraction of peptides that are in β-sheet conformations (the β-sheet content); 2), the average fraction of peptides that are in disordered oligomers (disordered chain content); 3), the average fraction of free monomers (free monomer content); and 4), the orientational order parameter defined by the average over the absolute values of the cosines of the angles (< |cos θ| >) between two interacting peptides in a system. The angle θ is the angle between two interacting peptide vectors, where each peptide is represented by a vector from the position of the L17 Cα to the position of the A21 Cα; thus, when θ = 0° or 180° and hence |cos θ| = 1, two peptide chains are parallel or antiparallel and hence aligned. The points on Fig. 3 labeled by arrows a–f correspond to the timeframes for the snapshots in Figure 1, Figure 2, a–f. The β-sheet, disordered chain, and free monomer contents sum to 1.0. Fig. 3 a shows the β-sheet and disordered chain content, and Fig. 3 b shows the free monomer content and the orientational order parameter at high temperature T∗ = 0.2. Fig. 3, c and d, show the same observables, but for low temperature T∗ = 0.17.
Figure 3.
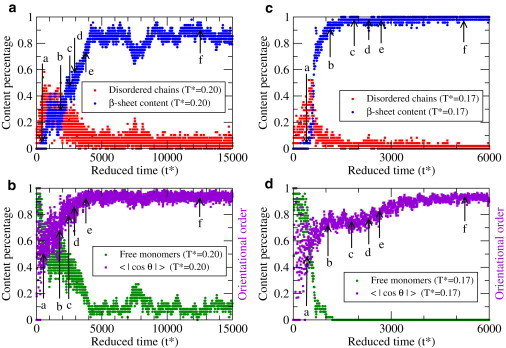
Kinetic mechanisms as revealed by the evolution of four observables with time. (a) β-sheet content (blue) and disordered chain content (red), and (b) free monomer content (green) and orientational order parameter (violet) at high temperature T∗ = 0.20. The same four observables at low temperature T∗ = 0.17 are shown in c and d. Arrows indicate times at which snapshots in Figure 1, Figure 2 were taken.
The results presented in Fig. 3 give us a better sense of the order in which the aggregation events take place at high (T∗ = 0.20) and low (T∗ = 0.17) temperatures. At high temperature, Fig. 3 a, the disordered chain content (red) is sizeable at an early stage and slowly diminishes. The β-sheet content (blue) grows slowly but does not converge to one; instead, a small fraction of the peptides remain as free monomers (green), as shown in Fig. 3 b. The orientation order parameter (violet) increases with time to its maximum value at e, but the β-sheet content continues to increase even after that. This implies that a medium-size protofilament (the snapshot of Fig. 1 e) has an orientational order similar to that of the large protofilament (the snapshot of Fig. 1 f. Because the increase in β-sheet content from e to f corresponds to the decrease in the free monomer fraction, this implies that most free monomers attach to the preordered template and rearrange very rapidly in an ordered pattern, that is, without undergoing any significant structural rearrangement. At low temperature (Fig. 3 c), the disordered chains also appear at an early stage. The fraction of free monomers decreases to zero much faster than at high temperatures, implying a rapid formation of oligomers. The orientational order in Fig. 3 d show a plateau region at modest values (lower than in Fig. 3 b) between 1000 < t∗ <2500, which signals the presence of an oligomer merging process between arrowed points b–e corresponding to Fig. 2, b–e. In contrast to the behavior at high temperature, the orientational order at low temperature saturates very slowly even after the β-sheet content has reached its maximum value. Therefore, the structural rearrangement that occurs before the formation of the final fibril structure at low temperature appears to proceed by angular reorientation of adjacent peptide vectors among nearby merging oligomers. The differences between fibril formation at low and high reduced temperatures can be also seen in the movie files in the Supporting Material. A comparison of the kinetic processes at different temperatures reveals that the fibrillization kinetics is remarkably sensitive to outside conditions such as temperature. The importance of temperature and sequences in determining the fibrillization timescale was highlighted in a recent lattice-model-based study (36). These findings suggest that assembly pathways differ from protein to protein not only because of the difference in sequence (18) but also because different parts of the temperature range for fibrillization are being accessed.
Multilayered protofilaments
Fig. 4 shows snapshots of some of the fibrils we observed at the end of our high-temperature simulations. All are twisted and contain two-, three-, and four-layer β-sheets. The actual structure for KLVFFAE (bi-, tri-, or quad-layered) is unknown, although a five-layer structure is suspected based on microscopy images (24). X-ray scattering intensities calculated for the bi- and trilayer structures with the use of the CRYSOL program (46) are given in Fig. 5. The interstrand distances (4.77 and 4.8 Å) and the trilayer intersheet distances (9.77 Å) are consistent with the real x-ray diffraction peaks 4.7 Å and 9.9 Å (24, 40). The bilayer intersheet distance is relatively high (11.1 Å) compared with that for the full fibrillar structure (9.9 Å), suggesting that this may be a function of the number of sheets. Ramachandran plots for 47 trajectories during the final 10 billion collisions at T = 0.17 and 20 mM are given in Fig. S2 for each residue from 17L to 21A without the N- and C-terminals. Ramachandran plots for 17L and 18V clearly show β-sheet regions, whereas those for 21A show both high β-strand populations and small α-helix-populations (the latter is due to the relative flexibility of the alanine backbone and the low mass of the alanine side-chain centroid). The angles for 19F and 20F show broader distributions because they have larger side chains and a longer Cα to side-chain centroid distance in our united atom model. Overall, the Ramachandran plots indicate a clear preference for β-sheets, which agrees with our observation of fibril structures. It is also apparent that the values chosen in PRIME20 for the sizes of the side-chain centroids, and the lengths of the covalent bond and pseudo-bond for each amino acid are consistent with the backbone structure and chirality (L-isomerization) observed in nature.
Figure 4.
Final fibril structures observed at the end of simulations. (a) CPK figure and (b) ribbon figure for bilayered fibril observed at T∗ = 0.197, c = 10 mM. Side-chain spheres: K (blue), L (red), V (turquoise), F (pink), A (orange), and E (yellow). Backbone spheres are colored green and magenta. (c) Trilayered fibril observed at T∗ = 0.20 and c = 20 mM. (d) Four-layered fibril obtained at T∗ = 0.20, c = 20 mM.
Figure 5.
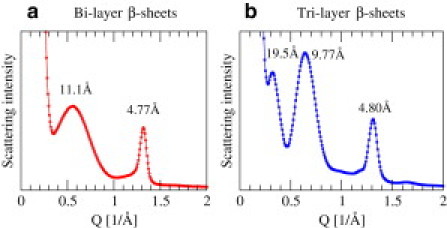
Small angle x-ray scattering intensities for simulated fibrils in this work over (a) 301 bilayer and (b) 224 trilayer trajectories at later times. Because , the peak positions correspond to 11.1 Å, 4.77 Å for bilayer, and 19.5 Å, 9.77 Å, and 4.80 Å for trilayer.
Temperature dependence of fibril formation
The β-sheet content over 5 or 10 runs is plotted in Fig. 6 a versus reduced temperature for peptide concentrations (c = 10 mM and 20 mM). The β-sheet content (a proxy here for fibrillar content) at T∗ = 0.20 (c = 10 mM) and T∗ = 0.205 (c = 20 mM) is very low (0.05%), indicating that these are slightly above the transition temperature for fibril formation, the highest temperature at which fibrils are observed. Above the transition temperature, the system remains a collection of random coils. The relatively sharp transition (T∗ = 0.20–0.205) as a function of temperature is a consequence of the nucleation process by which the ordered oligomers are formed, i.e., at the transition temperature, the peptides can be in one of two states: random monomers or the ordered template. The final structures from 10 independent runs at T∗ = 0.197, c = 10 mM yield seven bilayered and three trilayered β-sheets. A snapshot of one of the seven bilayers is shown in Fig. 4, a and b. The final structures from 10 independent runs at T∗ = 0.20, c = 20 mM yield eight trilayered structures (e.g., Fig. 4 c) and two four-layered β-sheets (e.g., Fig. 4 d). Thus, the number of β-sheet layers increases as the concentration increases.
Figure 6.
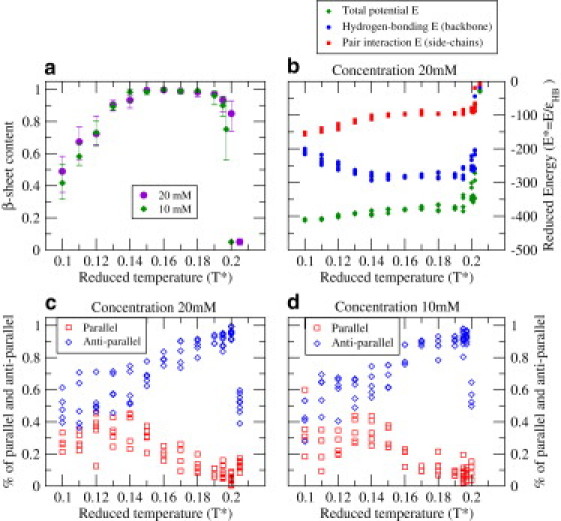
Temperature dependence of structural and thermodynamic properties. (a) Average percentage of peptides in β-sheets versus reduced temperature. Error bars are maximum/minimum values among independent runs. (b) The backbone hydrogen-bonding energy (blue), the pair interaction energy among side chains (red, a hydrophobic energy), and the total potential energy (green) in the system obtained at various temperatures. (c and d) Percentage of parallel (red squares) and antiparallel (blue diamond) neighboring strands within a sheet at various temperatures at (c) c = 20 mM and (d) c = 10 mM.
Exposed hydrophobic residues at very low temperatures
As shown clearly in Fig. 6 a, the aggregates observed at very low temperature are disordered, as reflected in the low β-sheet content at very low temperature (T∗ = 0.10–0.12). These aggregates remain frozen at such low temperatures and do not transform to ordered β-sheets even for very long runs. As shown in Fig. 6 b, the backbone hydrogen-bonding energy (blue) at these conditions is comparable to the side-chain pair interaction energy (red). At higher temperatures (T∗ = 0.15–0.17), where we see ordered protofilaments, the balance between the two types of energy shifts, with the hydrogen-bonding energy becoming more negative and the side-chain pair interaction energy becoming less negative, even though the total potential energy (green) is relatively unchanged. A comparison of the low-temperature regions, where we have disordered aggregates, and the high-temperature regions, where we have ordered fibrillar structure, indicates the somewhat surprising result that the hydrophobic residues are more exposed in protofilament structures than in fully disordered oligomers. This suggests that the toxicity of the early β-sheet-rich oligomers that form in some amyloid diseases may be due to an excess of exposed hydrophobic residues (18).
Antiparallel fibrils at high temperature
The probabilities of having parallel (angle θ < 60°) and antiparallel (angle θ > 120°) strands within the same sheet are shown in Fig. 6, c and d. Antiparallel β-sheets are observed with high probability at high temperatures such as T∗ = 0.20 (and c = 20 mM), which is near the transition temperature for fibrillization. Perfectly antiparallel β-sheet structures are sometimes seen at these conditions. An example of a perfectly antiparallel trilayer protofilament (except for the flexible ends) is shown in Fig. 4 c. The evolution from a mixed parallel/antiparallel fibril to a perfectly antiparallel fibril can be seen in the snapshots presented in Fig. 7. Parallel strands that formed early in the simulation switch to an antiparallel orientation by a continuous stochastic process. The switch occurs most often on the outside surfaces of a fibril or at the sheet ends when a misaligned strand moves away from the fibril, changes its orientation, and then reattaches. This detachment and reattachment process is most likely to occur at T∗ near the fibrillization transition temperature when the chains have sufficient (but not too much) kinetic energy to overcome the potential energy that holds the fibril together. This explains why perfect antiparallel structures are most likely to be created at these temperatures.
Figure 7.
Snapshots describing the thermal fluctuation-induced switching of strands from parallel to antiparallel configurations within the ordered β-sheets in Fig. 1. Conformations at the cross-β-edge at (a) 42.7, (b) 43.6, (c) 43.8, (d) 44.1, (e) 44.4, (f) 44.5, (g) 44.7, (h) 45.0, and and (i) 63.6 billion collisions are shown. Red and green strands in the upper sheet, which are parallel in a, move to a lower sheet by e. Blue and violet strands remain parallel in the upper sheet from a to e. The green strand detaches from the fibril in f and the violet strand moves to the side of the upper β-sheet in g. The red strand moves back to the upper sheet in f and reattaches, but now next to the blue strand in an antiparallel configuration. The red and blue strands remain antiparallel from h to i. (i) The green and violet strands are now antiparallel in the lower β-sheet, and the switch from parallel to antiparallel strands is completed.
The fibrillar structures we observed in our simulations exhibit a twist whose degree decreases as the number of β-sheet layers increases, as can be seen by examining the trends in Fig. 4. For example, the bilayered β-sheets in Fig. 4 b exhibit the most twist. Fig. S3 shows distributions of the angle between neighboring strands on a β-sheet. The decrease in twist with increasing number of layers is consistent with the recent experimental microscopy image for β-lactoglobulin fibrils showing multistranded helical fibrils whose pitch depends on the number of β-sheet layers (47).
Positions of side-chain centroids and the steric zipper interface
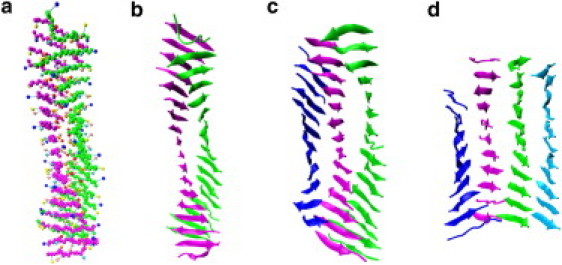
An analysis of the positions of side-chain centroids when the protofilaments are perfectly antiparallel shows that side chains L17, F19, and A21 are on the inside of the bilayered structure (between the sheets) shown in Fig. 8 a, whereas side chains K16, V18, F20, and E22 are on the outside. This type of structure is similar to the so-called steric-zipper interface in the cross-β-spines observed for GNNQQNY by the Eisenberg group (4, 41). Thus, even though our side chains are represented rather simply by a single sphere, and the peptide assembly process is kinetic, the fibrils that form spontaneously in our simulations exhibit interdigitized side-chain steric zipper patterns within a well-ordered antiparallel fibril structure. Having residues L17, F19, and A21 reside on the inside of the bilayer is consistent with the following atomistic stability simulation results obtained for KLVFFAE: the lowest-energy conformation, PARLFA, found by Röhrig et al. (23); the second-lowest binding free-energy conformation, AregBB, found by Park et al. (25); and the bilayered model structure used by Krone et al. (26).
Figure 8.
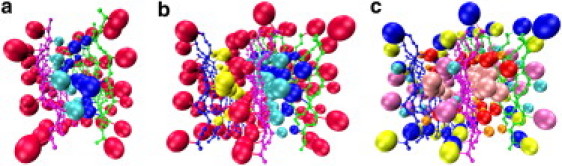
Views down the fibril axis of twisted β-sheets, showing only eight strands per sheet taken from middle of fibrillar sheets in Fig. 2, b and c. Backbone NH, CO, and CαH are reduced in size for ease of viewing. Large spheres representing side-chain centroids are scaled according to side-chain sizes. (a) Bilayered fibril obtained at T∗ = 0.197, c = 10 mM. (b) Trilayered fibril at T∗ = 0.20, c = 20 mM. Side chains for K16, V18, F20, and E22 are all colored red. Side chains for L17, F19, and A21 are colored as follows: blue for right (green) sheet, turquoise for middle (magenta) sheet, and yellow for left (blue) sheet. (c) Trilayer fibril structure showing locations of individual side chains: K (blue), L (red), V (turquoise), F19 (pink), F20 (mauve), A (orange), and E (yellow).
The steric zipper interfaces for the tri- and quad-layer β-sheet structures that formed in our simulations are more complex than those in the bilayer. Fig. 8, b and c, show the structure of the ordered trilayer and the positions of the side chains at a temperature slightly below the transition temperature. This structure evolves over the course of the simulation in the following way: The bilayered cross-β-sheet assembles early in the simulation, adopting a conformation that is stabilized by interdigitation of amino acids L17, F19, and A21 (see Fig. 8 a). The third β-sheet (blue backbone and yellow side chains) grows onto the preexisting bilayer by forming a steric zipper in which side chains L17, F19, and A21 on the new (third) β-sheet interdigitize with the outside side chains K16, V18, F20, and E22 on the already formed bilayer. This interface pattern is in agreement with PARmixed (23) and AregFB (25), which was shown to be stable in atomistic simulations. It is the only interface pattern that is capable of forming periodic stacks, and is an example of a class 6 steric zipper (antiparallel, face-to-back, up = down) according to the classification of Sawaya et al. (41). It is also consistent with the interface pattern suggested by Mehta et al. (24), who considered five-layer periodic structures. The type of β-sheet stack we saw at the end of our simulations is very much a consequence of kinetic processes, and as such is different from the other periodic or laminated stacks found in atomistic stability simulations (23, 24, 25).
Discussion and Conclusion
The great strength of our computational approach—its ability to trace out the molecular motions of a large system of nontrivial peptides along the entire fibrillization pathway—is tempered by some weaknesses and cautions having to do with how faithfully this coarse-grained model represents real experiments in vitro or even all-atom simulations. Obviously, our model peptides easily form the backbone hydrogen bonds that are necessary to create β-sheets when the thermal excitations are sufficient to overcome hydrophobic free-energy trapping in rather amorphous aggregates. This is an advantage of our approach, but it does make it more difficult under low thermal fluctuations to examine transitions from disordered aggregates to ordered structures. This is due in part to our use of a square-well potential and simple side-chain geometry, which makes it harder for the aggregates in meta-stable states to overcome the energetic barriers by making very small consecutive modifications on the way to the global ordered structure. Although having a single-sphere side chain is an asset in terms of having a fast code, and is good enough for small hydrophobic residues such as alanine or valine, it is a liability when representing large aromatic residues such as F, Y, and W. This is because we are unable to describe the π-π interactions between rings, which require information on the rotational conformation of the side chains. Consequently, shape complementarity between sheets is not as well described as it might be. The single-sphere side chain also makes it harder to model the behavior of polar side chains such as Q and N, which are important in the prion sequences (4, 48), because we cannot easily represent side-chain to side-chain hydrogen bonding, a directional potential. Having a single-sphere side chain makes it harder to accurately represent salt bridge interactions between charged side chains, an interaction that is known to play a key role in Aβ42 amyloid fibril formation. Therefore, at present, it is not easy to apply our model to full-length Aβ40 or Aβ42, which is our ultimate objective and a tremendous challenge. We are now working to extend our model to have multibead side chains and a more elaborate potential so as to simulate the aggregation of longer and more-realistic peptides. The key here is to include only those refinements that are essential; adding in too much detail will slow down the code to the point where we will be unable to observe fibril formation.
One of the most promising and thought-provoking results from these simulations is our observation of perfect antiparallel β-sheets at high temperatures, besides the mixed parallel/antiparallel β-sheets observed at low temperature. The promise, of course, stems from the fact that this is consistent with experiments and stability studies. It is thought-provoking because of our general observation that it can be difficult to determine which state (parallel, antiparallel, or mixed) is the true equilibrium state, both in simulations starting from random configurations (16, 20, 49) and in well-ordered atomistic stability simulations (50), because the free-energy difference between candidate equilibrium states can be quite small.
In summary, we performed large-scale, intermediate-resolution MD simulations of the spontaneous formation of fibrils by a system containing 48 Aβ16-22 peptides. We accomplished this by applying DMD to PRIME20, an implicit solvent protein model that is applicable to all 20 amino acids (44). This is the first time, to our knowledge, that the aggregation process for a very large system (48 peptides) of nontrivial peptides (Aβ16-22) has been mapped out along the entire fibrillization pathway, from an initial configuration of random coils to twisted protofilaments with registered β-sheets and cross-β-structures. Our simulations provide molecular-level insights into how the evolution of the assembly process over time influences the nature of the final fibrillar structure. We observed two types of fibrillization mechanisms depending on the temperature, namely, nucleation/templated growth at and near a transition temperature above which fibrils do not form, and an oligomeric merging/structural rearrangement at lower temperatures similar to the nucleated conformational conversion mechanism. The positions of the side-chain centroids in our simulations are arranged in a well-ordered cross-β-spine and delineate the steric zipper pattern observed by the Eisenberg group (4, 41) for GNNQQNY, even though our one-bead side-chain model does not allow for a detailed representation of shape complementarity. Most of the structural details observed in experiments (24, 39) and stability simulations (23, 24, 25, 26), including multilayered fibrils with perfectly antiparallel β-strands that are in-register and contain a regular twist, a coherent steric zipper interface, and interstrand and intersheet distance, are well captured. Our success in mapping out the predominant kinetics and the structural characteristics for twisted protofilaments with cross-β-structure for a system of 48 Aβ16-22 peptides, and in generating a computational realization of spontaneous formation of fibrils along the entire fibrillization pathway demonstrates the potential usefulness of the DMD/PRIME20 approach. Other recent successes achieved with intermediate-resolution models include the PROFASI-model-based observation by Li et al. (20) of medium-sized (24-peptide) protofilaments for the amyloid τ fragment VQIVYK using Monte Carlo simulation. All of these efforts bring us one step closer to being able to make a genuine contribution to the amyloid field, and in particular to develop therapeutic strategies to treat the amyloid diseases.
Acknowledgments
The authors thank David Eisenberg and James Stroud for useful comments and suggestions.
This work was supported by the National Institutes of Health (grants GM56766 and EB006006 to M.C. and C.K.H.) and National Creative Research Initiatives (Center for Proteome Biophysics) of the National Research Foundation/Ministry of Education, Science and Technology, Korea (grant 2008-0061984 to M.C. and I.C.).
Editor: Scott Feller.
Footnotes
This is an Open Access article distributed under the terms of the Creative Commons-Attribution Noncommercial License (http://creativecommons.org/licenses/by-nc/2.0/), which permits unrestricted noncommercial use, distribution, and reproduction in any medium, provided the original work is properly cited.
Three figures and two movies are available at http://www.biophysj.org/biophysj/supplemental/S0006-3495(11)01018-6.
Contributor Information
Iksoo Chang, Email: iksoochang@pusan.ac.kr.
Carol K. Hall, Email: hall@ncsu.edu.
Supporting Material
References
- 1.Dobson C.M. Protein folding and misfolding. Nature. 2003;426:884–890. doi: 10.1038/nature02261. [DOI] [PubMed] [Google Scholar]
- 2.Selkoe D.J. Folding proteins in fatal ways. Nature. 2003;426:900–904. doi: 10.1038/nature02264. [DOI] [PubMed] [Google Scholar]
- 3.Chiti F., Dobson C.M. Protein misfolding, functional amyloid, and human disease. Annu. Rev. Biochem. 2006;75:333–366. doi: 10.1146/annurev.biochem.75.101304.123901. [DOI] [PubMed] [Google Scholar]
- 4.Nelson R., Sawaya M.R., et al. Eisenberg D. Structure of the cross-β spine of amyloid-like fibrils. Nature. 2005;435:773–778. doi: 10.1038/nature03680. [DOI] [PMC free article] [PubMed] [Google Scholar]
- 5.Petkova A.T., Yau W.M., Tycko R. Experimental constraints on quaternary structure in Alzheimer's β-amyloid fibrils. Biochemistry. 2006;45:498–512. doi: 10.1021/bi051952q. [DOI] [PMC free article] [PubMed] [Google Scholar]
- 6.Walsh D.M., Klyubin I., et al. Selkoe D.J. Naturally secreted oligomers of amyloid β protein potently inhibit hippocampal long-term potentiation in vivo. Nature. 2002;416:535–539. doi: 10.1038/416535a. [DOI] [PubMed] [Google Scholar]
- 7.Gong Y., Chang L., et al. Klein W.L. Alzheimer's disease-affected brain: presence of oligomeric Aβ ligands (ADDLs) suggests a molecular basis for reversible memory loss. Proc. Natl. Acad. Sci. USA. 2003;100:10417–10422. doi: 10.1073/pnas.1834302100. [DOI] [PMC free article] [PubMed] [Google Scholar]
- 8.Kayed R., Head E., et al. Glabe C.G. Common structure of soluble amyloid oligomers implies common mechanism of pathogenesis. Science. 2003;300:486–489. doi: 10.1126/science.1079469. [DOI] [PubMed] [Google Scholar]
- 9.van der Wel P.C., Lewandowski J.R., Griffin R.G. Solid-state NMR study of amyloid nanocrystals and fibrils formed by the peptide GNNQQNY from yeast prion protein Sup35p. J. Am. Chem. Soc. 2007;129:5117–5130. doi: 10.1021/ja068633m. [DOI] [PubMed] [Google Scholar]
- 10.Ma B., Nussinov R. Simulations as analytical tools to understand protein aggregation and predict amyloid conformation. Curr. Opin. Chem. Biol. 2006;10:445–452. doi: 10.1016/j.cbpa.2006.08.018. [DOI] [PubMed] [Google Scholar]
- 11.Lührs T., Ritter C., et al. Riek R. 3D structure of Alzheimer's amyloid-β(1-42) fibrils. Proc. Natl. Acad. Sci. USA. 2005;102:17342–17347. doi: 10.1073/pnas.0506723102. [DOI] [PMC free article] [PubMed] [Google Scholar]
- 12.Petkova A.T., Leapman R.D., et al. Tycko R. Self-propagating, molecular-level polymorphism in Alzheimer's β-amyloid fibrils. Science. 2005;307:262–265. doi: 10.1126/science.1105850. [DOI] [PubMed] [Google Scholar]
- 13.Paravastu A.K., Leapman R.D., et al. Tycko R. Molecular structural basis for polymorphism in Alzheimer's β-amyloid fibrils. Proc. Natl. Acad. Sci. USA. 2008;105:18349–18354. doi: 10.1073/pnas.0806270105. [DOI] [PMC free article] [PubMed] [Google Scholar]
- 14.Lipfert J., Franklin J., et al. Doniach S. Protein misfolding and amyloid formation for the peptide GNNQQNY from yeast prion protein Sup35: simulation by reaction path annealing. J. Mol. Biol. 2005;349:648–658. doi: 10.1016/j.jmb.2005.03.083. [DOI] [PubMed] [Google Scholar]
- 15.Klimov D.K., Thirumalai D. Dissecting the assembly of Aβ16-22 amyloid peptides into antiparallel β sheets. Structure. 2003;11:295–307. doi: 10.1016/s0969-2126(03)00031-5. [DOI] [PubMed] [Google Scholar]
- 16.Favrin G., Irbäck A., Mohanty S. Oligomerization of amyloid Aβ16-22 peptides using hydrogen bonds and hydrophobicity forces. Biophys. J. 2004;87:3657–3664. doi: 10.1529/biophysj.104.046839. [DOI] [PMC free article] [PubMed] [Google Scholar]
- 17.Soto P., Griffin M.A., Shea J.E. New insights into the mechanism of Alzheimer amyloid-β fibrillogenesis inhibition by N-methylated peptides. Biophys. J. 2007;93:3015–3025. doi: 10.1529/biophysj.107.112086. [DOI] [PMC free article] [PubMed] [Google Scholar]
- 18.Cheon M., Chang I., et al. Favrin G. Structural reorganisation and potential toxicity of oligomeric species formed during the assembly of amyloid fibrils. PLOS Comput. Biol. 2007;3:1727–1738. doi: 10.1371/journal.pcbi.0030173. [DOI] [PMC free article] [PubMed] [Google Scholar]
- 19.Lu Y., Derreumaux P., et al. Wei G. Thermodynamics and dynamics of amyloid peptide oligomerization are sequence dependent. Proteins. 2009;75:954–963. doi: 10.1002/prot.22305. [DOI] [PubMed] [Google Scholar]
- 20.Li D.-W., Mohanty S., et al. Huo S. Formation and growth of oligomers: a Monte Carlo study of an amyloid τ fragment. PLOS Comput. Biol. 2008;4:e1000238. doi: 10.1371/journal.pcbi.1000238. [DOI] [PMC free article] [PubMed] [Google Scholar]
- 21.Nguyen P.H., Li M.S., et al. Thirumalai D. Monomer adds to preformed structured oligomers of Aβ-peptides by a two-stage dock-lock mechanism. Proc. Natl. Acad. Sci. USA. 2007;104:111–116. doi: 10.1073/pnas.0607440104. [DOI] [PMC free article] [PubMed] [Google Scholar]
- 22.Ma B., Nussinov R. Stabilities and conformations of Alzheimer's β -amyloid peptide oligomers (Aβ 16-22, Aβ 16-35, and Aβ 10-35): sequence effects. Proc. Natl. Acad. Sci. USA. 2002;99:14126–14131. doi: 10.1073/pnas.212206899. [DOI] [PMC free article] [PubMed] [Google Scholar]
- 23.Röhrig U.F., Laio A., et al. Petronzio R. Stability and structure of oligomers of the Alzheimer peptide Aβ16-22: from the dimer to the 32-mer. Biophys. J. 2006;91:3217–3229. doi: 10.1529/biophysj.106.088542. [DOI] [PMC free article] [PubMed] [Google Scholar]
- 24.Mehta A.K., Lu K., et al. Lynn D.G. Facial symmetry in protein self-assembly. J. Am. Chem. Soc. 2008;130:9829–9835. doi: 10.1021/ja801511n. [DOI] [PubMed] [Google Scholar]
- 25.Park J., Kahng B., Hwang W. Thermodynamic selection of steric zipper patterns in the amyloid cross-β spine. PLOS Comput. Biol. 2009;5:e1000492. doi: 10.1371/journal.pcbi.1000492. [DOI] [PMC free article] [PubMed] [Google Scholar]
- 26.Krone M.G., Hua L., et al. Shea J.E. Role of water in mediating the assembly of Alzheimer amyloid-β Aβ16-22 protofilaments. J. Am. Chem. Soc. 2008;130:11066–11072. doi: 10.1021/ja8017303. [DOI] [PMC free article] [PubMed] [Google Scholar]
- 27.Zheng J., Ma B., et al. Nussinov R. Structural stability and dynamics of an amyloid-forming peptide GNNQQNY from the yeast prion sup-35. Biophys. J. 2006;91:824–833. doi: 10.1529/biophysj.106.083246. [DOI] [PMC free article] [PubMed] [Google Scholar]
- 28.Esposito L., Pedone C., Vitagliano L. Molecular dynamics analyses of cross-β-spine steric zipper models: β-sheet twisting and aggregation. Proc. Natl. Acad. Sci. USA. 2006;103:11533–11538. doi: 10.1073/pnas.0602345103. [DOI] [PMC free article] [PubMed] [Google Scholar]
- 29.Zheng J., Jang H., et al. Nussinov R. Modeling the Alzheimer Aβ17-42 fibril architecture: tight intermolecular sheet-sheet association and intramolecular hydrated cavities. Biophys. J. 2007;93:3046–3057. doi: 10.1529/biophysj.107.110700. [DOI] [PMC free article] [PubMed] [Google Scholar]
- 30.Auer S., Dobson C.M., et al. Maritan A. Self-templated nucleation in peptide and protein aggregation. Phys. Rev. Lett. 2008;101:258101. doi: 10.1103/PhysRevLett.101.258101. [DOI] [PubMed] [Google Scholar]
- 31.Auer S., Kashchiev D. Phase diagram of α-helical and β-sheet forming peptides. Phys. Rev. Lett. 2010;104:168105. doi: 10.1103/PhysRevLett.104.168105. [DOI] [PubMed] [Google Scholar]
- 32.Pellarin R., Caflisch A. Interpreting the aggregation kinetics of amyloid peptides. J. Mol. Biol. 2006;360:882–892. doi: 10.1016/j.jmb.2006.05.033. [DOI] [PubMed] [Google Scholar]
- 33.Bellesia G., Shea J.-E. Diversity of kinetic pathways in amyloid fibril formation. J. Chem. Phys. 2009;131:111102. doi: 10.1063/1.3216103. [DOI] [PubMed] [Google Scholar]
- 34.Wu C., Shea J.-E. Coarse-grained models for protein aggregation. Curr. Opin. Struct. Biol. 2011;21:209–220. doi: 10.1016/j.sbi.2011.02.002. [DOI] [PubMed] [Google Scholar]
- 35.Li M.S., Klimov D.K., et al. Thirumalai D. Probing the mechanisms of fibril formation using lattice models. J. Chem. Phys. 2008;129:175101. doi: 10.1063/1.2989981. [DOI] [PMC free article] [PubMed] [Google Scholar]
- 36.Li M.S., Co N.T., et al. Thirumalai D. Factors governing fibrillogenesis of polypeptide chains revealed by lattice models. Phys. Rev. Lett. 2010;105:218101. doi: 10.1103/PhysRevLett.105.218101. [DOI] [PMC free article] [PubMed] [Google Scholar]
- 37.Nguyen H.D., Hall C.K. Molecular dynamics simulations of spontaneous fibril formation by random-coil peptides. Proc. Natl. Acad. Sci. USA. 2004;101:16180–16185. doi: 10.1073/pnas.0407273101. [DOI] [PMC free article] [PubMed] [Google Scholar]
- 38.Marchut A.J., Hall C.K. Side-chain interactions determine amyloid formation by model polyglutamine peptides in molecular dynamics simulations. Biophys. J. 2006;90:4574–4584. doi: 10.1529/biophysj.105.079269. [DOI] [PMC free article] [PubMed] [Google Scholar]
- 39.Tjernberg L.O., Näslund J., et al. Nordstedt C. Arrest of β-amyloid fibril formation by a pentapeptide ligand. J. Biol. Chem. 1996;271:8545–8548. doi: 10.1074/jbc.271.15.8545. [DOI] [PubMed] [Google Scholar]
- 40.Balbach J.J., Ishii Y., et al. Tycko R. Amyloid fibril formation by A β 16-22, a seven-residue fragment of the Alzheimer's β-amyloid peptide, and structural characterization by solid state NMR. Biochemistry. 2000;39:13748–13759. doi: 10.1021/bi0011330. [DOI] [PubMed] [Google Scholar]
- 41.Sawaya M.R., Sambashivan S., et al. Eisenberg D. Atomic structures of amyloid cross-β spines reveal varied steric zippers. Nature. 2007;447:453–457. doi: 10.1038/nature05695. [DOI] [PubMed] [Google Scholar]
- 42.Alder B.J., Wainwright T.E. Studies in molecular dynamics. I. General method. J. Chem. Phys. 1959;31:459–466. [Google Scholar]
- 43.Smith A.V., Hall C.K. α-Helix formation: discontinuous molecular dynamics on an intermediate resolution model. Proteins. 2001;44:344–360. doi: 10.1002/prot.1100. [DOI] [PubMed] [Google Scholar]
- 44.Cheon M., Chang I., Hall C.K. Extending the PRIME model for protein aggregation to all 20 amino acids. Proteins. 2010;78:2950–2960. doi: 10.1002/prot.22817. [DOI] [PMC free article] [PubMed] [Google Scholar]
- 45.Serio T.R., Cashikar A.G., et al. Lindquist S.L. Nucleated conformational conversion and the replication of conformational information by a prion determinant. Science. 2000;289:1317–1321. doi: 10.1126/science.289.5483.1317. [DOI] [PubMed] [Google Scholar]
- 46.Svergun D., Koch M.H. CRYSOL—a program to evaluate X-ray solution scattering of biological macromolecules from atomic coordinates. J. Appl. Cryst. 1995;28:768–773. [Google Scholar]
- 47.Adamcik J.J.M., Jung J.M., et al. Mezzenga R. Understanding amyloid aggregation by statistical analysis of atomic force microscopy images. Nat. Nanotechnol. 2010;5:423–428. doi: 10.1038/nnano.2010.59. [DOI] [PubMed] [Google Scholar]
- 48.Khan M.Q., Sweeting B., et al. Chakrabartty A. Prion disease susceptibility is affected by β-structure folding propensity and local side-chain interactions in PrP. Proc. Natl. Acad. Sci. USA. 2010;107:19808–19813. doi: 10.1073/pnas.1005267107. [DOI] [PMC free article] [PubMed] [Google Scholar]
- 49.Zhang Z., Chen H., et al. Lai L. Molecular dynamics simulations on the oligomer-formation process of the GNNQQNY peptide from yeast prion protein Sup35. Biophys. J. 2007;93:1484–1492. doi: 10.1529/biophysj.106.100537. [DOI] [PMC free article] [PubMed] [Google Scholar]
- 50.Berryman J.T., Radford S.E., Harris S.A. Thermodynamic description of polymorphism in Q- and N-rich peptide aggregates revealed by atomistic simulation. Biophys. J. 2009;97:1–11. doi: 10.1016/j.bpj.2009.03.062. [DOI] [PMC free article] [PubMed] [Google Scholar]
Associated Data
This section collects any data citations, data availability statements, or supplementary materials included in this article.