Abstract
Focused ultrasound (FUS) shows great promise for use in the area of transcranial therapy. Currently dependent on MRI for monitoring, transcranial FUS would benefit from a real-time technique to monitor acoustic emissions during therapy. A polyvinylidene fluoride (PVDF) receiver with an active area of 17.8 mm2 and a film thickness of 110 μm was constructed. A compact preamplifier was designed to fit within the receiver to improve the receiver SNR and allow the long transmission line needed to remove the receiver electronics outside of the MRI room. The receiver was compared with a 0.5 mm commercial needle hydrophone, and focused and unfocused piezoceramics. The receiver was found to have a higher sensitivity than the needle hydrophone, a more wideband response than the piezoceramic and sufficient threshold for detection of microbubble emissions. Sonication of microbubbles directly and through a fragment of human skull demonstrated the ability of the receiver to detect harmonic bubble emissions, and showed potential for use in a larger scale array. Monitoring of disruption of the blood brain barrier in rats showed functionality in vivo, and the ability to detect subharmonic, harmonic and wideband emissions during therapy. The receiver shows potential for monitoring acoustic emissions during treatments and providing additional parameters to assist treatment planning. Future work will focus on developing a multi-element array for transcranial treatment monitoring.
Index Terms: Blood Brain Barrier, Focused Ultrasound (FUS), PVDF Hydrophone, Transcranial Therapy
I. INTRODUCTION
Focused ultrasound (FUS) shows promise in transcranial applications including tissue ablation [1–6] and disruption of the blood-brain barrier (BBB) [7–12]. The complex geometry of the skull and the high attenuation of sound through bone create unique challenges for transcranial therapy. Several methods have been used, with success, to overcome the high levels of attenuation and aberration through the skull and produce a sharp transcranial focus. These include low frequency focused transducers [1], shear wave transmission [13–15] and phased arrays [1, 2, 4, 5, 16].
Transcranial FUS currently relies on magnetic resonance imaging (MRI) to monitor therapy, which only provides information on the temperature elevation and the effect of the therapy (such as tissue coagulation and BBB disruption after the exposure) and does not provide feedback on the generated sound field itself. Although MRI-monitored thermal effects are of importance, equally important are the indicators of non-thermal effects, such as the interaction of contrast agent microbubbles with the generated sound field in blood brain barrier disruption (BBBD)[8]. The addition of diagnostic capabilities to a transcranial therapy transducer would not only allow for non-thermal treatment effects to be monitored, but could provide important information regarding the generated sound field.
Cavitation detection, both active [17] and passive [18, 19], is a well established field of study. Cavitation has been investigated as a means to monitor different ultrasound therapy procedures [20–23]. In BBBD, the appearance of harmonic signal components has been shown to correlate with BBB disruption[8]. This could eventually lead to BBB therapy conducted independently of MRI. In that study, a narrow-band receiver was used, and low frequency noise made detection of subharmonics impossible. A sufficiently wideband receiver would allow for acquisition of signals with more complete spectral information, without receiver induced limitations. Further, in thermal applications where inertial cavitation is of interest, or of concern, the receivers would allow monitoring of the bubble activity, which could be correlated with the tissue heating information gained from MRI.
Polyvinylindenefluoride (PVDF) is a piezoelectric polymer which has been extensively used in medical ultrasound [24]. Although PVDF has been used in high frequency imaging transducers [25], the acoustic power output from PVDF transducers is much less than from piezoceramic transducers [26], making PVDF transducers unsuitable for therapeutic purposes. However, PVDF’s high sensitivity, broadband response and close acoustic match to water make it an excellent material choice for ultrasound receivers, and it has been widely used in needle and membrane hydrophones [24, 27–30]. PVDF has previously been used to monitor acoustic cavitation [31], and we hypothesize that PVDF receivers may be used in combination with piezoceramic therapy elements to create a therapeutic transcranial array with monitoring capabilities.
The 1372 element phased array presented by Song and Hynynen [16] consists of laterally coupled piezoceramic ring elements operating in extension mode, and set within a hemispherical dome of 30 cm diameter. PVDF receivers placed in the middle of the rings and aligned with the acoustic axes of the individual elements would allow the individual hybrid elements to act in a transmit-receive mode, and would make use of the available space within the ring elements. Multiple receivers would allow microbubble harmonic emissions or broadband inertial cavitation emissions to be detected and localized using passive beamforming techniques [32–34] and possibly used to control the exposure [8]. Unfortunately commercially available hydrophones are expensive, not MRI compatible, and often too large to be used for this purpose with arrays that that have a large number of elements. Therefore alternatives are required in order to be able to harness the control potential of the acoustic emissions from the oscillating microbubbles in the brain vasculature. The goal of the current research is to create a low-cost, MR-compatible wideband receiver with high sensitivity and a flat response over the frequency range of approximately 100 kHz – 1.5 MHz, corresponding to clinically relevant frequencies in transcranial therapy. Further, the receiver must be designed so as to be contained within and function in combination with one of the above described cylindrical transmit elements to form a dual-purpose pair.
In this paper a low cost, MRI-compatible and miniature PVDF receiver is presented and directly compared with a commercial needle hydrophone. The ability of the PVDF receiver to function in combination with a ceramic transmit element is demonstrated. Microbubbles were sonicated through a fragment of human skull, establishing the proposed receiver’s ability to detect transcranial harmonic emissions. Finally, the receiver was implemented to monitor BBB disruption in rats and to demonstrate its ability to detect differences between signals emitted during sonications producing different biological effects. Preliminary results from this study have been reported [35].
II. Materials and Methods
A. Receiver Construction
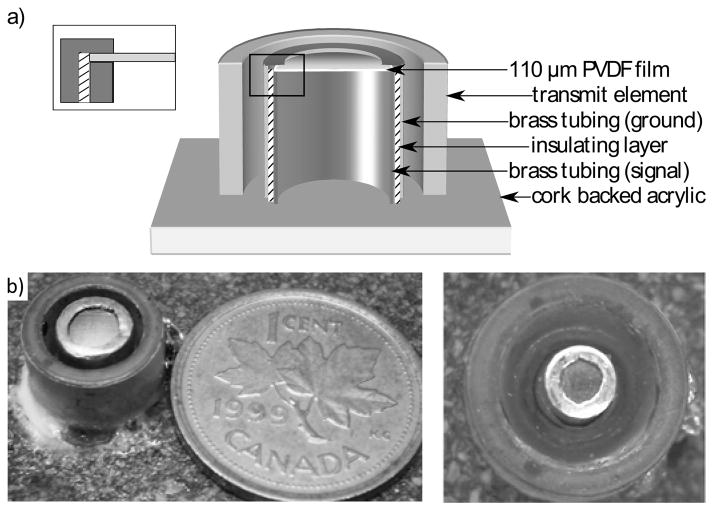
110 μm-thick metalized PVDF film (Measurement Specialties Inc., Hampton, VA, USA), with NiCu electrodes (700 Å Cu, 100 Å Ni) and an active area of approximately 17.8 mm2, was stretched across brass tubing having a diameter of 4.76 mm. A thin electrically insulating layer (Glad Press’n Seal wrap) was applied around the tubing leaving the face of the tube exposed. A second length of brass tubing, which had been worked to create a rim at the top edge, was used to clamp the PVDF film. Figure 1 shows the PVDF film resting between the un-insulated face of the inner tube and the worked rim of the outer tube, with these two surfaces forming the electrode connections. The tubes were held together using a nylon set screw. Signal and ground connections were made to the internal and external brass tubes respectively, as shown in the drawing.
Fig. 1.
Cut-section showing receiver construction (top). The PVDF film clamped between two brass tubes; Large receiver and transmit element pair (bottom left); Small receiver and transmit element pair (bottom right)
A small preamplifier with 20 dB of gain was constructed and enclosed within the brass tubing to improve the receiver SNR and to drive the long coaxial cables required to reach outside the MRI. The tubing was sealed to provide air backing, and the receiver was mounted through a piece of cork-backed acrylic, inside a PZT-4 cylinder element (h=6mm; internal diameter=7mm; external diameter=10mm; length mode resonance frequency f=306 kHz) similar to the ones used in an existing 1372 element transcranial array [16] (fig. 1b). In air-backing the receiver, some bandwidth was sacrificed in order to be able to enclose the preamplifier entirely within the receiver. Parylene coating was applied to electrically insulate the device and to prevent corrosion. A second, smaller receiver with a diameter of 2.4 mm was constructed using the same method in order to examine the feasibility of reducing the receiver active area to improve the field of view.
B. Preamplifier Design and Characterization
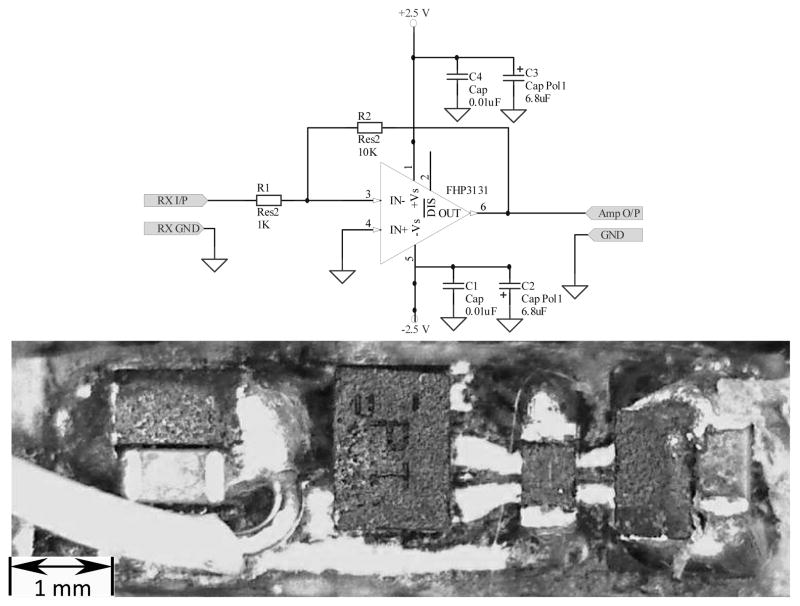
To minimize the electrical noise introduced to the system, the preamplifier had to be contained within the grounded brass tubing, limiting the circuit board dimensions. Additionally, an op-amp with a large bandwidth was desired to avoid narrowing the bandwidth of the receiver beyond the range of interest. The selected op-amp (FHP3131, Fairchild Semiconductor Corporation, California, USA) has a unity gain bandwidth of 70 MHz and component dimensions of 1.45 × 1.00 × 0.55 mm (6 Lead MicroPak). The circuit, shown in fig. 2, provides 20dB of gain. The resulting single-sided circuit board was constructed in-house and had board dimensions of 7.1 × 1.8 mm.
Fig. 2.
Preamplifier circuit diagram (top); populated circuit board (bottom)
The response of the preamplifier circuit over a range of frequencies (0.1–5 MHz), rail voltages and coaxial cable lengths was examined, both with and independently of the PVDF receiver.
C. MRI Compatibility
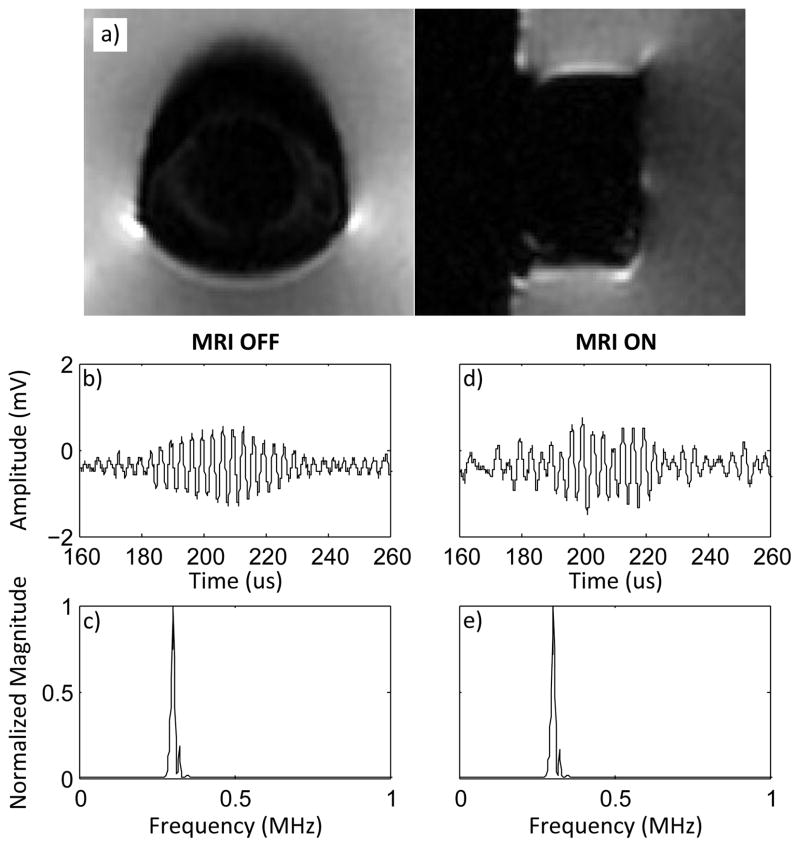
The receiver was imaged in a 1.5 T MRI (Signa 1.5 T, General Electric, Fairfield, Connecticut, USA) to determine the level of interference, if any, with the MRI. A sonication was performed during MR image acquisition to demonstrate functionality of the device in the MRI.
D. Receiver Characterization
The receiver sensitivity was measured at the fundamental frequency and 3rd harmonic of the transmit element using a characterized element and was compared with both a 0.5 mm commercial needle hydrophone (Precision Acoustics, Dorset, UK), and a PZT-4 element of the same size and shape as the receiver. The sensitivity of the receiver was further measured at four frequencies ranging from 649 kHz to 4.589 MHz using an existing, in-house constructed, calibrated transducer. Both the transmit element and calibrated transducer were calibrated using a scanning laser vibrometer (PSV-400 Scanning Vibrometer, Polytec, Waldbronn, Germany) to measure the particle velocity of a membrane placed normal to the acoustic axis and at a fixed distance from the transducer [36]. The peak pressures resulting from different excitation voltages were then calculated. The SNR of the receiver and the hydrophone were compared when each device was used in receive mode only, by placing the receiver and hydrophone in the field, and when acting in a transmit/receive pair. For this comparison, the needle hydrophone was mounted through the center of the transmit element in the same configuration as the constructed receiver. A function generator (AFG3102, Tektronix, TX, USA) was used to send a pulse train to a power amplifier (KAA2030, AR, Washington, USA) and then to the transmit element. The receiver signal was received using a signal amplifier (DA1820A, LeCroy, NY, USA) and digital oscilloscope (TDS3014B, Tektronix). The signals were transferred from the oscilloscope to the computer using a GPIB interface and LABVIEW software (National Instruments, TX, USA). Data analysis was performed in MATLAB (Mathworks, MA, USA).
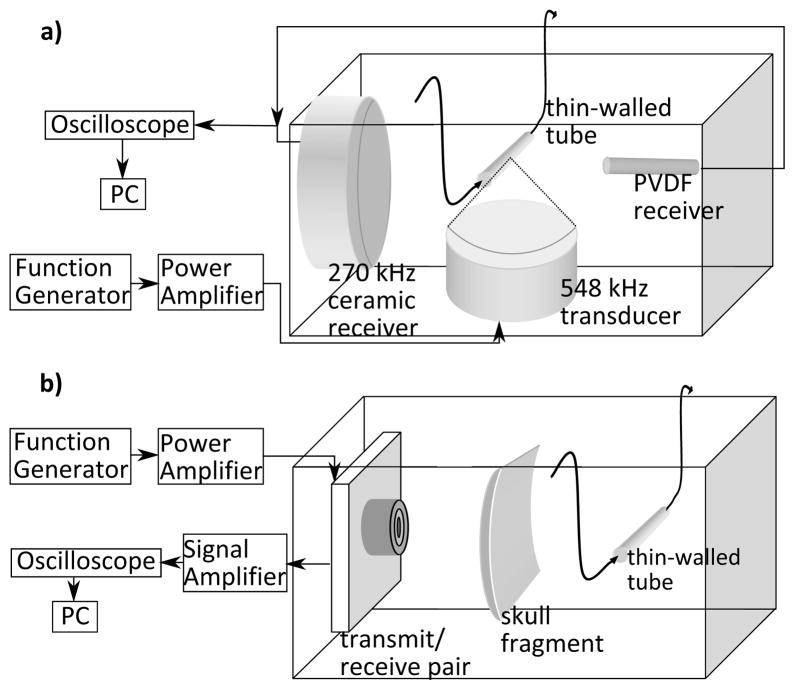
The thresholds for detection of various microbubble emissions were established by sonicating a solution of Definity contrast agent (Lantheus Medical Imaging, MA, USA) in a thin walled tube (0.0152 –0.0203 mm double wall thickness, 2mm diameter medical balloon, Advanced Polymers Inc., NH, USA) using a 0.548 MHz spherically focused therapy transducer (5 cm aperture, FN=1) as shown in figure 3a. A focused passive transducer (5 cm aperture, FN=2) with a center frequency of 0.270 MHz was co-focused with the therapy transducer at the tubing. Focusing was achieved using a 0.10 μm planar fiber-optic hydrophone (Precision Acoustics Ltd., Dorset, UK). The PVDF receiver was then aligned with the tubing opposite the passive receiver. 10 ms bursts were delivered with increasing focal pressure until wideband emission were detected. Waveforms from each burst were captured using a LeCroy WavePro 715Zi oscilloscope (LeCroy, Chestnut Ridge, NY, USA) and transferred to computer for analysis in MATLAB.
Fig. 3.
a)Experimental setup, receiver characterization; b) Transcranial bubble excitation (bottom)
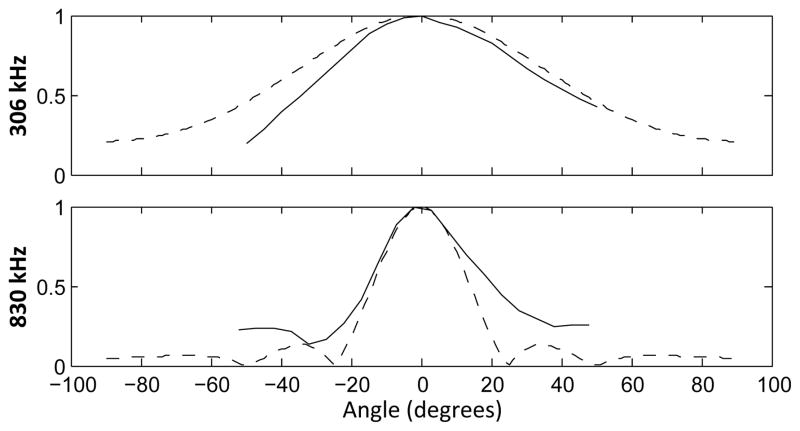
The directivity of the receiver was measured using a ring transmit element which was mounted at the end of a rotational arm and was used to sonicate the receiver at the centre of rotation. The signal strength was measured for 180 degrees of incidence in 5 degree steps. This was performed for the fundamental frequency (306 kHz) and the 3rd harmonic of the transmit element (830 kHz). The measured results were compared with the theoretical values obtained using the normalized far-field directivity function for a circular piston [37],
| (1) |
where J1 is the first order Bessel function of the first kind, a is the radius of the receiver and λ is the wavelength.
E. Transcranial Bubble Excitation
The transmit/receive pair was used to excite a solution of Definity contrast agent in a thin-walled tube (0.0152 – 0.0203 mm double wall thickness, 2mm diameter medical balloon) both directly and in the presence of a fragment of human skull. The experimental setup is illustrated in fig. 3b. The thin walled tube was mounted in a tank filled with degassed, de-ionized water. Rubber (Neoprene 70 durometer, Global Rubber Products Ltd., Toronto, ON, Canada), with approximately 4.5% reflected intensity at 1 MHz based on tests conducted in this laboratory, was used as an absorber to reduce unwanted reflections from the tank walls and bottom. To further reduce the impact of reflections, short bursts were used. All sonications consisted of 10 cycle bursts at 10 ms intervals. The transmit/receive pair was mounted on a three-axis stage and was aligned with the thin walled tube by maximizing the reflection from the tube when it was filled with air. After alignment, the tube was filled with degassed water and a reference sonication was performed. The captured reference waveform was subtracted from subsequent sonications to remove the reflections from the tubing, tubing mount and other parts of the tank, as well as reduce the effects of coupling with the transmit element. Attempts were made to repeat the experiment with the commercial hydrophone, however alignment of the hydrophone with the tubing was impossible, as the reflected signal was completely lost in the electrical coupling with the transmit element.
The acoustic pressure at the tubing was measured using the 0.5 mm needle hydrophone. The waveforms captured using the needle hydrophone were analyzed to confirm that no harmonic signals were present in the outgoing therapy pulse. The hydrophone was then removed and 25:1 and 100:1 solutions of Definity contrast agent were injected into the tubing, which was then sonicated using the transmit element. Reflected waveforms detected with the PVDF receiver for each solution were recorded. Pulse inversion techniques [38] were used to amplify the harmonic components of the reflected waveform. A fragment of human skull was placed between the transmit/receive pair and the tubing, and the alignment, hydrophone pressure measurements and reference waveform acquisition procedures were repeated. Sonications were performed for 100:1, 25:1 and 10:1 Definity solutions. A second transmit element was used to increase the pressure at the tubing and sonications were repeated. Measurement of the acoustic pressure at the tubing using the needle hydrophone was performed to ensure that the addition of the second transmit element had increased the local acoustic pressure rather than causing phase cancelations.
F. In vivo Monitoring of BBB Disruption
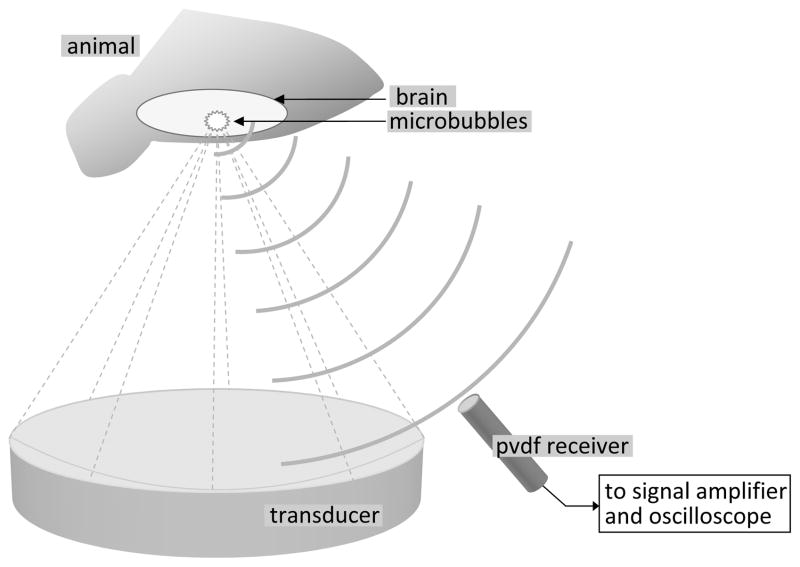
The receiver was used to monitor disruption of the blood-brain barrier in rats to examine its effectiveness in monitoring transcranial therapy given more realistic concentrations of microbubbles and realistic therapeutic pressures. Disruption of the BBB was performed in 6 rats using a 558 kHz spherically focused transducer (10 cm diameter, 78 mm focal length), and the three axis positioning system described by Chopra et al. [39]. To avoid introducing harmonic components to the transmitted pulse, the therapy transducer was matched to 50 Ω at 558 kHz using an external matching circuit, and the power input to the RF power amplifier was kept far below the saturation point of the amplifier, as measured with a 50 Ω load. 10 ms ultrasound bursts were delivered at the repetition frequency of 1 Hz for 2 minutes. The applied electrical power was kept constant during the bursts of each sonication but it was varied from sonication to sonication between 0.24 – 1.17 W, at an efficiency of approximately 76%, which corresponds to an applied acoustic power range of 0.18 – 0.88 W. The corresponding peak negative pressure amplitudes in situ were estimated to be 0.14 – 0.33 MPa taking the attenuation in the brain to be approximately 5 Np/m/MHz [40] and assuming the transmission through rat skull to be approximately 73%, based on previous measurements taken in this lab. The peak negative acoustic pressure amplitude was calibrated using a scanning laser vibrometer (PSV-400 Scanning Vibrometer, Polytec, Waldbronn, Germany) and the acoustic power output using a radiation force measurement system with an absorbing target [41]. The PVDF receiver was mounted on the positioning arm, directed towards the focus, as illustrated in fig. 4. The signal was amplified using a 35 dB gain MITEQ preamplifier (AU 1583, MITEQ, New York, USA), in addition to the built-in 20dB gain preamplifier, and captured using a LeCroy WavePro 715Zi oscilloscope (LeCroy, Chestnut Ridge, NY, USA). Waveforms were captured and stored approximately every 3 seconds for the duration of the sonications.
Fig. 4.
Positioning system arm with transducer and PVDF receiver
Six animals (Wistar; 303–380 g) were anesthetized using a mixture of ketamine (40–50 mg/kg) and xylazine (10 mg/kg) injected intraperitoneally. Their heads were shaved and depilated to remove hair from the ultrasound path. The animals were placed supine on the positioning system table with their heads over the transducer, in contact with the water. Single point sonications were performed at four separate locations in each rat. Sonication locations were selected from T2-weighted MR images taken in a 1.5 T MRI (Signa 1.5 T, General Electric). A bolus of Definity contrast agent (0.02 ml/kg) was injected, via a tail vein catheter, immediately before the start of sonication. A minimum delay of 4 minutes was allowed between sonications to allow the contrast agent to clear from the system. Opening was confirmed via contrast enhanced (OmniScan, 0.2 ml/kg) T1-weighted MRI images and T2-weighted images were used to check for edema (Table 1). In two rats, sonication of the first location was performed at low power, and when BBB disruption was not observed, the same locations were sonicated a second time using a higher power. A total of 26 sonications were performed at 24 separate locations. Waveforms were analyzed using MATLAB and results were compared with the captured MR images.
TABLE I.
MR Parameters
| Scan Type | T1-weighted | T2-weighted |
|---|---|---|
| Sequence | FSE | FSE |
| TE | 10 ms | 60.6 ms |
| TR | 500 ms | 2000 ms |
| ETL | 4 | 4 |
| FOV | 6 cm × 6 cm | 6 cm × 6 cm |
| Slice Thickness | 1 mm | 1 mm |
| Matrix | 128 × 128 | 128 × 128 |
Thorough reviews of acoustic emissions during cavitation exist [42, 43] and will therefore not be covered in depth in this paper. During analysis, the presence of harmonics, sub-harmonics and ultra-harmonics were considered to mark microbubble presence and stable cavitation, whereas inertial cavitation was identified by a sharp rise in broadband emissions. To account for harmonics arising from the non-linearity of the tissue and water, harmonic signal strengths were considered relative to the waveform acquired at time t=0s, when contrast agent would not be present.
III. Results
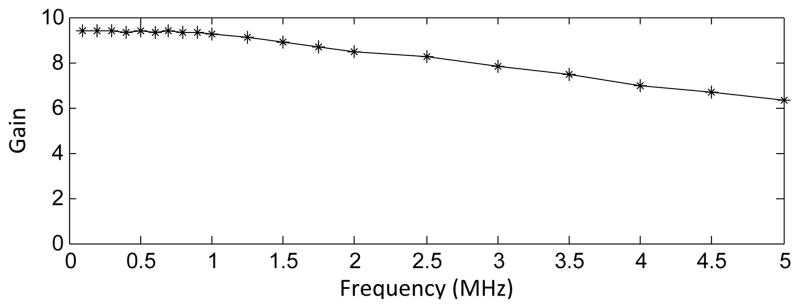
The preamplifier produced high gain over a reasonable frequency range. The −3 dB point of the gain occurred around 4 MHz, with roll-off beginning around 1 MHz (fig. 5).
Fig. 5.
Frequency response of the preamplifier
Supplied rail voltages and load had little effect on the gain of the amplifier, which was able to drive loads across coaxial cable lengths of 8.5 m without loss of signal strength (81 mV peak-to-peak for a 1.5 m cable; 82 mV peak-to-peak for a 8.5m cable), sufficient to drive the signal outside the MRI.
Imaging of the device revealed small artifacts near solder points (fig. 6). The artifacts did not extend far from the surface of the device and would therefore not interfere with imaging of the brain during therapy. Waveforms captured while in or near the MRI bore while the MRI was not imaging showed little or no distortion (fig. 6). Acquiring MR images while simultaneously operating the device in pulse-echo mode added some distortion to the ultrasound signal (fig. 6). However, the frequency content of the signal was not substantially altered, and even at low amplitudes the reflected waveforms were still discernable.
Fig. 6.
A) MR images of receive/transmit pair in water; b) pulse-echo while in MRI bore with MRI off; c) frequency spectrum from 0–1 MHz while in MRI bore with MRI off; d) pulse-echo while in MRI bore while acquiring MRI; e) frequency spectrum from 0–1 MHz while in MRI bore while acquiring MRI.
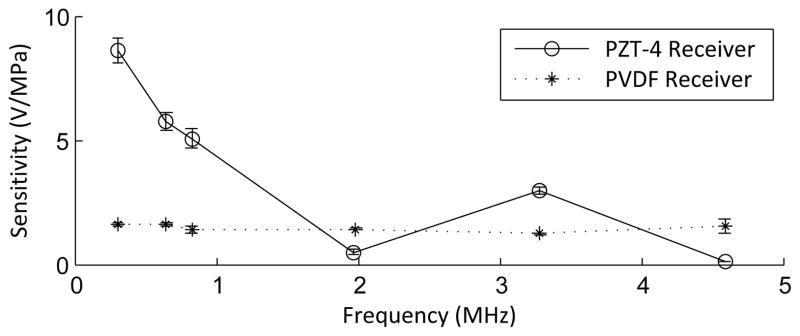
The sensitivity of the PVDF receiver (1.62 ± 0.09 V/MPa at 306 kHz; 1.38 ± 0.16 V/MPa at 830 kHz) was 6.8 times and 4.1 times that of the 0.5 mm commercial hydrophone (0.24 ±0.01 V/MPa at 306 kHz; 0.34 ± 0.03 V/MPa at 830 kHz) at 306 kHz and 830 kHz respectively. By comparison, the smaller receiver sensitivities were 0.88 ± 0.03 V/MPa at 306 kHz and 1.12 ± 0.09 V/MPa at 830 kHz. As expected, the PZT-4 had a much higher sensitivity than the PVDF (fig. 7), however it also had a greater variation in sensitivity over the range examined. At higher frequencies, the receiver displayed a similar frequency response to the preamplifier, rolling-off around 1 MHz. Correcting for the response of the preamplifier, a flat trend was obtained (fig. 7). The sensitivity variations in the corrected response are consistent with the variations at low frequency observed in needle-type polymer hydrophones [44, 45], although the expected periodic nature of these fluctuations due to finite aperture effects and reflections along the brass tubing may be not be completely visible given only a few data points. Since frequencies above 1.5 MHz are not expected to be detected through the human skull due to the large attenuation through the skull associated with higher frequencies [46], the response of the receiver was accepted.
Fig. 7.
Sensitivity of the PVDF receiver corrected for the preamplifier characteristics, and sensitivity of a PZT-4 receiver with the same effective area. Error bars indicate one standard deviation.
Both devices demonstrated a high SNR when used in receive-only mode. The SNR of the PVDF receiver was 61.1 ± 4.9 while that of the commercial hydrophone was 90.8 ± 6.2. However, when used in the transmit/receive configuration, the commercial hydrophone was more susceptible to electrical coupling with the transmit element. In this instance, the SNR of the hydrophone decreased to 0.41, compared with an SNR of 16.43 for the PVDF receiver. A single waveform was used for this comparison as it proved too difficult to repeatedly capture the reflected waveform with the needle hydrophone.
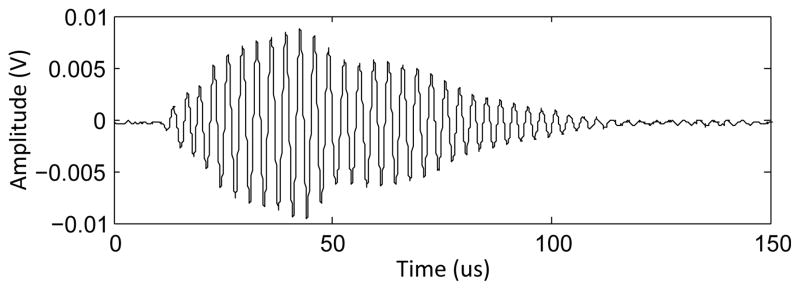
When placed inside the transmit element, the receiver was also subject to acoustic coupling with the transmit element (fig. 8). This signal component was removable through filtering of the fundamental frequency during post-processing. In the intended application of monitoring therapy, this would leave the signal components of interest, namely the microbubble harmonic emissions and any wideband emissions.
Fig. 8.
Response of the receiver during sonication into free-field.
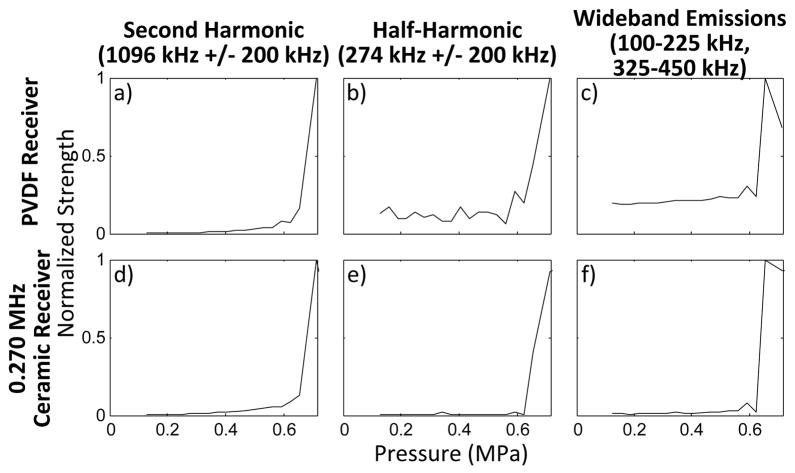
The PVDF receiver was able to detect different types of microbubble emissions at the same time as the 5 cm aperture passive detector (fig. 9). The focused detector, with a center frequency near the transmit subharmonic and harmonics near the transmit ultraharmonic frequencies had stronger sub and ultraharmonic signal components than the PVDF. However, the transmit harmonic frequencies detected by the PVDF receiver were an order of magnitude stronger than those detected by the focused detector.
Fig. 9.
Area under the FFT curve from the PVDF receiver with increasing pressure for a)the second harmonic 1096kHz ± 200 Hz, b) the half-harmonic 274 kHz ± 200 Hz, c) wideband emissions(100–225 kHz and 325–450 kHz); Area under the FFT curve from the ceramic receiver with increasing pressure for a)the second harmonic 1096kHz ± 200 Hz, b) the half-harmonic 274 kHz ± 200 Hz, c) wideband emissions(100–225 kHz and 325–450 kHz);
The measured directivity of the receiver was a close match to the calculated theoretical values for the first and third harmonics of the transmit element (fig. 10). At a distance of 15 cm, the fundamental frequency can be detected to approximately ± 7 cm from the acoustic axis (3 dB point). However, this range decreases to approximately ± 2.6 cm at 830 kHz.
Fig. 10.
Measured and theoretical directivity of the receiver at 306 kHz (top) and 830 kHz (bottom). Calculated theoretical values are shown with a dashed line.
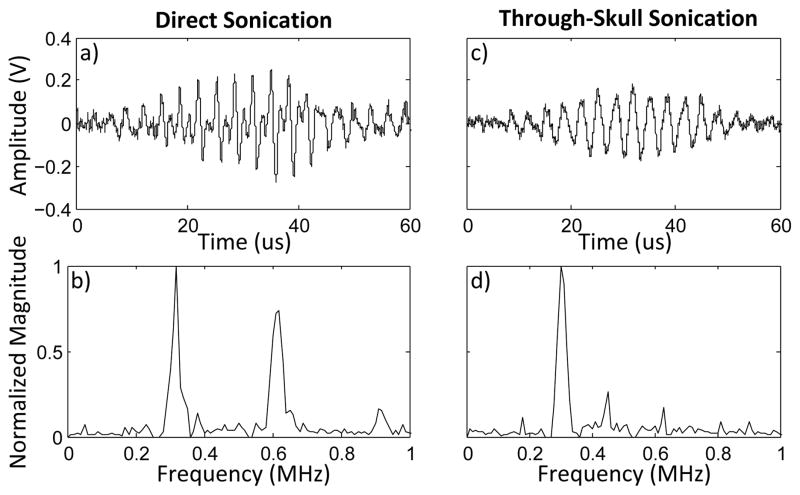
When directly sonicating the thin-walled tubing, a peak pressure of approximately 46 kPa was measured using the needle hydrophone. The reflected waveforms for both the 25:1 and 100:1 solutions of Definity showed an increase in signal amplitude over the reference sonication, and the presence of harmonic components indicated the detection of the microbubbles(fig. 11).
Fig. 11.
Waveform (a) and frequency spectrum (b) for direct sonication of a 25:1 solution of Definity contrast agent. Waveform (c) and frequency spectrum (d) for through-skull sonication of a 10:1 solution of Definity contrast agent. The timing shown in figures a) and c) are to show scale, and time t = 0 marks the start of the waveform capture.
After the addition of the skull fragment, the pressure at the tubing decreased to 22 kPa. An increase in received waveform amplitude was seen for Definity concentrations of 10:1 and 25:1 however, harmonic signal components were not detected (fig. 11). The peak received pressures were approximately 1.1 kPa (5%) and 0.6 kPa (2.5%) for the 10:1 and 25:1 solutions respectively. At a concentration of 100:1, no distinct difference from the reference waveform was visible.
After the addition of a second transmit element, a small second harmonic component was detected for a concentration of 25:1.
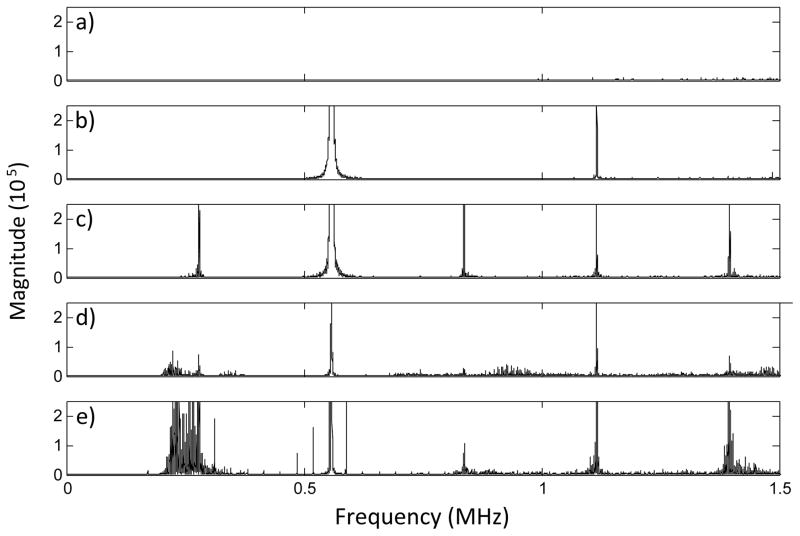
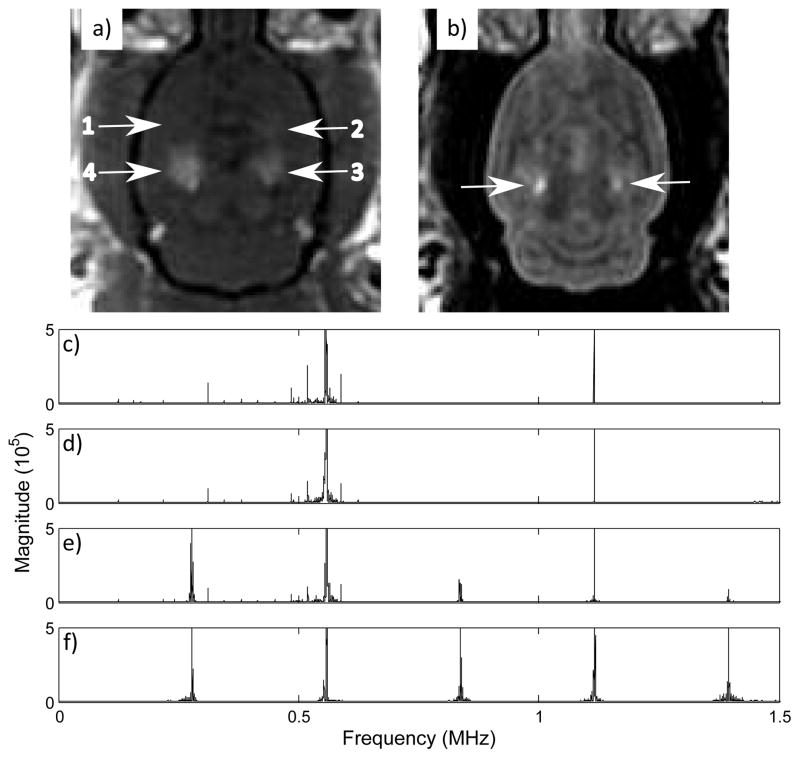
In vivo, opening of the blood-brain barrier was observed for 23 of 26 sonications. Harmonic signal components were detected for all sonications. Sub and ultraharmonics were detected for 12 locations, all of which showed edema in the T2-weighted images. Only one sonication produced edema without the detection of subharmonics. Additionally, no subharmonics or ultraharmonics were detected at locations where edema had not occurred. Inertial cavitation was detected at 5 locations which had been sonicated at high power (4 locations at 0.27 MPa peak negative pressure, 1 location at 0.33 MPa peak negative pressure), all of which experienced notable edema. Fig. 12 shows sample spectra from the in vivo work diplaying the different types of signal components observed: baseline noise, harmonics, sub and ultraharmonics and wideband emissions. Fig. 13 shows T1 and T2 images of a rat brain sonicated in four locations with increasing pressure applied at each location. The ultrasound frequency spectra for the four locations are shown in figs 13e–f. Opening of the BBB at three locations can be seen on the T1-weighted image, of which edema is visible in two locations in the corresponding T2-weighted image. Spurious peaks were seen on the frequency spectra from some sonications. These seem to be an artifact of the MRI and may be dependent on the receiver position within the field.
Fig. 12.
FFTs showing different signal types received a) receive baseline noise level, b) fundamental frequency and second harmonic, c) harmonics and sub/ultra-harmonics, d) harmonics and broadband noise, e) harmonics, sub/ultra-harmonics and broadband noise.
Fig. 13.
a) Contrast enhanced T1-weighted image showing enhancements at sonication locations 2, 3 and 4; b) Corresponding T2-weighted image showing edema at locations 3 and 4; frequency spectra from 0 to 1.7 MHz for c) location 1 (0.15 MPa), d) location 2 (0.18 MPa peak negative pressure), e) location 3 (0.22 MPa peak negative pressure), f) location 4 (0.27 MPa peak negative pressure).
IV. Discussion
The presented receiver shows great potential for use in ultrasound monitoring of transcranial therapy. Positive results were achieved in bench-top work and in vivo, and comparison with a commercial hydrophone demonstrated the performance advantage of the constructed receiver. In addition, the MRI-compatibility and low-cost of the receiver make it suitable for the proposed application in a large-scale, MRI guided array. The manufacturing cost of the PVDF receiver costs was less than 15 CAD in parts. This is a small fraction of the cost of commercial needle hydrophones, and would make construction of a large receiver array more economically feasible than if commercial hydrophones were used.
Due to the nature of therapeutic ultrasound and, more specifically, transcranial therapy, there is a greater interaction between transmit and receive components than in diagnostic ultrasound. The ability to receive while transmitting is necessary to allow for real time monitoring. For transcranial therapy, lower frequencies are also desired as the attenuation and phase aberration through the skull increases greatly with increasing frequency [1]. It should be noted that while low frequencies can give rise to complications, such as standing waves in the skull cavity, their use is a necessary compromise to ensure ultrasound transmission transcranially while minimizing focal distortion. The resulting long outgoing pulses may interact both electrically and acoustically with the receiver, and some degree of interaction between transmit and receive sides may be present when the reflected waveform is detected. If isolation of the device is poor, the reflected waveforms may be indiscernible from the coupling contributions. Gating the therapy pulses to reduce the interference between transmit and receive elements may be possible. However, investigation of the effects of a reduced duty cycle on BBBD would be required to ensure that this did not influence treatment efficacy. The proposed use of the receivers in a hemispherical array would add the additional complication of signals emanating from facing transmit elements in the array and from multiple reflections caused by the skull. In the proposed application, filtering of the fundamental frequency would eliminate these, leaving only the generated harmonics and wideband emissions. While reflections of the microbubble emissions within the skull, as well as harmonics generated by the non-linearities of tissue and water, must still be considered, elimination of the transmit frequency substantially simplifies the signal analysis.
The PVDF receiver was better able to reject electrical coupling with the transmit element than the commercial hydrophone. Although less sensitive than PZT-4 of equivalent size, the broadband response of PVDF is desirable, and comparison with a highly sensitive passive transducer demonstrated that the PVDF receiver is sufficiently sensitive for the proposed application. Its success in transcranially sonicating and detecting microbubbles, both on the bench-top and in vivo, shows promise for use in a large-scale array. The superior sensitivity of the PVDF is also important as, in practice, reflected pressures can be less than 1% of the transmitted signal strength [15]. While the reflected signal strength was low for the bubble excitation experiments, the experiments utilized only a single element and therefore the excitation pressure was low. The absence of harmonic signal components in the single-element through-skull sonications suggests either linear bubble oscillations, in which case the peak pressure at the contrast agent was insufficient to cause nonlinear behavior, or the attenuation of the harmonic components through the skull, as above 600 kHz the attenuation of sound through adult skull bone begins to increase [46]. Nonlinear effects were restored with the addition of a second transmit element, which implies feasibility for use within a multi-element array. The concentrations of contrast agent used in this study were high relative to those used in vivo. Thus, the in vivo experiments served not only to confirm the ability of the receiver to detect realistic microbubble concentrations while transmitting the therapy pulse, but also showed that the sensitivity of the receiver was sufficient to detect differences in the waveforms at different powers and given different biological effects.
One fall-back of the current design is the directivity of the receiver. The transcranial dome presented by Song and Hynynen has an effective beam steering range of ± 50 mm in the lateral direction and ± 30 mm in the depth direction. At 306 kHz, with the large receiver, the entire beam steering range is within −3 dB of the maximum receiver signal strength. However, at 830 kHz, only signals originating ± 26 mm from the geometric focus can be detected without significant signal loss, and at 918 kHz, the approximate 3rd harmonic generated by the microbubbles, this range is even further reduced. The smaller receiver which was successfully constructed without sacrificing signal strength, and which has a PVDF film diameter of 2.4 mm will be able to detect the 3rd harmonic over the whole beam steering range.
Having demonstrated the feasibility of using the PVDF receiver in combination with a therapy array element, and in vivo, future work will focus on expanding to a multi-element array, as well as identifying the control parameters necessary to realize real-time monitoring of therapy.
V. Conclusion
A compact, MRI compatible PVDF receiver for use in combination with a transcranial array element has been presented. The low cost receiver has been demonstrated to be more suitable for the proposed application than a commercial hydrophone, with greater sensitivity and rejection of electrical coupling. The receiver was able to function in combination with a transmit element to sonicate a transcranial target and detect the resulting low pressure microbubble oscillations. Preliminary in vivo work further demonstrated the functionality of the receiver and demonstrated the possibility of correlating ultrasound signals with biological effects of treatment. Future work will focus on developing a multi-element receiver array and its acquisition system, and their testing for brain treatment monitoring.
Acknowledgments
M. A. O’Reilly thanks Samuel Gunaseelan for his technical assistance and support on the electronics, as well as Dr. Yuexi Huang and Ping Wu for their assistance with the in vivo work. She would further like to thank David Biancolin for his assistance in characterizing the preamplifier, and Dr. Junho Song for his general assistance and advice. This work was supported by National Institutes of Health under Grants No. EB003268 and No. EB009032.
References
- 1.Hynynen K, Jolesz FA. Demonstration of Potential Noninvasive Ultrasound Brain Therapy Through an Intact Skull. Ultrasound in Med& Biol. 1998;24(2):275–283. doi: 10.1016/s0301-5629(97)00269-x. [DOI] [PubMed] [Google Scholar]
- 2.Clement GT, Sun J, Giesecke T, Hynynen K. A hemisphere array for non-invasive ultrasound brain therapy and surgery. Phys Med Biol. 2000;45:3707–3719. doi: 10.1088/0031-9155/45/12/314. [DOI] [PubMed] [Google Scholar]
- 3.Hynynen K, Clement GT, McDannold N, Vykhodtseva N, King R, White PJ, Vitek S, Jolesz FA. 500-element ultrasound phased array system for noninvasive focal surgery of the brain: a preliminary rabbit study with ex vivo human skulls. Magn Reson Med. 2004;52(1):100–107. doi: 10.1002/mrm.20118. [DOI] [PubMed] [Google Scholar]
- 4.Pernot M, Aubry J-F, Tanter M, Boch A-L, Marquet F, Kujas M, Seilhean D, Fink M. In vivo transcranial brain surgery with an ultrasonic time reversal mirror. J Neurosurg. 2007;106(6):1061–1066. doi: 10.3171/jns.2007.106.6.1061. [DOI] [PubMed] [Google Scholar]
- 5.Marquet F, Pernot M, Aubry J-F, Montaldo G, Tanter M, Boch A-L, Kujas M, Seilhean D, Fink M. Non-Invasive Transcranial Brain Therapy Guided by CT Scans: and In vivo Monkey Study. 6th International Symposium on Therapeutic Ultrasound; 2007. pp. 554–560. [Google Scholar]
- 6.McDannold N, Clement G, Black P, Jolesz F, Hynynen K. Transcranial Magnetic Resonance Imaging-Guided Focused Ultrasound Surgery of Brain Tumors: Initial Findings in 3 Patients. Neurosurgery. 66(2) doi: 10.1227/01.NEU.0000360379.95800.2F. [DOI] [PMC free article] [PubMed] [Google Scholar]
- 7.Hynynen K, McDannold N, Vykhodtseva N, Jolesz FA. Noninvasive MR Imaging-guided Focal Opening of the Blood Brain Barrier in Rabbits. Radiology. 2001;20(3):640–646. doi: 10.1148/radiol.2202001804. [DOI] [PubMed] [Google Scholar]
- 8.McDannold N, Vykhodtseva N, Hynynen K. Targeted disruption of the blood-brain barrier with focused ultrasound: association with cavitation activity. Phys Med Biol. 2006;51:793–807. doi: 10.1088/0031-9155/51/4/003. [DOI] [PubMed] [Google Scholar]
- 9.Kinoshita M, McDannold N, Jolesz FA, Hynynen K. Targeted delivery of antibodies through the blood-brain barrier by MRI-guided focused ultrasound. Biochemical and Biophysical Research Communications. 2006;340:1085–1090. doi: 10.1016/j.bbrc.2005.12.112. [DOI] [PubMed] [Google Scholar]
- 10.Choi JJ, Pernot M, Small SA, Konofagou EE. Noninvasive, Transcranial and Localized Opening of the Blood-Brain Barrier using Focused Ultrasound in Mice. Ultrasound in Med & Biol. 2007;33(1):95–104. doi: 10.1016/j.ultrasmedbio.2006.07.018. [DOI] [PubMed] [Google Scholar]
- 11.Treat LH, McDannold N, Vykhodtseva N, Zhang Y, Tam K, Hynynen K. Targeted delivery of doxorubicin to the rat brain at therapeutic levels using MRI-guided focused ultrasound. Int J Cancer. 2007;121:901–907. doi: 10.1002/ijc.22732. [DOI] [PubMed] [Google Scholar]
- 12.Bing KF, Howles GP, Qi Y, Palmeri ML, Nightingale KR. Blood-Brain Barrier (BBB) Disruption Using a Diagnostic Ultrasound Scanner and Definity in Mice. Ultrasound in Med & Biol. 2009;35(8):1298–1380. doi: 10.1016/j.ultrasmedbio.2009.03.012. [DOI] [PMC free article] [PubMed] [Google Scholar]
- 13.Clement GT, White PJ, Hynynen K. J Acoust Soc Am. 3. Vol. 115. 2004. Enhanced ultrasound transmission through the human skull using shear mode conversion; pp. 1356–1364. [DOI] [PubMed] [Google Scholar]
- 14.Pichardo S, Hynynen K. Treatment of near-skull brain tissue with a focused device using shear-mode conversion: a numerical study. Phys Med Biol. 2007;52:7313–7332. doi: 10.1088/0031-9155/52/24/008. [DOI] [PubMed] [Google Scholar]
- 15.Tang SC, Clement GT, Hynynen K. A Computer-Controlled Ultrasound Pulser-Receiver Systme for Transskull Fluid Detection using a Shear Wave Transmission Technique. IEEE UFFC. 2007;54(9):1772–1783. doi: 10.1109/tuffc.2007.461. [DOI] [PMC free article] [PubMed] [Google Scholar]
- 16.Song J, Hynynen K. Feasibility of Using Lateral Mode Coupling Method for a Large Scale Ultrasound Phased Array for Noninvasive Transcranial Therapy. IEEE TBME. 2010;57(1):124–133. doi: 10.1109/TBME.2009.2028739. [DOI] [PMC free article] [PubMed] [Google Scholar]
- 17.Roy RA, Mandashetty SI, Apfel RE. An acoustic backscattering technique for the detection of transient cavitation produced by microsecond pulses of ultrasound. J Acoust Soc Am. 1990;87(6):2451–2458. doi: 10.1121/1.399091. [DOI] [PubMed] [Google Scholar]
- 18.Atchley AA, Frizzell LA, Apfel RE, Holland CK, Madanshetty S, Roy RA. Thresholds for cavitation produced in water by pulsed ultrasound. Ultrasonics. 1988;26:280–285. doi: 10.1016/0041-624x(88)90018-2. [DOI] [PubMed] [Google Scholar]
- 19.Madanshetty SI, Roy RA, Apfel RE. Acoustic microcavitation: its active and passive acoustic detection. J Acoust Soc Am. 1991;90(3):1515–1526. doi: 10.1121/1.401891. [DOI] [PubMed] [Google Scholar]
- 20.Farny CH, Holt RG, Roy RA. Monitoring the Development of HIFU-Induced Cavitation Activity. 5th International Symposium on Therapeutic Ultrasound, AIP Conference Proceedings; 2006. p. 829. [Google Scholar]
- 21.Coussios CC, Farny CH, Ter Harr G, Roy RA. Role of acoustic cavitation in the delivery and monitoring of cancer treatment by high-intensity focused ultrasound (HIFU) Int J Hyperthermia. 23(2):105–120. doi: 10.1080/02656730701194131. [DOI] [PubMed] [Google Scholar]
- 22.Datta S, Coussios CC, Ammi AY, Mast TD, de Courten-Myers GM, Holland CK. Ultrasound-Enhanced Thrombolysis Using Definity as a Cavitation Nucleation Agent. Ultrasound Med Biol. 2008;34(9):1421–1433. doi: 10.1016/j.ultrasmedbio.2008.01.016. [DOI] [PMC free article] [PubMed] [Google Scholar]
- 23.Leighton TG, Fedele F, Coleman AJ, McCarthy C, Ryves S, Hurrell AM, De Stefano A, White PR. A Passive Acoustic Device for Real-Time Monitoring of The Efficacy of Shockwave Lithotripsy Treatment. Ultrasound Med Biol. 2008;34(10):1651–1665. doi: 10.1016/j.ultrasmedbio.2008.03.011. [DOI] [PubMed] [Google Scholar]
- 24.Robinson S, Preston R, Smith M, Millar C. PVDF Reference Hydrophone Development in the UK – From Fabrication and Lamination to Use as Secondary Standards. IEEE Transactions on Ultrasonics, Ferroelectrics, and Frequency Control. 2000;47(6):1336–1344. doi: 10.1109/58.883522. [DOI] [PubMed] [Google Scholar]
- 25.Foster FS, Harasiewicz KA, Sherar MD. A History of Medical and Biological Imaging with Polyvinylidene Fluoride (PVDF) Tranducers. IEEE Transactions on Ultrasonics, Ferroelectrics, and Frequency Control. 2000;47(6):1363–1371. doi: 10.1109/58.883525. [DOI] [PubMed] [Google Scholar]
- 26.Sessler GM. Piezoelectricity in polyvinylidenefluoride. J Acoust Soc Am. 1981;70(6):1596–1608. [Google Scholar]
- 27.Lewin P. Miniature piezoelectric polymer ultrasonic hydrophone probes. Ultrasonics. 1981;19(5):1420–1424. [Google Scholar]
- 28.Bacon DR. Characteristics of a PVDF Membrane Hydrophone for Use in the Range 1–100 MHz. IEEE transactions on sonics and ultrasonics. 1982;SU-29(1):18–25. [Google Scholar]
- 29.Platte M. A polyvinyldene fluoride needle hydrophone for ultrasonic applications. Ultrasonics. 1985;23(3):113–118. [Google Scholar]
- 30.Schaefer M, Gessert J, Moore W. Development of a High Intensity Focused Ultrasound (HIFU) Hydrophone System. Proceedings – IEEE Ultrasonics Symposium; 2005. pp. art. No. 1603202pp. 1739–1742. [Google Scholar]
- 31.Zeqiri B, Gélat PN, Hodnett M, Lee ND. A Novel Sensor for Monitoring Acoustic Cavitation. Part I: Concept, Theory, and Prototype Development. IEEE UFFC. 2003;50(10):1342–1350. doi: 10.1109/tuffc.2003.1244751. [DOI] [PubMed] [Google Scholar]
- 32.Norton SJ, Won IJ. Time Exposure Acoustics. IEEE Trans Geosci Rem Sens. 2000;38(3):1337–1343. [Google Scholar]
- 33.Salgaonkar VA, Datta S, Holland CK, Mast DT. Passive cavitation imaging with ultrasound arrays. J Acoust Soc Am. 2009;126(6):3071–3038. doi: 10.1121/1.3238260. [DOI] [PMC free article] [PubMed] [Google Scholar]
- 34.Gyöngy M, Coussios CC. Passive Spatial Mapping of Inertial Cavitation during HIFU Exposure. IEEE TBME. 2010;57(1):48–56. doi: 10.1109/TBME.2009.2026907. [DOI] [PubMed] [Google Scholar]
- 35.O’Reilly MA, Hynynen K. Feasibility of a PVDF Receiver for Monitoring of Transcranial Therapy. 9th International Symposium on Therapeutic Ultrasound, AIP Conference Proceedings; 2009. p. 1215. [Google Scholar]
- 36.Harland AR, Petzing JN, Tyrer JR, Bickley CJ, Robinson SP, Preston RC. Application and assessment of laser Doppler velocimetry for underwater acoustic measurements. J Sound and Vibration. 2003;265:627–645. [Google Scholar]
- 37.Ziomek LJ. Fundamentals of Acoustic Field Theory and Space-Time Signal Processing. Boca Raton, Florida: CRC Press; 1995. p. 478. [Google Scholar]
- 38.Crocco M, Palmese M, Sciallero C, Trucco A. A comparative analysis of multi-pulse techniques in contrast-enhanced ultrasound medical imaging. Ultrasonics. 2009;49:120–125. doi: 10.1016/j.ultras.2008.05.008. [DOI] [PubMed] [Google Scholar]
- 39.Chopra R, Curiel L, Staruch R, Morrison L, Hynynen K. An MRI-compatible system for focused ultrasound experiments in small animal models. Med Phys. 2009;36(5):1867–1874. doi: 10.1118/1.3115680. [DOI] [PMC free article] [PubMed] [Google Scholar]
- 40.Hynynen K. Ultrasound Heating Technology. In: Seegenschmiedt MH, Fessenden P, Vernon CC, editors. Thermo-Radiotherapy and Thermo-Chemotherapy, vol. 1, Biology, Physiology, and Physics. New York: Springer-Verlag; 1995. pp. 255–256. [Google Scholar]
- 41.Hynynen K. Acoustic power calibrations of cylindrical intracavitary ultrasound hyperthermia applicators. Med Phys. 1993;20(1):129–134. doi: 10.1118/1.597094. [DOI] [PubMed] [Google Scholar]
- 42.Neppiras EA. Acoustic Cavitation. Physics Reports. 1980;61(3):159–251. [Google Scholar]
- 43.Leighton TG. The Acoustic Bubble. New York: Academic Press; 1994. pp. 413–416. [Google Scholar]
- 44.Fay B, Ludwig G, Lankjaer C, Lewin PA. Frequency Response of PVDF Needle-Tytpe Hydrophones. Ultrasound in Med & Biol. 1994;20(4):361–366. doi: 10.1016/0301-5629(94)90004-3. [DOI] [PubMed] [Google Scholar]
- 45.Lewin PA, Lypacewicz G, Bautista R, Devaraju V. Sensitivity of ultrasonic hydrophone probes below 1 MHz. Ultrasonics. 2000;38:135–139. doi: 10.1016/s0041-624x(00)00002-0. [DOI] [PubMed] [Google Scholar]
- 46.Fry FJ, Barger JE. Acoustical properties of the human skull. J Acoust Soc Am. 1978;63(5):1576–1590. doi: 10.1121/1.381852. [DOI] [PubMed] [Google Scholar]


