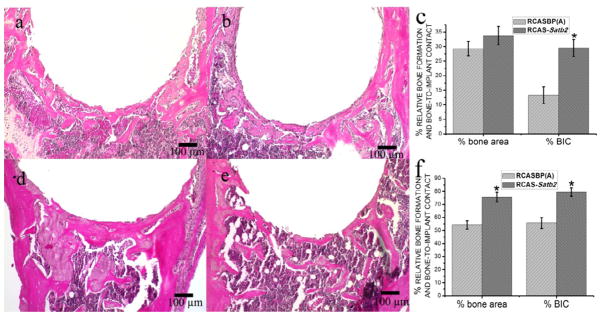
Figure 2. Histomorphometric analysis of RCASBP(A) group and RCAS-Satb2 group.
The photomicrograph of H&E stained tissue sections of RCAS-Satb2 group (a) and RCAS group (b) 1 week after the implantation showed similar results in the pBABE-hygro and pBABE-Satb2 group. Overexpression of Satb2 via infection with RCAS-Satb2 resulted in a 2-fold increase in the percentage of bone-to-implant contact when compared with the RCAS group (c).
The representative slides of the H&E staining results of RCAS-Satb2 group (d) and RCAS group (e) showed similar results as in Figure 1d and 1e. The percentage of bone formation surrounding the implant and the percentage of bone-in-contact with host bone were determined at day 7 and 21 post operation (f). Data were expressed as mean±SEM (n=6–8). *p<0.05, RCAS vs. RCAS-Satb2.

