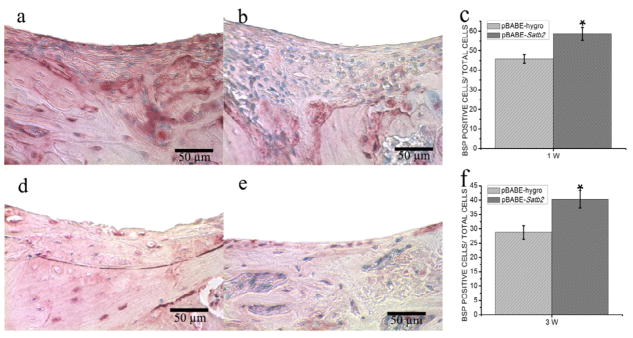
Figure 3. Immunohistochemical analysis of pBABE-Satb2 group and pBABE-hygro group.
(a–b) Immunohistochemical staining for BSP showed that there were more intense BSP signals in the pBABE-Satb2 group (a) than that in pBABE-hygro group (b) 1 week after implantation. (c) BSP positive cell counting analysis indicated increased BSP-positive cells in pBABE-Satb2 group than that in pBABE-hygro group. (d–e) Representative pictures of (d) pBABE-Satb2 group and (e) pBABE-hygro group 3 weeks after operation. (f) Cell counting demonstrated that there were more BSP-positive cells in pBABE-Satb2 group than that in pBABE-hygro group. Data were expressed as mean±SEM (n=6–8). *p<0.05, pBABE-hygro vs. pBABE-Satb2.

