

Abstract
When exploring a visual scene, some objects perceptually popout because of a difference of color, shape, or size. This bottom-up information is an important part of many models describing the allocation of visual attention. It has been hypothesized that the lateral intraparietal area (LIP) acts as a “priority map,” integrating bottom-up and top-down information to guide the allocation of attention. Despite a large literature describing top-down influences in LIP, the presence of a pure salience response to a salient stimulus defined by its static features alone has not been reported. We compared LIP responses with colored salient stimuli and distractors in a passive fixation task. Many LIP neurons responded preferentially to 1 of the 2 colored stimuli, yet the mean responses to the salient stimuli were significantly higher than to distractors, independent of the features of the stimuli. These enhanced responses were significant within 75 ms, and the mean responses to salient and distractor stimuli were tightly correlated, suggesting a simple gain control. We propose that a pure salience signal rapidly appears in LIP by collating salience signals from earlier visual areas. This contributes to the creation of a priority map, which is used to guide attention and saccades.
Keywords: attention, electrophysiology, lateral intraparietal area, popout, vision
Introduction
A quick look at a photo of a world cup football team is all that is needed to identify the goalkeeper. Why? Not because he is taller or stronger but because his jersey is a different color from his teammates. The fact that the color differs substantially from the other surrounding stimuli makes it popout perceptually, and psychophysical studies have shown that when a visual stimulus differs noticeably from the background in terms of a physical attribute, such as color, shape, or size, subjects can rapidly extract information about them (Treisman and Gelade 1980; Wolfe 1994b; Egeth and Yantis 1997). This contrast is typically referred to as salience. Accordingly, the rapid extraction of salient stimuli from a uniform background, sometimes described as a preattentive or parallel process, is an important part of many models of visual attention (Treisman and Sato 1990; Wolfe 1994a; Itti and Koch 2001). We will focus on one of these models, in which bottom-up inputs combine with top-down information to establish a map that contains a spatial representation of the visual world, which guides the allocation of attention (Koch and Ullman 1985; Itti and Koch 2001). In this model, the neural activity is related to the attentional priority of the stimulus, and the focus of attention is allocated to the object or location that induces the greatest activity. As such, to identify where attention is to be allocated, one must compare responses across the map (Bisley and Goldberg 2003). We will refer to such a map as a priority map rather than a saliency map to highlight the fact that it is not just bottom-up (i.e., salient) information that shapes the map, thus removing any confusion about the term salience (Fecteau and Munoz 2006; Serences and Yantis 2006; Bisley and Goldberg 2010).
There is a growing literature suggesting that the priority map model is a good model of the neuronal mechanism used by primates to allocate their attention. Although several studies have suggested that such a map may lie in one or a number of visual areas, such as V1 or V4 (Li 2002; Mazer and Gallant 2003), others studies show some evidence that such a map is represented through the fronto-parietal network in lateral intraparietal area (LIP), frontal eye field (FEF), and superior colliculus (SC) (Gottlieb et al. 1998; Fecteau et al. 2004; Thompson et al. 2005). As such, we would expect that salient stimuli should be represented by elevated activity soon after their appearance in an area that acts as a priority map. Neurons in these areas have been shown to be selective to salient stimuli defined by content when animals have to make a saccade toward the salient stimulus (Thompson et al. 1996; McPeek and Keller 2002; Buschman and Miller 2007; Thomas and Pare 2007). However, the fact that the salient stimuli were behaviorally relevant, and the goal of the upcoming saccade suggest that the elevated responses may be due to top-down mechanisms rather than pure salience. A standard way to avoid this confound is to examine the responses of salient stimuli in a passive fixation task. Under such conditions, neurons in area 7A have enhanced responses to salient stimuli (Constantinidis and Steinmetz 2005); however, the difference does not appear early enough to explain a rapid selection of salient stimulus in order to make quick eye movements toward it (Thomas and Pare 2007). In this study, we asked whether activity in parietal area LIP highlights salient stimuli defined purely by static bottom-up factors.
Materials and Methods
Subjects
Data were collected from 2 male adult macaque monkeys (monkeys D and E, Macaca mulatta), weighting 10–11 kg. Surgical procedures have been described previously (Bisley and Goldberg 2006). Briefly, head posts, scleral search coils, and recording cylinders were surgically implanted under general anesthesia. Animals were initially anesthetized with ketamine and dexdomitor and were maintained with isoflurane. Surgery was conducted using aseptic techniques, and analgesics were provided during postoperative recovery. All experiments were approved by the Chancellor’s Animal Research Committee at UCLA as complying with the guidelines established in the Public Health Service Guide for the Care and Use of Laboratory Animals.
Behavioral Task
The animals were seated in a primate chair (Crist instruments) with their heads fixed and placed in front of a computer monitor (Samsung SyncMaster 1100DF CRT running at 100 Hz) 57 cm away in a dimly lit room. The temporal precision of stimulus onset was set by the output of the video card driving the CRT—this was confirmed by the use of a photoprobe. Eye position was monitored using scleral coils (Riverbend Instruments). Stimulus presentation and data acquisition were controlled using VEX and REX (Hays et al. 1982). Monkeys started the trial by fixating a central spot within a 2 degree square window after which 1 or 6 colored discs were presented on the screen for 750 ms. The 6 objects were equally spaced around an imaginary circle centered on the fixation point and were arranged such that one of the stimuli was centered in the middle of the receptive field (RF). The animals had to keep fixation to receive a reward (a few drops of apple juice). The interval between successive trials was 1.5–2 s. We used this passive fixation task to minimize the top-down influences that have been present in previous studies examining popout responses in LIP (Buschman and Miller 2007; Thomas and Pare 2007). We defined a salient stimulus as a disc of one color among 5 discs of another color. We term the remaining nonsalient stimuli as distractors, even though none of the stimuli were behaviorally relevant, so that the results can be directly compared with the similarly titled stimuli in previous studies. The discs were either green or red circles with diameters of approximately one sixth of the RF diameter (ranging from 1.5 to 3 degree depending on the eccentricity of the RF). We tried to optimize the color difference in the task by defining the color discs with the greatest luminances possible using our monitor (78 and 20 cd/m2 for green and red, respectively). We used 5 equally likely conditions that were randomly interleaved within a session and done for each color combination. In the first 2 conditions, a stimulus of one color was surrounded by 5 stimuli of the other color. This salient stimulus could either appear at the center of the RF (the salient condition) or in the location opposite to the center of the RF (the distractor condition). In this latter case, a nonsalient stimulus (a distractor) was presented in the center of the RF, diametrically opposite the salient stimulus. In the third condition, all 6 stimuli were of the same color (the field condition). In the fourth and fifth conditions, only a single stimulus was presented on the screen. It was presented either in the center of the RF (the singleton condition) or in the opposite location (the blank condition). In this latter case, there was nothing presented in the RF. The stimuli had no behavioral significance for the monkeys; the task only required fixation. Both animals had been previously trained on a foraging task, which did not utilize circular or colored stimuli and in which items were not presented in a circular array (Mirpour et al. 2009).
Recording
Single-cell activity was recorded using glass-coated tungsten electrodes with impedances of 0.8–1.2 MΩ (Alpha Omega). Their position was controlled with a stepping motor microdrive (NAN). For monkey D, the electrical signal was amplified, filtered, and single-unit activity was recorded online using the Plexon system spike sorting software. Spikes were reexamined off-line to confirm that recordings were of single, well-isolated neurons. For monkey E, online sorting was performed with the MEX pattern spike sorter. Neurons were considered to be in LIP according to their location in the intraparietal sulcus (based on magnetic resonance imaging scans), and their responses to the memory guided delayed saccade (MGS) task. LIP neurons are known to have a visual burst, a delayed sustained activity and a perisaccadic burst in this task (Barash et al. 1991), as opposed to most neurons in neighboring areas within the intraparietal sulcus, which rarely have perisaccadic bursts or robust delay activity. Given that our aim was to examine the visual response to salient stimuli, neurons had to have at least a visual burst in the MGS task, in addition to delay or perisaccadic activity, to be included in this study. After isolating a spike, we first mapped the position and the size of the RF by hand and then with an automated MGS task with 9 or 25 different target positions across a 3 × 3 or 5 × 5 grid extending over the edge of the hand-mapped RF (for details, see Mirpour et al. 2010). Finally, the animals performed a MGS with 6 target locations: one corresponding to the center of the RF and the other 5 dispersed evenly on an imaginary circle around the fixation point. These 6 locations were then used to place the stimuli in the main task. The average eccentricity of the stimuli was 8.8 degree with a range of 5.1 to 13.3 degree (n = 42). We recorded an average of 20–30 trials per condition.
Data Analysis
The visual response was computed as the mean firing rate over a period of 350 ms starting 50 ms after stimulus onset. The visual response was considered significant if it was higher than the activity during a 100-ms period before the stimulus onset when tested with a t-test.
To assess neuronal selectivity to different stimulus context (salient or distractor) and content (red or green stimulus), we computed a two-way nonrepeated factorial analysis of variance (ANOVA) with context and content as independent factors. The threshold of significance was fixed at P < 0.05. We used the F statistics from the ANOVA as a measure of the signal-to-noise ratio. In order to quantify the magnitude of the selectivity for context and content, we computed 2 standard modulation indices. For each neuron, we defined the salience selectivity index (SSI) as [Rsalient – Rdistractor]/[Rsalient + Rdistractor], where Rsalient and Rdistractor are the mean responses to the salient and the distractor conditions respectively, averaged across the 2 colored stimuli. The content selectivity index (CSI) was defined similarly as [Rred – Rgreen]/[Rred + Rgreen], where Rred is the mean response to the red stimulus and Rgreen to the green stimulus, averaged for both salient and distractor stimuli. A value of 0 indicates an absence of modulation by the factor (context or content), whereas a value of 1 indicates a strong selectivity for the salient or red stimulus and a value of –1 indicates a strong selectivity for the distractor or green stimulus.
To compute the time when the response to the salient condition started to be significantly different from the response to the distractor condition, we used 2 different methods. First, we computed a series of paired t-tests, in which we compared the mean raw activity from the population of neurons in 50-ms sliding windows, with 10-ms steps. This is based on the method of Burrows and Moore (2009), although we defined our discrimination time as the time halfway through the first bin of 10 bins, all of which had to have uncorrected P values of 0.05 or less. Because the output of this method is restricted to values quantized by 10 ms, we used a second method in which running t-tests were performed on normalized spike density functions (using a sigma of 10 ms and normalizing by the mean response in the green salient condition) to better estimate when the salient activity differs significantly from the distractor activity. In this method, we compared the normalized response at each millisecond after the stimulus presentation. The discrimination time was defined as the first bin of 50 in which the uncorrected P value was continuously less than 0.05 and in which the uncorrected P value dropped below 0.001 for at least 1 bin.
Results
We recorded the activity from 42 visually responsive LIP neurons from 2 monkeys (28 in monkey D and 14 in monkey E). Data from the 2 animals were qualitatively similar and have been pooled for simplicity; because of the consistency of the results, all significant effects described in the pooled data were also significant for the individual animals at the level of P < 0.02. We examined the responses of LIP neurons to task irrelevant colored stimuli—either red or brighter green discs. We used 5 different stimulus conditions: the salient condition, in which 6 stimuli were presented in a circular array, with a disc of one color (the salient stimulus) inside the RF and 5 discs of the other color completing the array; the distractor condition, in which the salient stimulus was presented in the location opposite the center of the RF, so that 1 of the 5 distractors was inside the RF; the field condition, in which all 6 stimuli had the same color; the singleton condition, in which only a single stimulus was presented on the screen and it was inside the RF; and the blank condition, in which only a single stimulus was presented on the screen and it was placed in the location opposite the RF. All 42 neurons were tested with the first 3 conditions, and 40/42 neurons were tested in the singleton and blank conditions.
All the cells showed a mean firing rate that increased significantly during stimulus presentation in the RF (t-test, P < 0.001) and the vast majority of cells (39/40) did not show a significant increase in firing rate in the blank condition (t-test; P > 0.05). The neuron that did respond in the blank condition did so with a trivially small response (a mean increase of 3.7 sp/s) compared with its response when a stimulus appeared within its RF (a mean increase of 29.2 sp/s). Since our P value was set to 0.05, we considered this to be due to chance and have included the neuron in our analyses. Figure 1 shows the responses of one example LIP neuron to 6 different arrays of stimuli. Consistent with previous studies (Balan et al. 2008; Churchland et al. 2008), the neuron responded most vigorously when a singleton stimulus was placed in the RF (Fig. 1A,B) and had considerably weaker responses when more stimuli were placed in the visual field (Fig. 1C–F). Of more relevance to this study, the neuron showed a strong modulation due to stimulus context; its responses were higher when a salient stimulus was in the RF (Fig. 1C,D) compared with when a distractor was in the RF (Fig. 1E,F).
Figure 1.

Responses of an example LIP neuron. Each panel shows the spike density function and raster plots of spike times aligned on stimulus presentation for different configurations of stimuli; singleton condition (A and B), salient condition (C and D), and distractor condition (E and F). Gray rectangles represent the time of stimulus presentation, and all the trials are aligned to the onset of the stimuli. The array configurations are represented in the upper right region of each panel. Dotted circle symbolizes the RF of the neuron.
It is important to remember that on a single trial, the brain does not compare the response of a single object under different contexts (i.e., a red salient stimulus compared with a red distractor) rather it compares the population response to the salient stimulus with the population responses to the distractors presented at the same time, even though they are of different colors. To best approximate this, we plotted the mean firing rate over a period of 350 ms starting 50 ms after stimulus onset for all the neurons (n = 42) under 2 conditions. In the first condition, the responses when the red salient stimulus was in the RF are plotted as a function of the responses when a green distractor was in the RF (Fig. 2A). In the other condition, the responses when the green salient stimulus was in the RF are plotted as a function of the responses when a red distractor was in the RF (Fig. 2B). Under both conditions, the population responses were significantly stronger for the salient stimulus than for the distractor stimulus (P < 0.001, Wilcoxon signed-rank tests, for means, see Table 1). This suggests that a population of LIP neurons responds more to a salient stimulus than to a distractor, independent of the colors involved. To confirm this, we plotted the responses to the red salient stimulus against the responses to the red distractor (Fig. 2C) and the responses to the green salient stimulus against the responses to the green distractor (Fig. 2D). In these cases, the population responses were still significantly stronger for the salient stimulus than for the distractor stimulus (P < 0.001, Wilcoxon signed-rank tests), suggesting that the enhanced response to the salient stimulus is color independent. To show that most of the neurons respond more to the salient stimulus than to the distractor for both colors, we plotted the difference of the mean response to the red salient stimulus and the red distractor as a function of the difference of the mean response to the green salient stimulus and the green distractor for each neuron (Fig. 2E). A majority of cells show higher responses to the salient stimulus independent of its color (71%, n = 30, top right quadrant), suggesting that any potential color selectivity does not strongly influence the response to a salient stimulus. Furthermore, all the neurons that do not lie in that quadrant tend to lie close to it. Together, these results suggest that the context of the stimulus is independent of the content (i.e., the color). Indeed, the population responses are essentially the same for the red salient stimuli and for the green salient stimuli (Fig. 3A). Not only are the means of 59.5 (±5.7) sp/s and 59.2 (±5.4) sp/s not significantly different (P = 0.352, Wilcoxon signed-rank test), but the linear regression has a slope of 0.99 (±0.08) with an intercept shift of 0.24 (±5.75) sp/s. The same results are found when comparing the responses with the red and green distractors (Fig. 3B), to red and green fields and to red and green singletons (P > 0.05, Wilcoxon signed-rank tests, data not shown for fields and singletons). Such a stimulus-independent response is necessary for salient stimuli to be highlighted within a single population making up a priority map.
Figure 2.

Responses to salient stimuli compared with distractors. (A) Mean responses of the 42 LIP neurons when the red salient stimulus is present in the RF are plotted against the mean responses to green distractors in RF. (B) Mean responses to green salient stimuli in the RF are plotted against the mean responses to red distractors in the RF. (C) Mean responses to the red salient stimuli in the RF are plotted against the mean responses to red distractors in the RF. (D) Mean responses to green salient stimuli in the RF are plotted against the mean responses to green distractors in the RF. (E) Differences of mean responses to red salient stimuli and red distractors in the RF are plotted as a function of the differences of the mean responses to green salient stimuli and green distractors in the RF. Activity was calculated as the average firing rate from a 350-ms period starting 50 ms after stimulus onset. In A–D, dotted lines represent unity lines.
Table 1.
Mean responses (±SEM) in sp/s for all stimuli
| Salient stimulus | Distractor | Field | Singleton | |
| Red | 59.2 ± 5.4 | 53.7 ± 5.4 | 54.5 ± 5.4 | 69.1 ± 6.5 |
| Green | 59.5 ± 5.7 | 52.1 ± 5.1 | 51.8 ± 5.1 | 66.1 ± 7.0 |
Figure 3.

Responses to red stimuli compared with green. (A) Mean responses to red salient stimuli in the RF are plotted against the mean responses to green salient stimuli in the RF. A linear regression of the data showed an intercept of 0.24 (±5.75) sp/s and a slope of 0.99 (±0.08). (B) Mean responses to red distractors in the RF are plotted against the mean responses to green distractors in the RF. A linear regression of these data showed that the intercept was very close to 0 (−0.004 ± 4.92 sp/s), and the slope was essentially 1 (1.03 ± 0.08). Dotted lines represent unity lines, solid lines show lines of best fit using linear regression.
When the data from the 2 colors are pooled, the salience enhancement becomes even more uniform in the population response. Figure 4 compares the mean responses of the population with stimuli in different contexts, independent of stimulus color. As expected based on the color-dependent analysis, the population response was significantly greater to the salient stimulus than to the distractor (Fig. 4A, P << 0.0001, Wilcoxon signed-rank test). Interestingly, there was a very strong correlation between the salient stimulus and distractor responses (R2 = 0.982, linear regression). A linear regression of the data showed an intercept of 1.34 (±2.95) sp/s and a slope of 1.09 (±0.05). Because the fairly consistent increase in response was due to the slope rather than a change in intercept, we suggest that the difference in response may be set by a simple gain control. However, this strong correlation may be driven by the general responsiveness of the neurons rather than a tight relationship between the responses to the salient stimulus and distractor. Thus, as a control, we normalized the activity of the neurons by the mean response in the singleton condition and examined whether the normalized responses to the salient stimulus and distractor were still tightly correlated (Fig. 4B). The normalized activity clearly shows a strong correlation (R2 = 0.930), with a significant shift in intercept (0.10 ± 0.07) and a slope that is similar to 1 (0.99 ± 0.09). Because the data are multiplicatively normalized, a simple shift in intercept confirms that a multiplicative gain control drives the difference in response. Thus, the response to a salient stimulus is, on average, 10% greater than the response to the distractor.
Figure 4.

Mean responses to different stimulus contexts. (A) Mean responses of the 42 LIP neurons to salient stimuli compared with the mean responses to distractors. (B) Mean normalized responses of the 40 LIP neurons that were recorded in the singleton condition to salient stimuli compared with the mean normalized responses to distractors. (C) Mean responses in the field condition are plotted against mean responses to distractors. (D) Mean responses to salient stimuli are plotted against the mean responses to the singleton stimuli. Activity was calculated as the average firing rate from a 350-ms period starting 50 ms after stimulus onset. Dotted lines represent unity lines, solid lines show lines of best fit using linear regression.
The population response to distractors was almost identical to the population response to the same stimuli in the field condition (Fig. 4C; R2 = 0.992). A linear regression of these data showed that the intercept was very close to 0 (0.16 ± 1.77 sp/s), and the slope was essentially 1 (1.00 ± 0.03). This similarity indicates that the presence of a salient stimulus placed at the opposite location of the RF does not affect the neuronal response to a nonsalient stimulus in the RF.
Although the population response to a salient stimulus was greatest among all the stimulus contexts with 6 stimuli, it was significantly weaker than the population response when only one stimulus (the singleton stimulus) was flashed on the screen inside the RF (Fig. 4D, P << 0.0001, Wilcoxon signed-rank test). The relationship between the responses to salient stimuli and singletons was noisier (R2 = 0.918) than the relationships between any of the configurations with 6 stimuli. This suggests that the gain mechanism that modulates the responses depending on context when there are 6 objects present may not drive the main difference in response when different numbers of stimuli are compared.
For a salience response in LIP to be behaviorally relevant with respect to preattentive processing, the enhanced salience activity must occur early in the response. To estimate the time at which the population response differentiates between the salient stimulus and the distractors, we used a population discrimination analysis. Figure 5 shows the mean normalized response for the population of neurons (n = 42) to the salient stimuli and the distractor stimuli. To calculate the time at which the salient stimulus and distractor responses became significantly different, we performed paired t-tests on the pooled raw data using 50-ms sliding windows with 10-ms steps and used the midpoint of the first bin of at least 10 bins in which P < 0.05 as the discrimination time. Using this analysis, the significant difference appeared 75 ms after stimulus presentation and approximately 35 ms after the onset of the visual response. Because this method gives quantized split times, we used a second method that compared the responses in the spike density functions every millisecond (running t-test, see Materials and Methods). Using this test, we found that the discrimination time occurred 71 ms after the stimulus presentation. In fact, using both methods, the difference in activity between the salient stimulus and distractor occurs at essentially the same time that the initial visual burst ends.
Figure 5.

Time of discrimination. Mean normalized population spike density functions when a salient stimulus (red curve) or distractor (blue curve) was presented in the RF. Gray rectangle represents the time of stimulus presentation. Black horizontal lines indicate when the separation is significant (P < 0.05, paired t-tests on 50-ms overlapping bins, with 10-ms steps).
In addition to representing the context of the stimulus, many LIP neurons responded preferentially to one color or the other. In the previous analysis, we compared the population responses with salient and distractor stimuli by pooling together the responses for both colors (green and red); however, this ignored the possibility that some LIP neurons could be selective to the stimulus color. To address this, we tested single LIP neurons for salience selectivity and color selectivity separately. However, because our 2 colored stimuli were not luminance matched, we will refer to the latter as content selectivity. We computed a two-way ANOVA, with stimulus context (salient or distractor) and stimulus content (green or red stimulus) as independent factors, to compare the mean responses of single neurons among the different conditions using the activity from the same 350-ms epoch starting 50 ms after stimulus onset. The results of the ANOVA are summarized in Figure 6A, which plots the F statistics for the independent factors (context and content) against each other for each cell. Among the 42 cells, 48% (20/42) were significantly modulated by the context of stimuli (red and orange points in Fig. 6A) and 45% (19/42) were significantly modulated by the content (blue and orange points in Fig. 6A). Eleven neurons were significantly modulated by both stimulus context and content (orange points in Fig. 6A). Only 3 cells (7%) showed a significant interaction between context and content, suggesting that the context and content of the stimuli are generally treated independently. The remaining 14 neurons were not significantly modulated by either content or context (open points in Fig. 6A); however, 12 of these had stronger responses to the salient stimuli than to the distractor stimuli (Fig. 6B).
Figure 6.
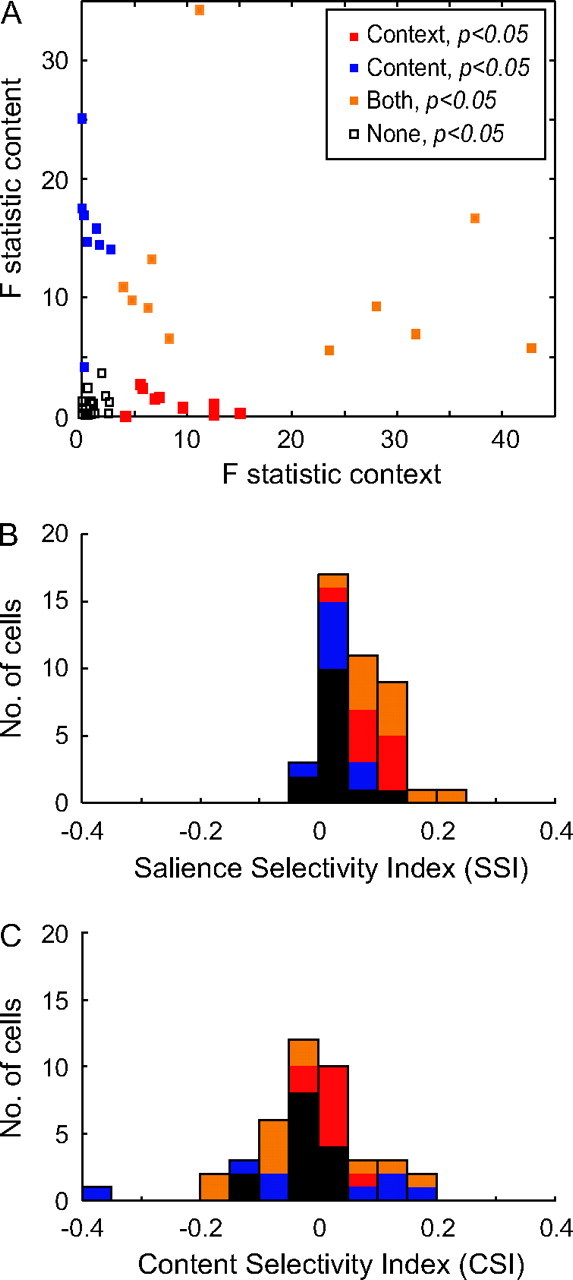
ANOVA and selectivity indices. (A) F statistics from ANOVA for main factor content are plotted against F statistics from ANOVA for context. Each dot represents the F statistic of one LIP neuron. Colors indicate whether the effects were significant. (B) Distribution histogram of the SSI computed on the neural population (n = 42). Colors as in A. (C) Distribution histogram of the CSI. Colors as in A.
To quantify the selectivity to context and content, we computed 2 indices, the SSI, and the CSI. Figure 6B,C shows distribution histograms of the values from the 2 indices computed within the population (n = 42). The columns are color coded in the same format as in Figure 6A to indicate which neurons showed significant selectivity from the ANOVA. We did not compute an SSI for each color because we have already shown that the color selectivity does not influence the salience responses (see Fig. 2C–E). The distribution of SSIs had a mean value of 0.067, which was significantly greater than 0 (P < 0.001, Wilcoxon signed-rank test), indicating that the LIP population shows an average response enhancement of ∼14% for a salient stimulus (Fig. 6B). Although the SSI values were all relatively low, the fact that the vast majority (39/42) of neurons had values that were greater than 0 suggests that LIP neurons consistently, albeit often weakly, encode the presence of a salient stimulus that is task irrelevant. Indeed, it is this consistent bias that explains how the small difference in responses between salient stimuli and distractors reaches significance (Fig. 5). On the contrary, the modulation induced by the content of the stimuli was evenly distributed (Fig. 6C), indicating that some cells responded more to the red stimulus and others responded more to the green stimulus. Consistent with this, the cells that were significantly influenced by the content (blue and orange columns) were also spread across both ends of the spectrum, suggesting that they are equally distributed toward a preference for the red or green stimuli. We interpret these data as suggesting that these neurons actually have a preference for the color of the stimuli; they were not luminance matched, yet these neurons could respond preferentially to either stimulus. Indeed, the mean CSI values for the 2 classes of neurons that were selective for content were −0.013 and −0.035 for the blue and orange populations, respectively. The fact that neither of these was significantly different from zero (P > 0.37, Wilcoxon signed-rank tests), suggests that any bias for content seen in a single neuron is canceled out by the opposite preference in another neuron within the population. Practically, this means that a neuron that is selective to both color and context could have a stronger response to a distractor in the neuron’s preferred color than to a salient stimulus of the nonpreferred color. However, when pooled in the population, it would be balanced out by a neuron within the same class of context selectivity but with an opposite color preference. This will always balance out to generate higher responses to salient stimuli because almost all neurons had positive SSI values.
Discussion
Our results show that neurons in LIP generally respond more to salient stimuli compared with distractors, even when the context of the stimulus is irrelevant to the animal’s behavior. This enhanced activity appears early in the population response and is independent of the stimulus features. Together, these results suggest that a pure salience signal appears rapidly in LIP activity. Finally, we report that many LIP neurons appear to contain some color selectivity, which often rides on top of the salience modulation.
Many previous studies have shown that LIP neurons respond to salient stimuli with elevated activity, but none have shown this for pure salient stimuli defined by static stimulus features alone. The most common salient stimuli shown to induce responses in LIP are changes in the visual scene, such as sudden onsets (Bushnell et al. 1981; Gottlieb et al. 1998; Bisley and Goldberg 2003; Balan and Gottlieb 2006), moving stimuli (Kusunoki et al. 2000; Balan and Gottlieb 2006), or changes in stimulus configuration (Balan and Gottlieb 2006; Oristaglio et al. 2006). Indeed, our most responsive result came from our most salient condition, in which only a single stimulus was flashed on the screen and in the RF. However, these sorts of stimuli induce response changes throughout the visual system, so the response in LIP is not unique. A small number of studies have examined the responses of LIP neurons to salient stimuli defined by their stimulus properties alone (Buschman and Miller 2007; Thomas and Pare 2007); however, in these studies, the animals had to use the stimulus context to shape their behavioral response, which was a saccade to the salient stimulus. Thus, the salient stimuli were not only task relevant but also became the goal of the upcoming saccade. Both of these contexts are known to produce elevated activity in LIP, even with stimuli that are not salient (Gnadt and Andersen 1988; Colby and Duhamel 1996; Ipata et al. 2006). We have attempted to remove both of these top-down factors from our experiment, by using animals that have never seen colored or circular stimuli in the laboratory before and by having them fixate the central point as the only way of correctly performing the task to gain a reward.
Based on the strength, consistency and timing of our salience response, we feel that our results are not biased by top-down factors. The responses we measured were noticeably weaker than those shown in previous studies (Buschman and Miller 2007; Thomas and Pare 2007), suggesting that adding a top-down bias by making the stimulus behaviorally relevant elevates responses in LIP even more. This is, in fact, evidence that our animals are not using the stimulus in some sort of top-down way and is consistent with the idea that this signal is just a raw salience signal. We also noticed a tight relationship between the response to a salient stimulus and to the same stimulus when it was a distractor (Fig. 4A,B). Previous studies that have explicitly plotted the response to a salient stimulus under conditions in which it is the goal of a saccade, and thus contained top-down modulation, show a far greater variance in responses under the 2 conditions even at the single neuron level (e.g., see Fig. 2A in Thomas and Pare 2007). The tight relationship we see is smaller than, but reminiscent of, the multiplicative gain seen in LIP under different top-down contexts during a task in which a transient exogenous stimulus occurred in a behaviorally relevant or irrelevant location (Balan and Gottlieb 2006). Finally, we would note that there is no evidence that the emergence of a popout response in FEF (Thompson et al. 1996) occurs earlier than in LIP (Thomas and Pare 2007), suggesting that the modulation we see in LIP is unlikely to come from a top-down signal from FEF. Thus, with the caveat that one can never know what the animal is actually thinking about, we feel confident that we are showing a raw salience signal by minimizing top-down factors.
Several other studies have examined the responses to task irrelevant salient stimuli in earlier visual areas V1 and V4 (Knierim and van Essen 1992; Hegde and Felleman 2003; Burrows and Moore 2009). These studies have reported that some V1 cells are selective to oriented popout stimuli compared with homogeneous stimuli (Knierim and van Essen 1992; Zipser et al. 1996). A small proportion of these cells (6%, 8/122) even responded to popout stimuli independently of the orientation of the salient stimulus (Knierim and van Essen 1992). However, these experiments only used small oriented bars, so it is unclear whether this effect would be seen with the stimuli used in our task or more realistic objects found in visual scenes. Furthermore, V1 cells as a population have not been found to distinguish between popout and conjunction stimuli (Hegde and Felleman 2003), indicating that most V1 cells are selective to the presence of feature discontinuities and that center-surround mechanisms do not provide an explicit representation of popout in V1. Single LIP neurons, however, do not have traditional center-surround RFs (Falkner et al. 2010) and the uniform responses to nonsalient stimuli, whether a salient stimulus is present (the distractor condition) or not (the field condition), suggests that the presence of a different colored stimulus in a location opposite to the RF does not affect the response at the RF. Together, these data suggest that the sort of center-surround mechanism found in V1 cannot explain the salience responses we see in LIP. Interestingly, the finding that responses in the field and distractor conditions were similar is consistent with the idea that LIP combines top-down and bottom-up signals in an agnostic manner (Ipata et al. 2009). This may actually be beneficial in guiding attention as overemphasizing global maximums may hamper relative value calculations (Louie and Glimcher 2010).
Unlike V1, some V4 cells can distinguish popout stimuli from conjunction stimuli (Burrows and Moore 2009). Using an index similar to our SSI, a small, but significant, bias was seen in a large population of V4 neurons. However, the distribution of their index values was very broad and, unlike our results, not primarily restricted to positive values. Thus, although many neurons in earlier visual areas provide information about salience along a single feature space, only a few provide information about pure salience. We suggest that LIP rapidly collates these signals and represents feature independent salience in a large population of neurons and combines it with top-down inputs to create a priority map.
One difficulty in interpreting the timing of the appearance of the salience enhancement is that many different studies use different techniques to identify the time at which the activity differentiates between the salient and control stimuli. We have reported a relatively short discrimination time (75 ms), obtained by pooling the mean raw data from all 42 neurons and performing paired t-tests at 10-ms intervals. Moreover, we obtained a similar result (71 ms) using the smoothed spike density functions. As such, it is difficult to compare our time analysis with that of Thomas and Pare (2007), who used one technique to calculate the discrimination time on a neuron by neuron level or with that of Buschman and Miller (2007), who used yet another technique. Due to the small differences in responses between salient and distractor stimuli, we were unable to calculate reasonable discrimination times at the single neuron level using either method. As such, we used population response methods under the assumption that an area receiving activity from LIP would integrate the responses over many neurons. While our discrimination times are somewhat shorter than those found by Thomas and Pare (2007), they lie well within the range reported by Buschman and Miller (2007), as well as a study examining target discrimination time in LIP that was not of a unique salient stimulus (Ipata et al. 2006). This gives us confidence that we are not getting an arbitrarily early time and that salience information is rapidly available in LIP.
The time at which the salience response appeared in LIP was relatively early. Previous work on V1 has reported that popout modulation, when it occurs, starts approximately 60 ms after stimulus presentation (Knierim and van Essen 1992), although the global popout modulation is primarily biased by feature discontinuities (Hegde and Felleman 2003). Our data definitely show a separation around 75 ms, which is consistent with other LIP studies (Ipata et al. 2006; Buschman and Miller 2007). A real separation that occurs at that time in V4 or 7a has not been statistically confirmed (Constantinidis and Steinmetz 2005; Burrows and Moore 2009). Indeed, the strong salience effect seen in area 7a appeared approximately 180 ms after the presentation of the stimuli (Constantinidis and Steinmetz 2005), and although they used a similar technique to identify the timing as we used, Burrows and Moore (2009) found that popout modulation in V4 appears around 115 ms after the presentation of the stimuli. Although differences in techniques and stimuli arrangements between the studies do not allow us to directly compare the timing across areas, a later discrimination time in V4 is consistent with the hypothesis that the basic proprieties of the object as shape or content are encoded in V4 (Pasupathy and Connor 2001; Arcizet et al. 2008) and that LIP establishes whether the stimulus is salient or not. We suggest that this information is sent back to V4, which would explain the later popout modulation effect (Burrows and Moore 2009). We believe that this model integrates the broad view of rapid selection (Treisman and Gelade 1980; Egeth and Yantis 1997; Wolfe and Horowitz 2004) with the concept that perceptual effects of popout stimuli require attention (Joseph et al. 1997; Burrows and Moore 2009).
We found that some LIP neurons were content selective independent of their responses to salient stimuli. We did not aim to study color selectivity in LIP per se, so our task was not optimally designed to address this issue; we used different luminances for the red and green stimuli. We found that LIP cells are equally distributed toward the green/light or red/dark preferences (Fig. 6C), suggesting that the content selectivity that we report is not due to brightness and thus, some LIP neurons are responding preferentially to the color of the salient stimulus, itself. This is consistent with the fact that selectivity to a number of stimulus features has been reported in LIP (Sereno and Maunsell 1998; Fanini and Assad 2009; Ogawa and Komatsu 2009), including color when the cue color is relevant to directing eye movements (Toth and Assad 2002; Ogawa and Komatsu 2009) and when it is cued as a distractor (Ogawa and Komatsu 2009). This color preference could be encoded by early visual areas, such as V4, that project to LIP (Blatt et al. 1990). Importantly, salience selectivity did not vary according to the color selectivity of the cell. Indeed, the vast majority of cells did not show any significant interaction between context and content, suggesting that the modulations related to each factor were independent (Ogawa and Komatsu 2009).
While we have described LIP as a priority map, used to guide the allocation of attention, we do not suggest that LIP is the only area involved in this process. It is likely that FEF and SC play equally important roles (McPeek and Keller 2002; Cavanaugh and Wurtz 2004; Ignashchenkova et al. 2004; Schall 2004; Armstrong et al. 2009; Wardak et al. 2010) and will show similar responses to those in LIP in response to task irrelevant salient stimuli. However, based on previous findings (Buschman and Miller 2007) and given its anatomical location, we suggest that LIP may be the first area in this network where a salient stimulus is globally represented.
Funding
Gerald Oppenheimer Family Foundation; a Klingenstein Fellowship Award in the Neurosciences; an Alfred P. Sloan Foundation Research Fellowship; a McKnight Scholar Award; National Eye Institute (R01 EY019273-01).
Acknowledgments
We thank the members of the UCLA DLAM for their superb animal care. Conflict of Interest : None declared.
References
- Arcizet F, Jouffrais C, Girard P. Natural textures classification in area V4 of the macaque monkey. Exp Brain Res. 2008;189:109–120. doi: 10.1007/s00221-008-1406-9. [DOI] [PubMed] [Google Scholar]
- Armstrong KM, Chang MH, Moore T. Selection and maintenance of spatial information by frontal eye field neurons. J Neurosci. 2009;29:15621–15629. doi: 10.1523/JNEUROSCI.4465-09.2009. [DOI] [PMC free article] [PubMed] [Google Scholar]
- Balan PF, Gottlieb J. Integration of exogenous input into a dynamic salience map revealed by perturbing attention. J Neurosci. 2006;26:9239–9249. doi: 10.1523/JNEUROSCI.1898-06.2006. [DOI] [PMC free article] [PubMed] [Google Scholar]
- Balan PF, Oristaglio J, Schneider DM, Gottlieb J. Neuronal correlates of the set-size effect in monkey lateral intraparietal area. PLoS Biol. 2008;6:e158. doi: 10.1371/journal.pbio.0060158. [DOI] [PMC free article] [PubMed] [Google Scholar]
- Barash S, Bracewell RM, Fogassi L, Gnadt JW, Andersen RA. Saccade-related activity in the lateral intraparietal area. I. Temporal properties; comparison with area 7a. J Neurophysiol. 1991;66:1095–1108. doi: 10.1152/jn.1991.66.3.1095. [DOI] [PubMed] [Google Scholar]
- Bisley JW, Goldberg ME. Neuronal activity in the lateral intraparietal area and spatial attention. Science. 2003;299:81–86. doi: 10.1126/science.1077395. [DOI] [PubMed] [Google Scholar]
- Bisley JW, Goldberg ME. Neural correlates of attention and distractibility in the lateral intraparietal area. J Neurophysiol. 2006;95:1696–1717. doi: 10.1152/jn.00848.2005. [DOI] [PMC free article] [PubMed] [Google Scholar]
- Bisley JW, Goldberg ME. Attention, intention, and priority in the parietal lobe. Annu Rev Neurosci. 2010;33:1–21. doi: 10.1146/annurev-neuro-060909-152823. [DOI] [PMC free article] [PubMed] [Google Scholar]
- Blatt GJ, Andersen RA, Stoner GR. Visual receptive field organization and cortico-cortical connections of the lateral intraparietal area (area LIP) in the macaque. J Comp Neurol. 1990;299:421–445. doi: 10.1002/cne.902990404. [DOI] [PubMed] [Google Scholar]
- Burrows BE, Moore T. Influence and limitations of popout in the selection of salient visual stimuli by area V4 neurons. J Neurosci. 2009;29:15169–15177. doi: 10.1523/JNEUROSCI.3710-09.2009. [DOI] [PMC free article] [PubMed] [Google Scholar]
- Buschman TJ, Miller EK. Top-down versus bottom-up control of attention in the prefrontal and posterior parietal cortices. Science. 2007;315:1860–1862. doi: 10.1126/science.1138071. [DOI] [PubMed] [Google Scholar]
- Bushnell MC, Goldberg ME, Robinson DL. Behavioral enhancement of visual responses in monkey cerebral cortex. I. Modulation in posterior parietal cortex related to selective visual attention. J Neurophysiol. 1981;46:755–772. doi: 10.1152/jn.1981.46.4.755. [DOI] [PubMed] [Google Scholar]
- Cavanaugh J, Wurtz RH. Subcortical modulation of attention counters change blindness. J Neurosci. 2004;24:11236–11243. doi: 10.1523/JNEUROSCI.3724-04.2004. [DOI] [PMC free article] [PubMed] [Google Scholar]
- Churchland AK, Kiani R, Shadlen MN. Decision-making with multiple alternatives. Nat Neurosci. 2008;11:693–702. doi: 10.1038/nn.2123. [DOI] [PMC free article] [PubMed] [Google Scholar]
- Colby CL, Duhamel JR. Spatial representations for action in parietal cortex. Brain Res Cogn Brain Res. 1996;5:105–115. doi: 10.1016/s0926-6410(96)00046-8. [DOI] [PubMed] [Google Scholar]
- Constantinidis C, Steinmetz MA. Posterior parietal cortex automatically encodes the location of salient stimuli. J Neurosci. 2005;25:233–238. doi: 10.1523/JNEUROSCI.3379-04.2005. [DOI] [PMC free article] [PubMed] [Google Scholar]
- Egeth HE, Yantis S. Visual attention: control, representation, and time course. Annu Rev Psychol. 1997;48:269–297. doi: 10.1146/annurev.psych.48.1.269. [DOI] [PubMed] [Google Scholar]
- Falkner AL, Krishna BS, Goldberg ME. Surround suppression sharpens the priority map in the lateral intraparietal area. J Neurosci. 2010;30:12787–12797. doi: 10.1523/JNEUROSCI.2327-10.2010. [DOI] [PMC free article] [PubMed] [Google Scholar]
- Fanini A, Assad JA. Direction selectivity of neurons in the macaque lateral intraparietal area. J Neurophysiol. 2009;101:289–305. doi: 10.1152/jn.00400.2007. [DOI] [PMC free article] [PubMed] [Google Scholar]
- Fecteau JH, Bell AH, Munoz DP. Neural correlates of the automatic and goal-driven biases in orienting spatial attention. J Neurophysiol. 2004;92:1728–1737. doi: 10.1152/jn.00184.2004. [DOI] [PubMed] [Google Scholar]
- Fecteau JH, Munoz DP. Salience, relevance, and firing: a priority map for target selection. Trends Cogn Sci. 2006;10:382–390. doi: 10.1016/j.tics.2006.06.011. [DOI] [PubMed] [Google Scholar]
- Gnadt JW, Andersen RA. Memory related motor planning activity in posterior parietal cortex of macaque. Exp Brain Res. 1988;70:216–220. doi: 10.1007/BF00271862. [DOI] [PubMed] [Google Scholar]
- Gottlieb JP, Kusunoki M, Goldberg ME. The representation of visual salience in monkey parietal cortex. Nature. 1998;391:481–484. doi: 10.1038/35135. [DOI] [PubMed] [Google Scholar]
- Hays AV, Richmond BJ, Optican LM. Unix-based multiple-process system, for real-time data acquisition and control. WESCON Conf Proc. 1982;2:1–10. [Google Scholar]
- Hegde J, Felleman DJ. How selective are V1 cells for pop-out stimuli? J Neurosci. 2003;23:9968–9980. doi: 10.1523/JNEUROSCI.23-31-09968.2003. [DOI] [PMC free article] [PubMed] [Google Scholar]
- Ignashchenkova A, Dicke PW, Haarmeier T, Thier P. Neuron-specific contribution of the superior colliculus to overt and covert shifts of attention. Nat Neurosci. 2004;7:56–64. doi: 10.1038/nn1169. [DOI] [PubMed] [Google Scholar]
- Ipata AE, Gee AL, Bisley JW, Goldberg ME. Neurons in the lateral intraparietal area create a priority map by the combination of disparate signals. Exp Brain Res. 2009;192:479–488. doi: 10.1007/s00221-008-1557-8. [DOI] [PMC free article] [PubMed] [Google Scholar]
- Ipata AE, Gee AL, Goldberg ME, Bisley JW. Activity in the lateral intraparietal area predicts the goal and latency of saccades in a free-viewing visual search task. J Neurosci. 2006;26:3656–3661. doi: 10.1523/JNEUROSCI.5074-05.2006. [DOI] [PMC free article] [PubMed] [Google Scholar]
- Itti L, Koch C. Computational modelling of visual attention. Nat Rev Neurosci. 2001;2:194–203. doi: 10.1038/35058500. [DOI] [PubMed] [Google Scholar]
- Joseph JS, Chun MC, Nakayam K. Attentional requirements in a “preattentive” feature search task. Nature. 1997;387:805–807. doi: 10.1038/42940. [DOI] [PubMed] [Google Scholar]
- Knierim JJ, van Essen DC. Neuronal responses to static texture patterns in area V1 of the alert macaque monkey. J Neurophysiol. 1992;67:961–980. doi: 10.1152/jn.1992.67.4.961. [DOI] [PubMed] [Google Scholar]
- Koch C, Ullman S. Shifts in selective visual attention: towards the underlying neural circuitry. Hum Neurobiol. 1985;4:219–227. [PubMed] [Google Scholar]
- Kusunoki M, Gottlieb J, Goldberg ME. The lateral intraparietal area as a salience map: the representation of abrupt onset, stimulus motion, and task relevance. Vision Res. 2000;40:1459–1468. doi: 10.1016/s0042-6989(99)00212-6. [DOI] [PubMed] [Google Scholar]
- Li Z. A saliency map in primary visual cortex. Trends Cogn Sci. 2002;6:9–16. doi: 10.1016/s1364-6613(00)01817-9. [DOI] [PubMed] [Google Scholar]
- Louie K, Glimcher PW. Separating value from choice: delay discounting activity in the lateral intraparietal area. J Neurosci. 2010;30:5498–5507. doi: 10.1523/JNEUROSCI.5742-09.2010. [DOI] [PMC free article] [PubMed] [Google Scholar]
- Mazer JA, Gallant JL. Goal-related activity in V4 during free viewing visual search. Evidence for a ventral stream visual salience map. Neuron. 2003;40:1241–1250. doi: 10.1016/s0896-6273(03)00764-5. [DOI] [PubMed] [Google Scholar]
- McPeek RM, Keller EL. Saccade target selection in the superior colliculus during a visual search task. J Neurophysiol. 2002;88:2019–2034. doi: 10.1152/jn.2002.88.4.2019. [DOI] [PubMed] [Google Scholar]
- Mirpour K, Arcizet F, Ong WS, Bisley JW. Been there, seen that: a neural mechanism for performing efficient visual search. J Neurophysiol. 2009;102:3481–3491. doi: 10.1152/jn.00688.2009. [DOI] [PMC free article] [PubMed] [Google Scholar]
- Mirpour K, Ong WS, Bisley JW. Microstimulation of posterior parietal cortex biases the selection of eye movement goals during search. J Neurophysiol. 2010;104:3021–3028. doi: 10.1152/jn.00397.2010. [DOI] [PMC free article] [PubMed] [Google Scholar]
- Ogawa T, Komatsu H. Condition-dependent and condition-independent target selection in the macaque posterior parietal cortex. J Neurophysiol. 2009;101:721–736. doi: 10.1152/jn.90817.2008. [DOI] [PubMed] [Google Scholar]
- Oristaglio J, Schneider DM, Balan PF, Gottlieb J. Integration of visuospatial and effector information during symbolically cued limb movements in monkey lateral intraparietal area. J Neurosci. 2006;26:8310–8319. doi: 10.1523/JNEUROSCI.1779-06.2006. [DOI] [PMC free article] [PubMed] [Google Scholar]
- Pasupathy A, Connor CE. Shape representation in area V4: position-specific tuning for boundary conformation. J Neurophysiol. 2001;86:2505–2519. doi: 10.1152/jn.2001.86.5.2505. [DOI] [PubMed] [Google Scholar]
- Schall JD. On the role of frontal eye field in guiding attention and saccades. Vision Res. 2004;44:1453–1467. doi: 10.1016/j.visres.2003.10.025. [DOI] [PubMed] [Google Scholar]
- Serences JT, Yantis S. Selective visual attention and perceptual coherence. Trends Cogn Sci. 2006;10:38–45. doi: 10.1016/j.tics.2005.11.008. [DOI] [PubMed] [Google Scholar]
- Sereno AB, Maunsell JH. Shape selectivity in primate lateral intraparietal cortex. Nature. 1998;395:500–503. doi: 10.1038/26752. [DOI] [PubMed] [Google Scholar]
- Thomas NW, Pare M. Temporal processing of saccade targets in parietal cortex area LIP during visual search. J Neurophysiol. 2007;97:942–947. doi: 10.1152/jn.00413.2006. [DOI] [PubMed] [Google Scholar]
- Thompson KG, Biscoe KL, Sato TR. Neuronal basis of covert spatial attention in the frontal eye field. J Neurosci. 2005;25:9479–9487. doi: 10.1523/JNEUROSCI.0741-05.2005. [DOI] [PMC free article] [PubMed] [Google Scholar]
- Thompson KG, Hanes DP, Bichot NP, Schall JD. Perceptual and motor processing stages identified in the activity of macaque frontal eye field neurons during visual search. J Neurophysiol. 1996;76:4040–4055. doi: 10.1152/jn.1996.76.6.4040. [DOI] [PubMed] [Google Scholar]
- Toth LJ, Assad JA. Dynamic coding of behaviourally relevant stimuli in parietal cortex. Nature. 2002;415:165–168. doi: 10.1038/415165a. [DOI] [PubMed] [Google Scholar]
- Treisman AM, Gelade G. A feature-integration theory of attention. Cogn Psychol. 1980;12:97–136. doi: 10.1016/0010-0285(80)90005-5. [DOI] [PubMed] [Google Scholar]
- Treisman AM, Sato TR. Conjunction search revisited. J Exp Psychol Hum Percept Perform. 1990;16:459–478. doi: 10.1037//0096-1523.16.3.459. [DOI] [PubMed] [Google Scholar]
- Wardak C, Vanduffel W, Orban GA. Searching for a salient target involves frontal regions. Cereb Cortex. 2010;20:1464–1477. doi: 10.1093/cercor/bhp315. [DOI] [PubMed] [Google Scholar]
- Wolfe JM. Guided Search 2.0. A revised model of visual search. Psychon Bull Rev. 1994a;1:202–238. doi: 10.3758/BF03200774. [DOI] [PubMed] [Google Scholar]
- Wolfe JM. Visual search in continuous, naturalistic stimuli. Vision Res. 1994b;34:1187–1194. doi: 10.1016/0042-6989(94)90300-x. [DOI] [PubMed] [Google Scholar]
- Wolfe JM, Horowitz TS. What attributes guide the deployment of visual attention and how do they do it? Nat Rev Neurosci. 2004;5:495–501. doi: 10.1038/nrn1411. [DOI] [PubMed] [Google Scholar]
- Zipser K, Lamme VA, Schiller PH. Contextual modulation in primary visual cortex. J Neurosci. 1996;16:7376–7389. doi: 10.1523/JNEUROSCI.16-22-07376.1996. [DOI] [PMC free article] [PubMed] [Google Scholar]