Abstract
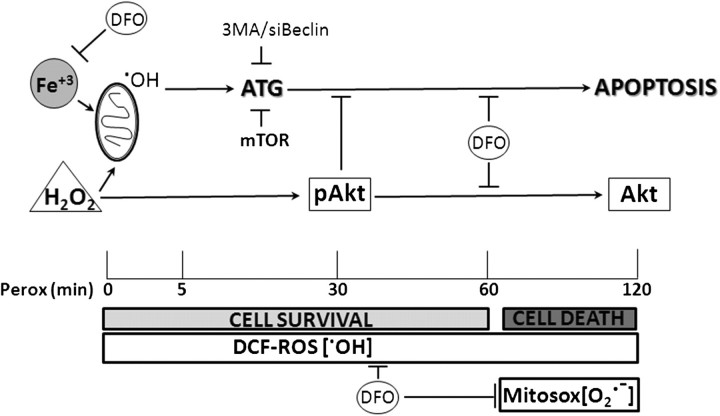
In human neuroblastoma SH-SY5Y cells, hydrogen peroxide (H2O2, 200μM) rapidly (< 5 min) induced autophagy, as shown by processing and vacuolar relocation of light chain 3(LC3). Accumulation of autophagosome peaked at 30 min of H2O2 exposure. The continuous presence of H2O2 eventually (at > 60 min) caused autophagy-dependent annexin V–positive cell death. However, the cells exposed to H2O2 for 30 min and then cultivated in fresh medium could recover and grow, despite ongoing autophagy. H2O2 rapidly (5 min) triggered the formation of dichlorofluorescein-sensitive HO·-free radicals within mitochondria, whereas the mitochondria-associated oxidoradicals revealed by MitoSox (O2·−) became apparent after 30 min of exposure to H2O2. 3-Methyladenine inhibited autophagy and cell death, but not the generation of HO·. Genetic silencing of beclin-1 prevented bax- and annexin V–positive cell death induced by H2O2, confirming the involvement of canonical autophagy in peroxide toxicity. The lysosomotropic iron chelator deferoxamine (DFO) prevented the mitochondrial generation of both HO. and O2·− and suppressed the induction of autophagy and of cell death by H2O2. Upon exposure to H2O2, Akt was intensely phosphorylated in the first 30 min, concurrently with mammalian target of rapamycin inactivation and autophagy, and it was dephosphorylated at 2 h, when > 50% of the cells were dead. DFO did not impede Akt phosphorylation, which therefore was independent of reactive oxygen species (ROS) generation but inhibited Akt dephosphorylation. In conclusion, exogenous H2O2 triggers two parallel independent pathways, one leading to autophagy and autophagy-dependent apoptosis, the other to transient Akt phosphorylation, and both are inhibited by DFO. The present work establishes HO· as the autophagy-inducing ROS and highlights the need for free lysosomal iron for its production within mitochondria in response to hydrogen peroxide.
Keywords: autophagy, cell death, oxidative stress, deferoxamine, lysosomes
Superoxide anion, a potentially harmful reactive oxygen species (ROS), is constantly produced in aerobic cells as a by-product of mitochondrial respiration. Superoxide anion is rapidly converted by cytosolic superoxide dismutases into H2O2, a short-lived molecule that may serve as a cell survival messenger (Groeger et al., 2009). However, when its production exceeds the antioxidant defenses, H2O2 poses a serious threat to the cell. Such an eventuality is likely to occur in brain tissue exposed to neurotransmitters (Yamato et al., 2010), ischemia-reperfusion (Hyslop et al., 1995; Slemmer et al., 2008), anesthetics (Roberts et al., 2009), or environmental neurotoxins (Hatcher et al., 2007; McCormack et al., 2005).
By interacting with ferrous ions, H2O2 generates highly toxic hydroxyl radical (HO·) via Fenton reaction (Brunk et al., 1992). In this reaction, iron is oxidized to ferric ion and can be reduced back to ferrous ion by reacting with superoxide anion in the Haber-Weiss reaction. Several lines of evidence demonstrate that H2O2 toxicity is linked to the iron-dependent generation of ROS within lysosomes (Castino et al., 2007; Persson et al., 2003; Yu et al., 2003) and mitochondria (Uchiyama et al., 2008). Iron accumulates in lysosomes following the continuous delivery to this organelle of iron-containing proteins via endocytosis and macroautophagy (Kidane et al., 2006; Kurz et al., 2008).
Macroautophagy (hereafter autophagy) helps the cell to face with intra- and extracellular stresses by enabling the lysosomal degradation of damaged or redundant cellular components, thus preventing harmful consequences and recovering substrates and energy for synthesis of new molecules and membranes (Yang and Klionsky, 2010). The material to be degraded is packaged into the autophagosome, a double-layered membrane vesicle that subsequently fuses with endosomes and, eventually, with lysosomes. The final step of the autophagy process consists in the extensive degradation of the sequestered material by lysosomal acid hydrolases (Yang and Klionsky, 2010). Activation of autophagy is aimed at overcoming stressful situations, yet in certain circumstances its hyperactivation may end-up in cell death (Kroemer and Levine, 2008). Oxidative stress affects the proper folding of proteins, which eventually form insoluble toxic aggregates. In addition, membrane lipid peroxidation alters the integrity of organelles that become leaky and therefore harmful. Autophagy in oxidative stressed cells removes such oxidized molecules and organelles, thus favoring cell survival (Isidoro et al., 2009). However, in several settings, H2O2 toxicity has been linked to induction of macroautophagy (Castino et al., 2010; Chen et al., 2008; Choi et al., 2010; Pivtoraiko et al., 2009).
As an attempt to survive to the oxidative injury, the cell exposed to H2O2 may rapidly activate the Akt/protein kinase B signaling pathway to suppress bax-mediated apoptosis (Sadidi et al., 2009). Despite the initial activation of Akt, cells extensively exposed to oxidative stress in the end undergo apoptosis and/or necrosis (Castino et al., 2010; Simon et al., 2000), an event associated with inactivation of the Akt pathway (Martin et al., 2002). Ser-473–phosphorylated Akt suppresses not only apoptosis (Thompson and Thompson, 2004) but also autophagy (Arico et al., 2001; Degtyarev et al., 2008), though in some circumstances it may precipitate apoptotic cell death following inhibition of protective autophagy (Castino et al., 2008b). Thus, the functional relationship between Akt phosphorylation and the regulation of autophagy and apoptosis in response to an oxidative stress remains to be determined. Also to be solved is the source (and the nature) of ROS involved in the modulation of Akt activity and of the autophagy and apoptosis pathways.
In this work, dopaminergic neuroblastoma SH-SY5Y cells were exposed for 30 or 120 min to 200μM H2O2, an experimental condition that mimics the situation described in striatal cerebral area following ischemia-reperfusion (Hyslop et al., 1995). Exogenous H2O2 induced autophagy in SH-SY5Y cells despite the concomitant activation of Akt and led to apoptosis at the time of Akt dephosphorylation. Chelation of lysosomal iron by deferoxamine (DFO) prevented the prompt generation at mitochondrial level of autophagy-inducing hydroxyl radicals and onset of autophagy-dependent apoptosis. Further, DFO did not interfere with the early activation of Akt but effectively inhibited the subsequent dephosphorylation of Akt. These findings highlight the role of lysosomal iron in driving autophagy in cells subjected to hydrogen peroxide stress and provide a mechanistic rationale for the neuroprotective activity of DFO in neurons exposed to H2O2-generating stresses such as neurotransmitters, hypoxia-reperfusion, and toxins.
MATERIALS AND METHODS
Unless otherwise specified, all chemicals were from Sigma-Aldrich Corp. (St Louis, MO).
Cells and treatments.
Human neuroblastoma SH-SY5Y cells (American Type Culture Collection, Manassan, VA) were cultivated under standard culture conditions as previously reported (Castino et al., 2007). Cells were seeded and let adhere on sterile plastic dishes or coverslips for 24 h prior to start any treatment. Oxidant treatments were performed with 200μM H2O2 (code H3410). Where indicated, the cells were preincubated with 10mM 3-methyladenine (3MA, 3 h, code M9281) or 1mM DFO (2 h, code D9533) or 10 mM ammonium chloride (1 h, code A0171); 1μM of the Akt inhibitor FPA-124 (Echelon Biosciences, Inc., Salt Lake City, UT, code B-0101) was administered to the cell 1 h prior to the exposure to H2O2. Rapamycin (Alexis Laboratories, San Diego, CA, code ALX-380-004) was used at 100nM final concentration.
Assessment of cell death.
Cell loss from the monolayer was documented by phase contrast microscopy and assessed by counting adherent viable (trypan blue excluding) cells in the culture. Cell death was assessed by cytofluorometry analysis of annexin V-fluorescein isothiocyanate–positive cells (Alexis Laboratories, code ALX-209-250), assumed as indicator of apoptosis, as previously reported in detail (Castino et al., 2010). Cytofluorometry data were interpreted using the winMDI software.
Clonogenic assay.
The cells pretreated or not with 3MA or DFO were exposed for the 30 min or 4 h (as indicated in the text) to H2O2, then the medium was changed and the cells further cultivated for the time indicated in the absence of H2O2.
Fluorescence imaging of ROS, mitochondria, autophagy, and apoptosis.
The presence of ROS was revealed by preloading the cells (15 min prior to the treatment with H2O2) with 10μM 2′-7′-dihydrodichlorofluoroscein diacetate (H2DCF-DA; Molecular Probes-Invitrogen Co., Carlsbad, CA, code C2938), which becomes fluorescent once oxidized into dichlorofluorescein (DCF). The generation of mitochondrial superoxide anion was detected by using MitoSox-red (Molecular Probes-Invitrogen Co., code M36008) as instructed by the manufacturer. Mitochondria were detected in living cell by using the fluorescent probe Rhodamine123 hydrochloride (50nM, 10 min prior to microscope imaging; Alexis Laboratories, code 610-018-M005). Formation of autophagosomes was monitored in living cells stably transfected with a plasmid coding for the fluorescent chimeric protein green fluorescent protein-light chain 3 (GFP-LC3) (Castino et al., 2007; Trincheri et al., 2008). The presence of acidic autophagolysosomes was detected in living cells as a function of the uptake and accumulation of monodansylcadaverine (MDC, code 30432), as previously reported (Trincheri et al., 2008). Markers of the autophagy-lysosomal system (LC3, beclin-1, Lamp1) were detected by immunofluorescence imaging in cells seeded and treated on sterile coverslip as already reported (Castino et al., 2010). Apoptosis was morphologically assessed based on chromatin alterations (as detected by propidium iodide, code 81845 or 4',6-diamidino-2-phenylindole staining, code 32670) and of bax/mitotracker staining, as reported elsewhere (Castino et al., 2010). The integrity of mitochondrial membrane was demonstrated by retention of the fluorescent probe mitotracker (Molecular Probes-Invitrogen Co., code M22425). At the end of the treatment, the cells were incubated for 1 h at 37°C with 100nM mitotracker and then fixed (in 3.7% paraformaldehyde) and processed for immunofluorescence. The following antibodies specific for bax (Cell Signaling Technology, Inc., Danvers, MA, code BK2772), beclin-1 (mouse, BD Biosciences Laboratories, Franklin Lakes, NJ, code 612112; rabbit, Santa Cruz Biotechnology, Inc., Santa Cruz, CA, code sc-10086), LC3 (Novus Biologicals, Littleton, CO, code NB600-1384), Lamp1 (BD Transduction Laboratories, code 611043), and Golgin-97 (Santa Cruz Biotechonology, Inc., code sc-59820) were used. Immunocomplexes were revealed with secondary antibodies, either IRIS-2 (green fluorescence)– or IRIS-3 (red fluorescence)–conjugated goat-anti-rabbit IgG or goat-anti-mouse IgG (Cyanine Technology SpA, Turin, Italy, code 2WS-08, 3WS-07), as appropriate. Fluorescence stained coverslips were observed with a Leica DMI600 fluorescence microscope (Leica Microsystems AG, Wetzlad, Germany). For each experimental condition, three to five coverslips were prepared. At least four fields in each coverslip were examined and evaluated by two independent investigators blind to treatments. Representative images of selected fields are shown. All experiments were replicated at least three times. Quantification was assessed by using the software ImageJ freely available at http://rsbweb.nih.gov/ij/. Note that image quantification of fluorescent cells on coverslip exposed to H2O2 for a time > 30 min is given as a proportion of the remnant cells still adherent.
Small interference RNA (siRNA)-mediated gene silencing of beclin-1.
The sequence for the sense strand of Small interference RNA (siRNA) for posttranscriptional silencing of beclin-1 has been previously reported (Trincheri et al., 2008). An inefficient oligonucleotide, corresponding to the AGGUAGUGUAAUCGCCUUG sequence, was used as a negative control of transfection (referred to as “sham”). Adherent cells were incubated for 4 h with 400 pmol RNA duplexes in the presence of 10 μl Lipofectamine 2000 in 1 ml of Opti-MEM (Invitrogen Co., code 11668027, 11058021). Cells were then incubated for 30 h in fresh medium prior to start the oxidant treatment.
Protein expression analysis.
Immunoblotting was performed following standard procedures. Akt and phosphorylated (ser473) Akt were detected with specific rabbit polyclonal anti-human Akt antisera (Cell Signaling Technology, Inc., code 9272, 9271). LC3 was detected using a monoclonal antibody (Novus Biologicals, code NB600-1384). S6 and ser235/236-pS6 were detected with rabbit monoclonal antibodies (Cell Signaling Technology, Inc., code 2217 and code 4856, respectively). Beclin-1 was detected using a mouse anti-beclin-1 (BD Biosciences Laboratories, code 612112). The same filter was subsequently probed with a mouse monoclonal antibody specific for β-actin (code A5441, clone AC-15) or for β-tubulin (code T5293) to prove equal loading of homogenate proteins between lanes. Immunocomplexes were revealed by using a peroxidase-conjugated secondary antibody, as appropriate, and subsequent peroxidase-induced chemiluminescence reaction (PerkinElmer, Inc., Waltham, MA, code NEL105001EA). Intensity of the bands was estimated by densitometry with both the ImageJ software (http://rsbweb.nih.gov/ij/) and the Quantity One software (VersaDOC Imaging System; Bio-Rad Laboratories, Inc., Hercules, CA). Western blotting data were reproduced in at least three to four separate experiments.
Statistical analysis.
Unless otherwise specified, all the experiments were performed in triple and reproduced at least three times. Data are given as mean ± SD. The Student's t-test was performed to calculate statistical significance. The following p values were considered significant: *p < 0.05, **p < 0.01, ***p < 0.001, n.s., not significant. The XLStat 2010 software was used.
RESULTS
Activation of the Akt Pathway and Hydrogen Peroxide Toxicity
In SH-SY5Y cells exposed to 200μM H2O2 signs of cell sufferance were apparent at a time > 30 min, whereas cell death was frankly evident in almost 50% of the culture by 2 h (Castino et al., 2007 and below). As determined by the phosphorylation at ser473, Akt was highly activated (> 10-folds; p < 0.001) in oxidative-stressed cells at the time when no evidence of cell sufferance was detectable (30 min), whereas it was completely inactivated by the time (2 h) of apoptosis onset (Fig. 1A). To determine the contribution of the Akt pathway in the response to H2O2 in our model, oxidative stress was induced in the presence of an Akt inhibitor. Counting of viable cells revealed that cell loss, amounting to approximately 60%, occurred at 2 h and that inhibition of Akt exacerbated and anticipated H2O2 toxicity (Fig. 1B). The activation of the intrinsic death pathway was assessed by double staining the cells with mitotracker (a tracer of mitochondrial membrane integrity) and with antibodies specific for the conformational active bax. Although no signs of mitochondrial damage were detectable by 30 min of incubation with peroxide, at 2 h mitochondria lost their integrity in concomitance with activation of bax (Fig. 1C). In the presence of the Akt inhibitor, activation of the bax-mitochondria death pathway was evident already at 30 min of exposure to H2O2 and involved a larger proportion of cells at 2 h (Fig. 1C), in accordance with cell counting data (Fig. 1B). These data are consistent with the view that activation of the Akt pathway exerts a protective function against peroxide toxicity, at least in the initial phase of the intoxication.
FIG. 1.
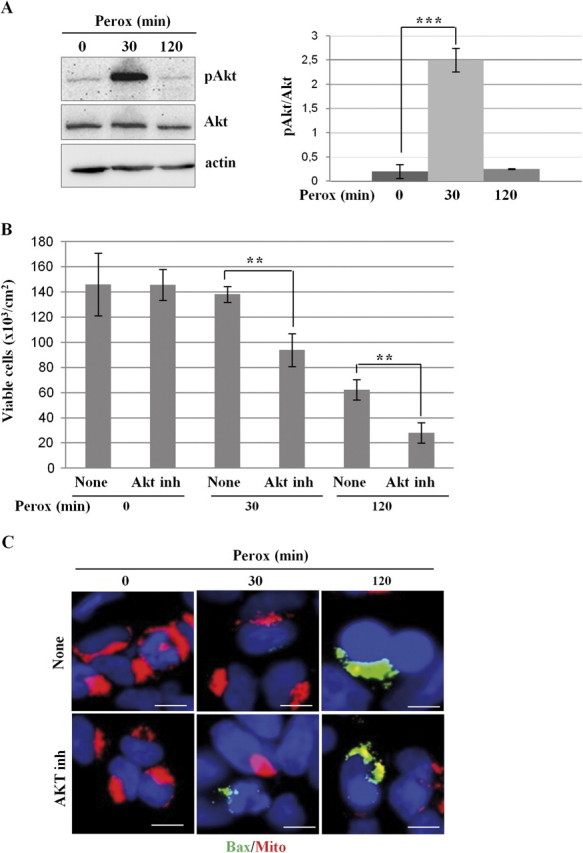
Inhibition of Akt sensitizes SH-SY5Y cells to H2O2 toxicity. (A) Western blotting of ser473-phosphoAkt and of total Akt in homogenates of SH-SY5Y cells exposed or not to 200μM H2O2 for the time indicated. One representative gel out of four independent experiments is shown. The filter was stripped and probed for actin as a marker of protein loading. The densitometry ratio of pAkt/total Akt is reported. (B) SH-SY5Y cells were preincubated or not with an Akt inhibitor and cultivated for up to 120 min in the absence or the presence of 200μM H2O2 (perox). At designated time-points, the adherent viable (trypan blue excluding) cells were counted. Cell density data obtained from three independent experiments in triple. (C) SH-SY5Y cells were preincubated or not with an Akt inhibitor and cultivated on sterile coverslips for 30 or 120 min in the absence or the presence of 200μM H2O2 (perox). At the end, the cells were stained with mitotracker and for immunofluorescence detection of active bax. Bax-positive/mitotracker-negative cells amounted to 15 ± 5% at 30 min and to 40 ± 15% (of the adherent cells) at 120 min in cultures exposed to H2O2 in the absence of the Akt inhibitor and to 42 ± 12% and to > 80% in the parallel cultures incubated in the presence of the Akt inhibitor. Data reproduced in three independent experiments. Bar = 10 μm.
Hydrogen Peroxide Stimulates Protective Autophagy Concurrently with Akt Activation
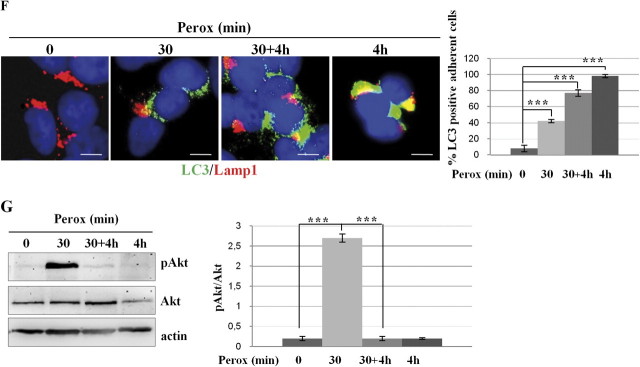
Next, we investigated whether autophagy plays an active role in the dynamic cellular response to oxidative stress. When autophagy is active, the microtubule-associated LC3 protein undergoes posttranslational modifications and relocates from the cytoplasm to vacuolar-like structures (Kabeya et al., 2000). H2O2 induction of autophagy was monitored in transfected SH-SY5Y cells stably expressing the GFP-LC3 chimera (Castino et al., 2008a). In control cells, GFP-LC3 showed a diffuse cytoplasmic fluorescence, whereas a punctate fluorescence, indicative of vacuolar localization of LC3, became evident shortly (5 min) after exposure to H2O2 in approximately 35% of cell population (Fig. 2A). The proportion of cells showing a vacuolar pattern of GFP-LC3 fluorescence (> 10 puncta per cell) rapidly increased with time of incubation with H2O2, reaching the maximal peak at 30 min (involving ∼50% of the cells), and then slightly declined by 2 h to approximately 30% of the cells that survived the treatment. This decline possibly reflected the consumption of LC3 within the newly formed autophagolysosomes. The H2O2-induced vacuolar relocation of LC3 was associated with the processing of LC3 into the 16-kDa isoform II (Fig. 2B). To determine whether H2O2 actually induced autophagy or interfered with the basal autophagy flux, the cells were exposed to oxidative stress in the presence of ammonium chloride. This drug impairs the activity of acid hydrolases and the fusion of autophagosomes with lysosomes by raising the internal vacuolar pH, thus preserving LC3 II from lysosomal degradation (Kawai et al., 2007). In the presence of ammonium chloride, LC3 II accumulated in oxidative-stressed cells, confirming that H2O2 in fact increased the autophagy rate. This was further confirmed by imaging the acidic vacuolar compartments (which includes autophagolysosomes) with the pH-sensitive fluorescent probe Acridine Orange (Fig. 2C). That accumulation of vacuolar LC3 in peroxide-treated cells was not the result of autophagy flux inhibition was finally ruled out by showing the colocalization of endogenous LC3 with Lamp1, a lysosomal marker. The images in Figure 2D demonstrate the fusion of autophagosomes with lysosomes in cells exposed to H2O2, and this event is largely inhibited in the presence of ammonium chloride as expected. To see whether at this time autophagy was protecting the cells from oxidative stress injury, SH-SY5Y cells were exposed to H2O2 for 30 min and then rinsed and further incubated for 4 h in fresh medium. The phase-contrast imaging of the monolayers shows that no cell loss occurred in these experimental conditions (Fig. 2E). By contrast, in parallel cultures exposed to H2O2 for 4 h, approximately 90% of the cells detached in consequence of cell death (Fig. 2E). It is noticed that autophagy was active in all conditions of H2O2 stimulation (Fig. 2F). Data in Figure 1 showed that when exposed to 200μM H2O2 SH-SY5Y cells initially resist by activating transitorily the Akt pathway, but later they succumb in concomitance with Akt inactivation. We therefore determined the phosphorylation status of Akt in the aforementioned culture conditions. Akt was strongly activated in the cells exposed for 30 min to H2O2 and returned to the basal value of phosphorylation in the following 4 h of incubation, regardless of whether still in the presence of H2O2 or in fresh medium (Fig. 2G). It is noticed, however, that after 4 h of continuous culture in the presence of H2O2 the total amount of Akt was reduced of some 40%. From these data, we conclude that (1) autophagy is a very early response to H2O2 stress and reaches its maximal level at 30 min concurrently with and despite of the activation of Akt, (2) autophagy remains upregulated (for at least 4 h) in cells challenged with H2O2 also when the stimulus is removed, (3) the cells fully recover from a 30 min of H2O2 exposure, suggesting a cooperative protective activity by Akt and autophagy.
FIG. 2.
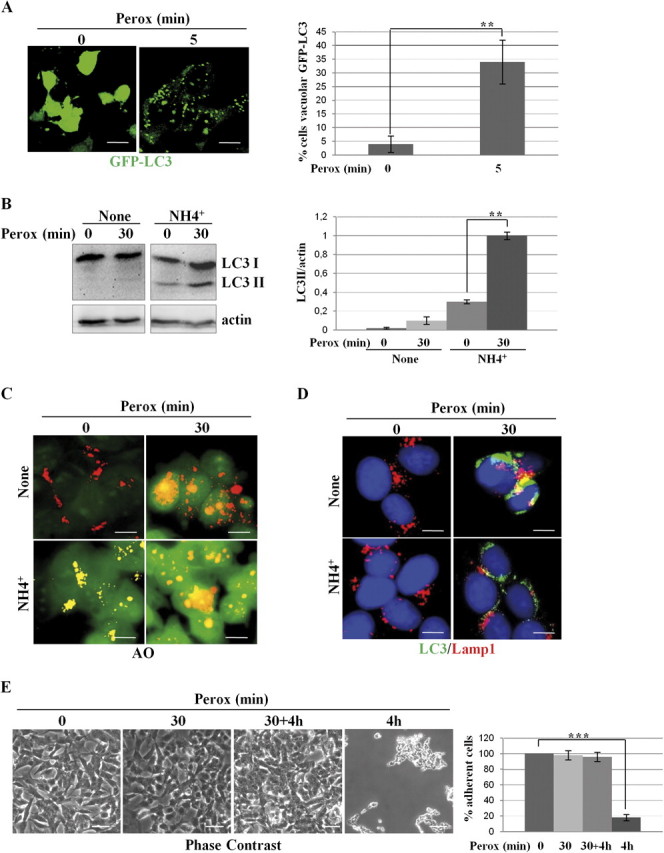
H2O2 rapidly triggers protective autophagy in SH-SY5Y cells. (A) Transfected SH-SY5Y cells expressing the fluorescent chimeric protein GFP-LC3 were exposed or not to 200μM H2O2 (perox). The diffuse cytoplasmic fluorescence in control (Co) cells assumes a punctate pattern soon after (5 min) exposure to H2O2. Estimation of the proportion of cells presenting > 10 positive puncta/cell is reported. (B) Western blotting showing the appearance of the autophagosome marker LC3 II in cells exposed to H2O2 (perox, 30 min) in the absence or the presence of the weak base ammonium chloride (NH4Cl). The densitometry ratio of LC3 II normalized versus actin from three independent experiments is reported. (C) H2O2 increases the number and the volume of acidic vacuolar compartments stained with the acidotropic fluorochrome Acridine Orange. NH4Cl determines the alkalinization and swelling of acidic compartments in > 90% of the cell population. (D) H2O2 stimulates the formation of LC3-Lamp1 double-positive autophagolysosomes. NH4Cl largely (> 75%) prevented the fusion of LC3-positive autophagosomes with Lamp1-positive endosomes and lysosomes. (E–F) Cells incubated for 4 h in the absence of H2O2 or incubated for 30 min in the presence of H2O2 (perox) or incubated for 30 min in the presence of H2O2, then rinsed, and further incubated for 4 h in fresh medium (perox 30 min + 4 h, or incubated for 4 h in the presence of H2O2. Panels in (E) show the phase-contrast image of the monolayers, whereas panels in (F) show the immunofluorescence in cells labeled for LC3 and Lamp1. Representative images of three independent experiments are shown. Bar = 10 μm. Quantification and statistic is presented (note that at 4 h < 10% of the initial cell population was still attached on coverslip). (G) Western blotting of ser473-pAkt and of total Akt in cell homogenates of parallel cultures incubated as for the experiments described in (E). The filter was stripped and probed for actin as marker of protein loading. One representative gel out of three independent experiments is shown. The densitometry ratio of pAkt/total Akt is reported. Statistical significance between relevant treatments is indicated.
Induction of Autophagy Parallels Peroxide-Induced Inactivation of Mammalian Target of Rapamycin and Is Prevented by 3-Methyladenine
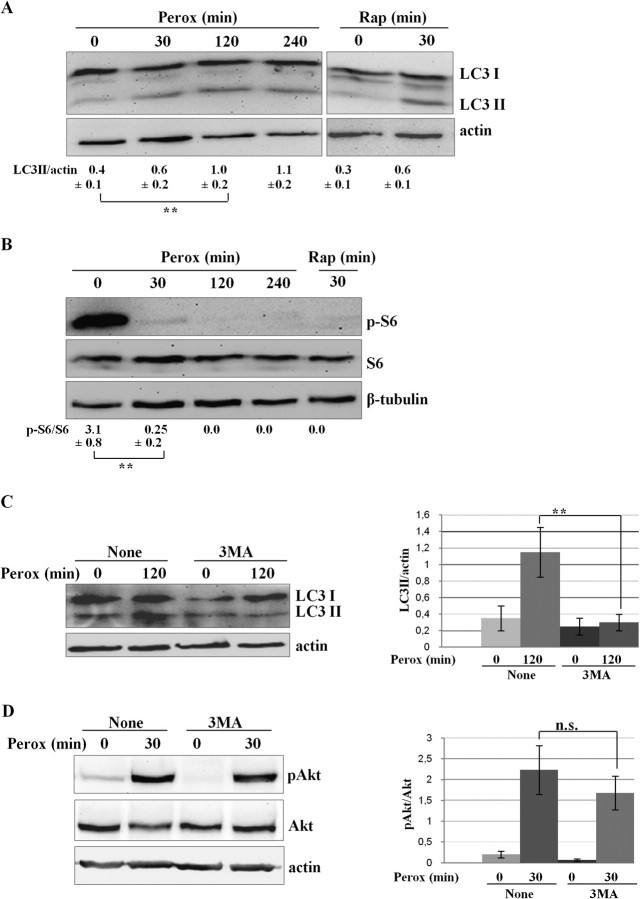
It was a kind of surprise that autophagy peaked at 30 min of H2O2 challenge in concomitance with maximal Akt phosphorylation. We therefore investigated further on the functional relationship between the Akt pathway and induction of autophagy under oxidative stress conditions. Continuous incubation with H2O2 for up to 4 h led to the sustained production of autophagosomes, as demonstrated by LC3 II production (Fig. 3A) and consistent with the above data (Fig. 2F). We interrogated the signaling pathway downstream Akt and impinging on autophagy regulation. Mammalian target of rapamycin (mTOR) is a protein kinase that is indirectly activated by phosphorylated Akt and that when bound together with raptor forms the complex mTORC1 which negatively regulates autophagy (Arsham and Neufeld, 2006). Consistently, disruption of mTORC1 with rapamycin promptly resulted in autophagosome formation, as testified by the generation of LC3 II (Fig. 3A). We then looked at the phosphorylation status of the ribosomal proteins S6, a down-stream substrate of p70S6kinase, which mirrors the mTOR kinase activity (Tato et al., 2011). As expected in healthy growing cells, in controls S6 is intensely phosphorylated, whereas upon exposure to H2O2 it is rapidly dephosphorylated indicating that mTOR is inactive under oxidative stress condition (Fig. 3B). It is somehow intriguing that at 30 min of H2O2 exposure, when Akt is intensely phosphorylated, the mTOR pathway appears nearly completely inactive as it happens in rapamycin-treated cells (Fig. 3B). Thus, under oxidative stress rapid inactivation of mTOR occurs despite the transient phosphorylation of Akt, and this parallels the autophagy process. Induction of autophagy is positively regulated by phosphatidylinositol-3-phosphate kinase (PI3k) class III (Vps34) and is negatively regulated by PI3k class I (Isidoro et al., 2009). The PI3k inhibitor 3MA can inhibit autophagy (Seglen and Gordon, 1982), if used under appropriate condition of concentration and time of incubation that preferentially inhibit only PI3k class III (Wu et al., 2010). 3MA effectively inhibited the formation of autophagosomes, as monitored by LC3 II processing (Fig. 3C), confirming the induction of Vps34-dependent in response to H2O2 and in agreement with our previous experiments in SH-SY5Y cells expressing a transgenic Vps34-dominant negative (Castino et al., 2010). To see whether in our condition 3MA also affected the PI3k class I pathway (Wu et al., 2010), we assayed its effect on the phosphorylation of Akt in H2O2-treated cells. In our experimental condition, 3MA apparently did not interfere with PI3K class I activity because the level of phosphorylated Akt in oxidative stressed cells remained substantially unchanged regardless of whether the cells had been incubated or not with this drug (Fig. 3D).
FIG. 3.
Peroxide-induced autophagy is associated with inactivation of the mTOR pathway and 3MA inhibits autophagy but not transient phosphorylation of Akt. (A) Western blotting of LC3 in SH-SY5Y cells exposed to 200μM H2O2 (perox) for up to 4 h. As a positive control, the homogenate of SH-SY5Y cells exposed to 100nM rapamycin (rap) for 30 min is included. The filter was tripped and reprobed for actin. The LC3 II/actin ratio was calculated by densitometry of three independent experiments. Statistical significance between relevant treatments is indicated. (B) Western blotting of ser235/236-pS6 in SH-SY5Y cells treated as for panel (A). The filter was tripped and subsequently reprobed for total S6 and for tubulin. The pS6/S6 ratio was calculated by densitometry of three independent experiments. Statistical significance between relevant treatments is indicated. (C) Western blotting of LC3 in SH-SY5Y cells exposed to 200μM H2O2 (perox) for 2 h in the absence or the presence of 3MA. The LC3 II/actin ratio was calculated by densitometry of three independent experiments. Statistical significance between relevant treatments is indicated. (D) Western blotting of ser273-pAkt in SH-SY5Y cells exposed to 200μM H2O2 (perox) for 30 min in the absence or the presence of 3MA. The pAkt/Akt ratio was calculated by densitometry of three independent experiments. Statistical significance between relevant treatments is reported (n.s., not significant).
H2O2 Toxicity in SY-SY5Y Cells Follows Hyperactivation of Vps34/Beclin-1–Mediated Autophagy
We asked about the role of autophagy in SH-SY5Y cells undergoing apoptosis following a prolonged exposure (> 30 min) to H2O2. Based on chromatin condensation and fragmentation and on vacuolar LC3 positivity, apoptotic features in autophagic cells are apparent at 60 min, and become even more evident by 120 min, of incubation with H2O2 (Fig. 4A). To discriminate whether apoptosis occurred despite autophagy or because of autophagy cell death was measured in cells exposed for 2 h to H2O2 under autophagy inhibition. 3MA inhibited LC3-positive autophagy, in agreement with above data (Fig. 3C), and prevented the appearance of apoptotic figures (Fig. 4B). 3MA also abrogated annexin V–positive cell death in H2O2-treated cells (Fig. 4C). To further substantiate the protective activity of 3MA, we performed a clonogenic assay. Extensive cell death (∼90%) was observed in cultures exposed for as long as 4 h to H2O2, and this was completely abrogated by 3MA (Fig. 4D). After 40-h incubation in fresh medium, the cells pretreated with 3MA and exposed for 4 h to H2O2 duplicated with the same efficiency as their parental controls (Fig. 4D). Similarly, the cells not pretreated with 3MA that survived the peroxide treatment duplicated when switched in fresh medium. Cytofluorometry analysis of annexin V–positive cell death confirmed the full protection by 3MA toward a 4-h exposure to H2O2 (Fig. 4E).
FIG. 4.
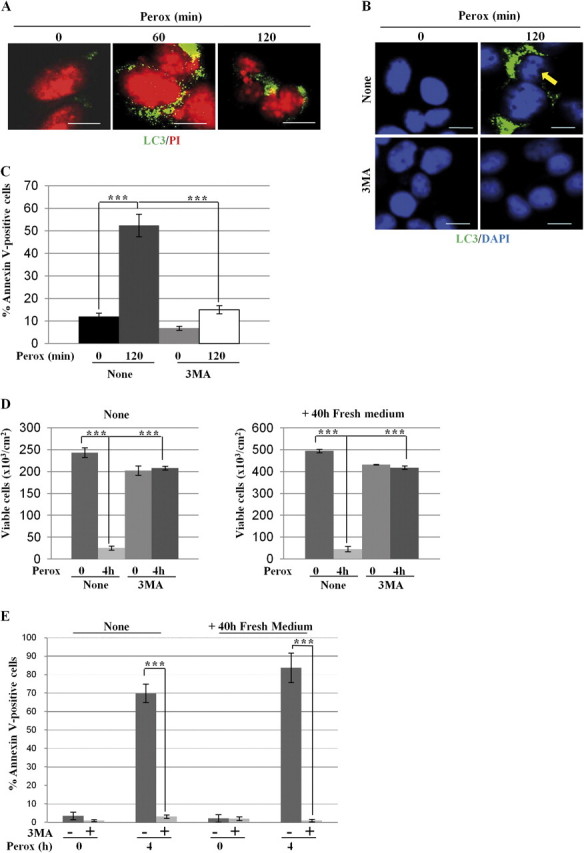
The Vps34 inhibitor 3-methyl adenine prevents H2O2 toxicity in SH-SY5Y cells. (A) SH-SY5Y cells plated on coverslips were exposed to 200μM H2O2 (perox) for 60 or 120 min and then fixed and processed for nuclei staining with propidium iodide (PI) and immunofluorescence detection of LC3-positive autophagosomes; 35 ± 5% of LC3-positive cells showed chromatin alteration typical of apoptotic cell death. (B) SH-SY5Y cells adherent on coverslips were preincubated or not with 3MA and exposed or not to 200μM H2O2 (perox) for 2 h. At the end, the cells were processed for nuclei staining with 4′,6-diamidino-2-phenylindole (DAPI) and immunofluorescence detection of LC3-positive autophagosomes. The arrow points to chromatin condensation and fragmentation in peroxide-treated cells. Bar = 10 μm. (C) Adherent cells preincubated or not with 3MA and exposed or not to 200μM H2O2 (perox) for 2 h. At the end, the cells were processed for cytofluorometry analysis of annexin V-FITC–labeled cells. Data (means ± SD) of four independent experiments. (D) Clonogenic assay to demonstrate the long-term protection by 3MA against peroxide stress. Two sets of cultures pretreated or not with 3MA were incubated for 4 h with or without H2O2 (perox), as indicated. At the end, the adherent viable cells of one set of cultures were counted. The cells of the other set of cultures were rinsed and cultivated for further 40 h in fresh medium and at the end the viable cells were counted. Cell density data (±SD) of two experiments in triple. (E) Cytofluorometric analysis of annexin V-FITC–positive cells of the cultures treated as above.
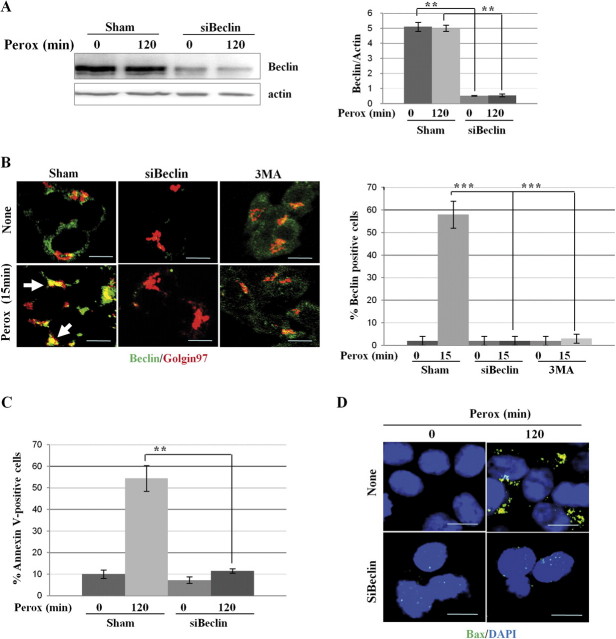
Beclin-1 is a critical interactor of Vps34/PI3k III in the autophagy pathway (Yang and Klionsky, 2010), though beclin-1–independent autophagy can be triggered by intracellular hydrogen peroxide (Wong et al., 2010). To see whether a beclin-1–independent autophagy pathway was involved in the cytotoxic mechanism of H2O2 in SH-SY5Y, beclin-1 expression was knocked down through specific siRNA transfection (Fig. 5A). The amount of beclin-1 protein in gene-silenced cells dropped to approximately 10% of the initial value (Fig. 5A). Sham- and beclin-1-siRNA–transfected cells were exposed to H2O2 for 15 min and then stained for immunofluorescence detection of beclin-1 and of Golgin-97, a Golgi complex–associated protein. The oxidant treatment rapidly induced the recruitment of beclin-1 into macroaggregates colocalizing with Golgin-97, consistent with a previous finding showing the presence of the beclin-1/Vps34 complex at the trans-Golgi network (Kihara et al., 2001) (Fig. 5B). These structures could be clearly detected in > 50% of the cell population and were practically absent in beclin-1–specific siRNA-transfected cells, confirming the efficient silencing of the autophagy protein (Fig. 5B). Beclin-1 knock down did not alter the localization of Golgin-97. In parallel cultures, the consequence of beclin-1 knock down in H2O2 toxicity was assessed by cytofluorometry evaluation of annexin V–positive cells and by immunofluorescence detection of activated bax. Contrary to sham-infected culture, in beclin-1 siRNA-transfected culture no annexin V–positive cell death (Fig. 5C) and no bax oligomerization (Fig. 5D) were observed after 2 h exposure to H2O2. The present data indicate that, in our experimental model, apoptosis induced by peroxide depends on and follows the activation of canonical autophagy, in accord with our previous findings (Castino et al., 2010). Further, the fact that the cells pretreated with 3MA or knocked down for beclin-1 could survive a 2–4 h exposure to H2O2 would imply that autophagy is not essential to guarantee cell survival.
FIG. 5.
Genetic silencing of beclin-1 prevents H2O2 toxicity in SH-SY5Y cells. (A) Western blotting showing the knock down (> 90%) of beclin-1 elicited by the specific siRNA (siBeclin). The filter was stripped and probed for actin as marker of protein loading. Similar results were obtained in two other experiments. Statistic of densitometry is reported. (B) Sham- and beclin-1–specific siRNA-transfected (siBeclin) cells adherent on coverslips were exposed or not to H2O2 for 15 min and then fixed and fluorescently double stained for beclin-1 and Golgin-97. Images (representative of three separate experiments) show that H2O2 induces the rapid polarization of beclin-1–positive aggregates in a Golgin-97–positive area. The experiment also confirms the efficient silencing of beclin-1 expression attained by the specific siRNA. Quantification of beclin aggregates–positive cells is indicated. (C) The extent of apoptotic cell death was assayed by flow cytometry analysis of annexin V-FITC positivity in sham- and beclin-1–specific siRNA-transfected cells exposed for 2 h to H2O2. Data from three independent experiments demonstrate that posttranscriptional silencing of beclin-1 protects the cells from H2O2 toxicity. Statistical significance between relevant treatments is indicated. (D) Fluorescence staining of bax and DAPI in sham- and beclin-1–specific siRNA-transfected (siBeclin) cells exposed or not to H2O2 for 120 min. Images (representative of three separate experiments) show that H2O2 induces bax activation and oligomerization in sham-transfected (∼50% of the population remained attached) not in siBeclin-transfected cells. Bar = 10 μm.
DCF-Sensitive ROS Triggers Autophagy Induced by H2O2: Inhibitory Effect of DFO
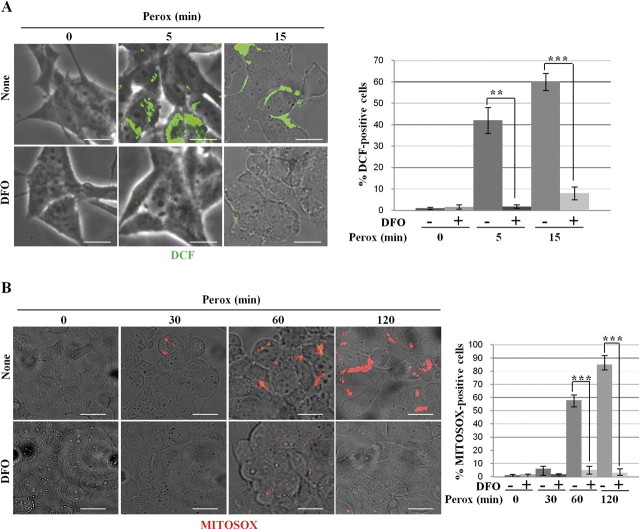
We next investigated the site and the type of H2O2-induced free radicals involved in the activation of autophagy. H2O2-induced oxidoradicals were first detected with the H2DCF-DA probe, which is sensitive for hydroxyl radicals (Bilski et al., 2002). DCF punctate fluorescence was soon detected (< 5 min) in approximately 40% of cell population exposed to H2O2, and this proportion increased up to 60% by 15 min (Fig. 6A). DFO is a specific lysosomal iron chelator that interrupts the Fenton reaction by sequestering ferric ions (Halliwell, 1989). DFO (1mM, 2 h preincubation) completely abolished the appearance of DCF fluorescence in H2O2-treated cells (Fig. 6A). Next, we introduced in the study another probe, mitochondria specific, for the detection of ROS in H2O2-treated cells. MitoSox is reportedly used to assay the presence of oxidant species, essentially the superoxide anion, within mitochondria (Kirkland et al., 2007). With this probe, no signs of oxidative stress–associated fluorescence were detected in cells exposed to H2O2 for up to 30 min (data not shown and Fig. 6B). MitoSox fluorescence became evident by 60 min of exposure to H2O2 (a time coincident with the appearance of apoptotic signs), and this was abrogated by pre-incubation with DFO (Fig. 6B).
FIG. 6.
Effect of DFO on the oxidation of H2DCF and MitoSox by H2O2 in SH-SY5Y cultures. Cells adherent on coverslips and preincubated with or without DFO as indicated were exposed for 0, 5, and 15 min to H2O2. Cells were preloaded with the hydroxyl-sensitive fluorescent probe H2DCF-DA. DCF oxidation was soon detected as fluorescent spots in cultures exposed to H2O2, but not if they had been preincubated with DFO. Quantification of DCF-positive cells is reported. (B) Cells adherent on coverslips and preincubated with or without DFO as indicated were exposed for up to 120 min to H2O2. Cells were preloaded with the superoxide anion-sensitive MitoSox fluorescent probe. In H2O2-treated cultures, MitoSox oxidation was faintly detectable at 60 min and more intensely detected at 120 min and was completely prevented by DFO. Quantification of MitoSox-positive cells is reported (consider that at 120 min > 50% of the cells detached). Images are representative of four independent experiments. Bar = 10 μm.
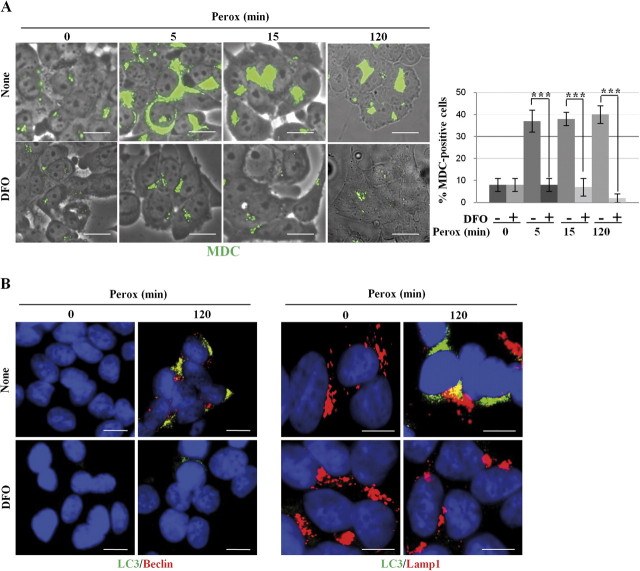
Taken together, these data indicate that on peroxide treatment lysosomal iron-dependent oxidation of H2DCF takes place very soon and precedes the oxidation of MitoSox. Finally, we assayed the ability of DFO to interfere with the induction of autophagy by peroxide. We employed the fluorescent dye MDC, which accumulates within mature acidic autophagic vacuoles, to monitor the dynamic induction of autophagy in cells preincubated with DFO and exposed to H2O2 for up to 2 h. Intense MDC fluorescence was soon (within 5 min) detectable in cells exposed to H2O2 (Fig. 7A), which agrees with the data obtained in GFP-LC3–transfected cells. MDC fluorescence was comparable to controls (i.e., faintly detectable) in cells exposed to H2O2 that had been preincubated with DFO (Fig. 7A). Similarly, 3MA greatly inhibited the peroxide-associated MDC staining (data not shown). To confirm these data, cells exposed to peroxide for 2 h were fixed and processed for immunofluorescence detection of specific autophagy markers. Again, the formation of Beclin-1–positive macro-aggregates and of LC3- and Lamp1-positive autophagic vacuoles was abolished by DFO (Fig. 7B). To assess the sequential relationship between lysosomal-iron–mediated generation of ROS and autophagy induced by H2O2, we tested the ability of DFO and of 3MA to inhibit the formation of ROS. Contrary to DFO, 3MA was unable to prevent the generation of DCF-sensitive ROS in cells exposed to peroxide for 15 min (Fig. 8A). In cells exposed to H2O2, DCF fluorescence soon appeared as discrete spots suggestive of organelle compartmentalized ROS localization. Consistently, DCF fluorescence largely (∼85%) colocalized with rhodamine-123, a fluorochrome that labels mitochondria (Fig. 8B). To conclude: (1) on H2O2 exposure different types of oxidant reactions take place in a temporally definite order, being H2DCF oxidized (at mitochondrial level) before MitoSox, and (2) generation of DCF-sensitive ROS (namely hydroxyl radicals) relies on the availability of free lysosomal ferric ions and precedes the induction of autophagy by peroxide.
FIG. 7.
DFO abrogates induction of autophagy by H2O2. (A) SH-SY5Y cells plated on coverslips were preincubated or not with DFO and exposed to H2O2 for the time indicated. The induction of autophagy was assessed with the fluorescent probe MDC, which mirrors the presence of acidic autophagolysosomes. Quantification of MDC-positive cells is reported (consider that at 120 min > 50% of the cells detached). (B) SH-SY5Y cells plated on coverslips were preincubated or not with DFO and exposed to H2O2 for 2 h, then fixed, and processed for immunofluorescence detection of the autophagy markers beclin-1 and LC3 and of the endosomal-lysosomal marker Lamp1. The images in panels (A) and (B) are representative of four independent experiments and document that DFO prevented the induction of autophagy by H2O2. Bar = 10 μm.
FIG. 8.
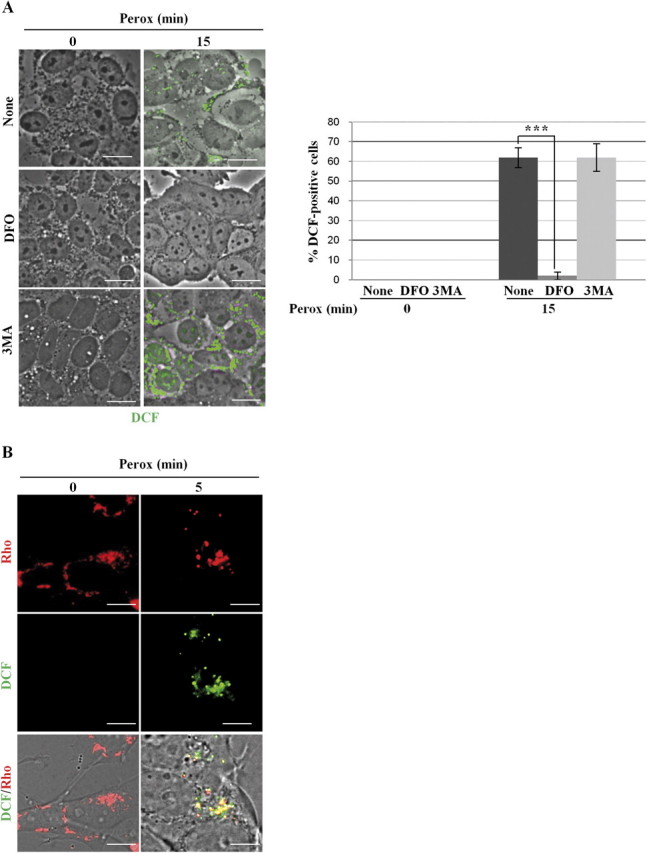
DFO, not 3-methyl adenine, prevents the mitochondrial generation of hydroxyl radicals. (A) SH-SY5Y cells cultivated on coverslips were preincubated or not with 3MA or DFO, exposed to 200μM H2O2 (perox) for 15 min, and then processed for detection of ROS with the H2DCF-DA probe. DCF-positive puncta are observed in peroxide-treated cells. DFO, not 3MA, could prevent DCF oxidation by H2O2. Quantification and statistical analysis of DCF-positive cells is reported. (B) SH-SY5Y cells cultivated on coverslips were preloaded with the H2DCF-DA probe, exposed to 200μM H2O2 (perox) for 5 min, labeled with Rhodamine 123 (Rho), and immediately observed under the fluorescence microscope. In peroxide-treated cells, DCF-positive and Rhodamine-positive puncta largely (> 85% puncta) colocalize. Images shown in these figure are representative of five independent experiments. Bar = 10 μm.
DFO Prevents Akt Dephosphorylation and Cell Toxicity by H2O2
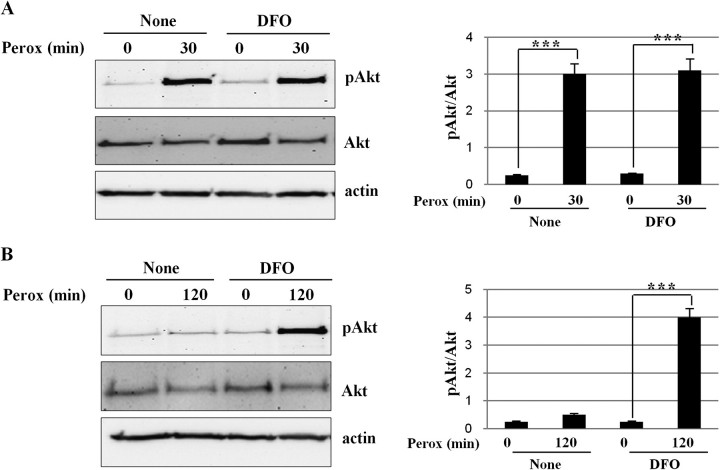
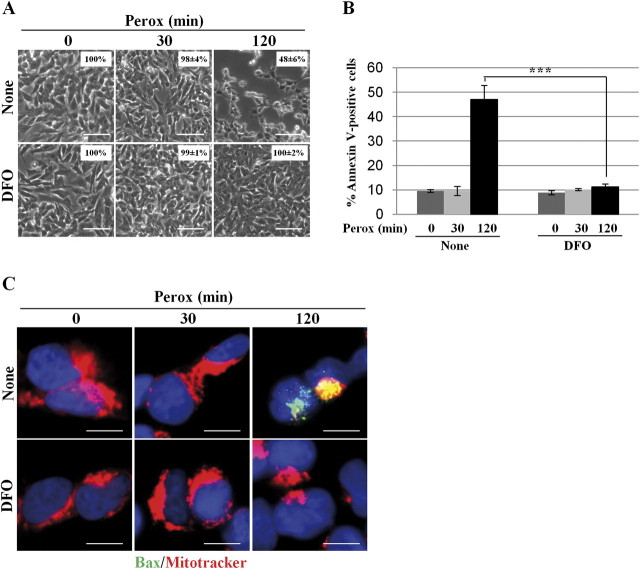
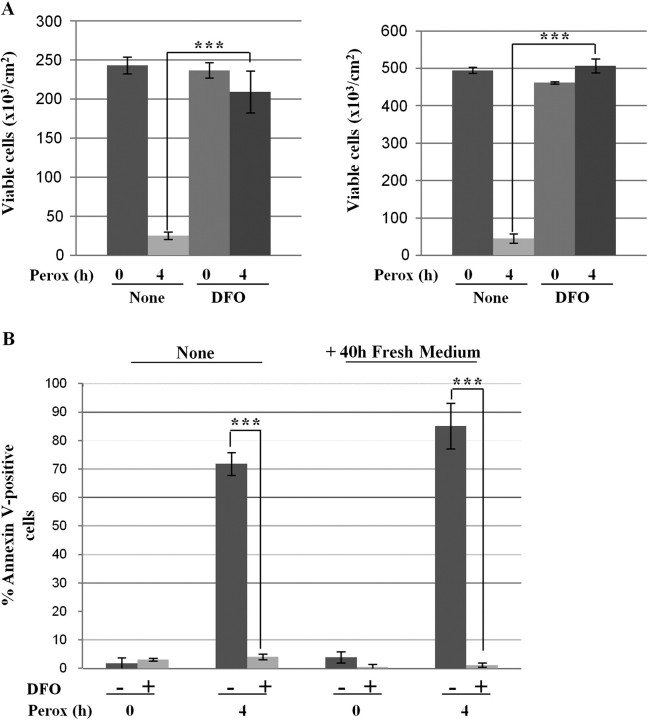
Finally, we evaluated the effect of DFO on the Akt survival pathway in peroxide-treated cells. The cells were preincubated with DFO and then exposed to H2O2 for 30 min and 2 h. DFO did not hamper Akt phosphorylation and completely protected phospho-Akt from subsequent dephosphorylation induced by H2O2 (Fig. 9). In addition, DFO completely prevented cell death, in accord with our previous finding (Castino et al., 2007) (Figs. 10A and 10B). Consistently, activation of bax and permeabilization of mitochondria induced by peroxide could be prevented by DFO (Fig. 10C). To further substantiate the protective activity of DFO, we performed a clonogenic assay. As for the experiment described in Figure 4D, the exposure to H2O2 was prolonged for 4 h in order to exacerbate cell toxicity, the medium was then refreshed, and the cells further incubated for 40 h in the absence of exogenous peroxide and DFO. At the end, cell loss and cell recovery were measured by cell counting and annexin V–positive apoptosis was assessed by cytofluorometry. After 4-h incubation with H2O2, cell loss amounted to > 85% and the cells that survived duplicated in the next 40 h in fresh medium (Fig. 11A). In DFO pretreated cultures, no cell loss was observed after 4-h incubation with H2O2 and cells duplicated in the next 40 h just as in controls (Fig. 11A). Annexin-V–positive cells death V amounted to approximately 70% after 4-h incubation with H2O2 and slightly increased in the next 40-h incubation in fresh medium, whereas no annexin V–positive cell death was detected in cultures pretreated with DFO (Fig. 11B).
FIG. 9.
Effect of DFO on the phosphorylation/dephosphorylation of Akt induced by H2O2. SH-SY5Y cells preincubated or not with DFO and exposed to H2O2 for the time indicated. At the end of the incubation, the cells were collected and homogenized in lysis buffer for western blotting analysis. The filter was subsequently probed, stripped, and reprobed for ser473-phosphorylated Akt, total Akt, and actin. Akt is up-phosphorylated within 30 min (A) and phosphorylation decays by 120 min of exposure to H2O2 (B), but it is maintained in cells that had been preincubated with DFO. These experiments have been performed three times with reproducible results (one representative western blotting is shown). The densitometry of the bands (pAkt/Akt ratio) and statistical significance between relevant treatments is reported.
FIG. 10.
DFO inhibits bax-mediated cell death induced by H2O2. (A) SH-SY5Y cells were preincubated or not with DFO and exposed to 200μM H2O2 (perox) for 30 and 120 min. The monolayer was photographed under a phase-contrast microscope to document cell loss. The images show that DFO could prevent cell loss induced by H2O2 at 2 h. (The percentage of adherent cells is reported in the inset.) (B) SH-SY5Y cells were preincubated or not with DFO and exposed to 200μM H2O2 (perox) for 30 and 120 min. The cells were then processed for annexin V-FITC labeling and analyzed by cytofluorometry. Data represent the mean ± SD of three independent experiments in triplicate. Statistical significance between relevant treatments is reported. (C) SH-SY5Y cells adherent on coverslips and preincubated or not with DFO were incubated with 200μM H2O2 (perox) for 30 and 120 min. Cells were then processed for mitotracker and immunofluorescence staining of activated bax. At 2 h of incubation, H2O2 provoked (in about 50% of the cells) the formation of bax macroaggregates and concomitant loss of mitotracker labeling, suggestive of activation of the intrinsic death pathway. This effect was completely abolished by DFO. Images shown in this figure are representative of three independent experiments. Bar = 10 μm.
FIG. 11.
DFO protection against oxidative stress persists for long time. Clonogenic assay to demonstrate the long-term protection by DFO against peroxide stress. Two sets of cultures pretreated or not with DFO were incubated for 4 h with or without H2O2 (perox), as indicated. (A) At the end, the adherent viable cells of one set of cultures were counted. The cells of the other set of cultures were rinsed and cultivated for further 40 h in fresh medium, and at the end the viable cells were counted. Cell density data (±SD) of two experiments in triple (note that controls are the same as in Fig. 3D). (B) Cytofluorometric analysis of annexin V-FITC–positive cells of the cultures treated as above. Statistical significance between relevant treatments is reported.
Together with previous data, these observations further confirm that induction of autophagy and of autophagy-mediated apoptosis by peroxide is dictated by ROS, whose formation at mitochondrial level strictly depends on the availability of free redox-active iron present in endosomes and lysosomes.
DISCUSSION
The main findings of the present study are schematically reported in Figure 12. In our previous works, we have shown that bax-mediated apoptosis induced by peroxide in SH-SY5Y cells followed induction of autophagy (Castino et al., 2010). In this work, we demonstrate that lysosomal free iron plays a determinant role in the toxicity of H2O2 through the generation of ROS that trigger and sustain autophagy. Induction of LC3-positive vacuoles and generation of DCF-sensitive ROS followed the same kinetics in peroxide-treated cells. The lysosomal iron chelator DFO prevented both these events, whereas 3MA, though fully preventing the accumulation of LC3-positive autophagosomes, did not impede the generation of ROS by H2O2. These data indicate that autophagy strictly depends on and follows lysosomal iron-mediated generation of ROS.
FIG. 12.
Schematic representation of the results. H2O2 triggers two parallel and independent pathways, one leading to induction of autophagy, the other to transient Akt phosphorylation. Induction of autophagy depends on the mitochondrial generation of hydroxyl radicals, which arise from Fenton reaction between H2O2 and redox-active iron. The mTOR pathway is inactive in oxidative-stressed cells. Akt phosphorylation does not preclude autophagy but prevents apoptosis in H2O2-stressed cells. However, prolonged incubation in the presence of H2O2 leads to Akt dephosphorylation and autophagy-dependent cell death. DFO, by sequestering iron within lysosomes, prevents the prompt formation of hydroxyl radicals (as well as of superoxide anion, which appears later) and, consequently, of autophagy and apoptosis induced by H2O2. DFO also prevents Akt dephosphorylation. 3MA and siRNA-beclin-1 prevents autophagy and cell death.
H2O2 is at the same time a strong stimulus for autophagy, a salvage cellular response, and a lethal toxicant (Castino et al., 2010; Choi et al., 2010; Pivtoraiko et al., 2009). H2O2 induces autophagy through the sequential activation of ATM, AMPk, and TSC2, which finally inhibits the rapamycin-sensitive mTOR complex 1 (Alexander et al., 2010). This pathway is, however, counteracted by Akt, which inactivates TSC2 and allows mTOR to repress autophagy (Arico et al., 2001). H2O2 induces a transient phosphorylation of Akt, which contributes to the survival of treated cells, followed by dephosphorylation and degradation of Akt (Martin et al., 2002; Murata et al., 2003). A similar kinetic of Akt activation and inactivation was observed in the present experimental model. Strikingly, autophagy was allowed in spite of concomitant Akt activation. However, the mTOR-p70S6k pathway was inactivated by H2O2, as shown by the complete dephosphorylation of the downstream target ribosomal protein S6. In certain situations of stress, the activation of Akt has been shown to repress protective autophagy and to precipitate cell death (Castino et al., 2008b). Here we show that oxidative stress–induced autophagy plays a dual role, being protective in the early phase of intoxication and promoting apoptosis once the intoxication has passed the point of no return. A short (up to 30 min) exposure to H2O2 was not toxic and did not determine irremediable damages because the cells rescued cell proliferation ability if switched into fresh H2O2-free medium. At this time, the Akt pathway was maximally activated along with autophagy, suggesting a cooperative protective activity of these pathways. However, although inhibition of Akt exacerbated bax-mediated apoptosis in H2O2-treated cells, inhibition of autophagy did not accelerated, rather protected from cell death. Thus, autophagy, though probably cooperating with the Akt pro-survival pathway, apparently is not determinant for cell viability in the initial phase of H2O2 exposure. The role played by Akt in the cross talk between autophagy and apoptosis in oxidative stressed cells likely depends on the concentration of H2O2 used and the time window of observation. In several studies, H2O2 toxicity associated with induction of autophagy has been analyzed after a prolonged (> 24 h) treatment with nonphysiologically relevant concentrations (1mM) of H2O2 (Chen et al., 2008, 2009). However, the prosurvival activity of Akt requires the nuclear translocation of the protein phosphorylated at both ser473 and thr308 sites (Antico Arciuch et al., 2009; Sarbassov et al., 2005), and the prolonged exposure to > 250μM H2O2 compromises the PDK1-mediated phosphorylation at thr308 and subsequent mitochondria to nucleus translocation of ser473-pAkt (Antico Arciuch et al., 2009).
Our data suggest that H2O2 activated Akt and autophagy via two independent and parallel pathways. In fact, DFO inhibited both the mitochondrial production of hydroxyl radicals and autophagy but did not prevent Akt phosphorylation, indicating that transient H2O2-induced phosphorylation of Akt does not rely on HO· radicals. We propose that cytosolic H2O2 directly activates mTORC2, the ser473 Akt phosphorylating kinase (Sarbassov et al., 2005). DFO also prevented Akt dephosphorylation. It has been shown that the prolonged (> 60 min) exposure to H2O2 results in the intermolecular association of pAkt with the inactivating phosphatase PP2A and that this interaction is favored in the presence of divalent metals such as Cd2+ (Murata et al., 2003) Also, it has been proven that Fe2+ acts as a cofactor activator of PP2A (Yu, 1998). The preincubation with DFO likely depleted the cytoplasm, and probably other compartments, of iron (Doulias et al., 2003), and as a result PP2A remained in the inactive state.
We further investigated on the nature and site of production of ROS involved in autophagy. Some discrepancies exist on the type and the time of ROS production and onset of autophagy by exogenous H2O2 between this study and other studies from the literature. In most cases, however, ROS and autophagy were detected later (> 6 h) and with > 0.5mM H2O2 (Chen et al., 2008, 2009), whereas here we show the induction of ROS and of autophagy as early as 5 min after 0.2mM H2O2 challenge. We employed two different probes to detect ROS: H2DCF-DA and MitoSox. Once entered the cell, H2DCF-DA is rapidly de-esterified and H2DCF accumulates in the cytoplasm and in the mitochondrial intermembrane space (Karlsson et al., 2010). In fact, being hydrophilic, H2DCF cannot enter membrane-sealed compartments but the fenestrated outer membrane of mitochondria. H2O2 cannot directly oxidize H2DCF. This may occur either through a Fenton-like reaction (i.e., H2O2 plus Fe++) or by cytochrome c at mitochondrial level (Karlsson et al., 2010). MitoSox is a mitochondria-targeted modified hydroethidine (Robinson et al., 2006) that becomes fluorescent once it is oxidized (essentially) by superoxide anion (Kirkland et al., 2007). DCF fluorescence, which mirrors hydroxyl radicals, was basally absent and became evident within 5 min of H2O2 exposure, showing at this time-point a punctate staining colocalizing with rhodamine, a mitochondria tracer. This finding is consistent with the notion that mitochondria are the source of autophagy-inducing ROS (Scherz-Shouval et al., 2007). By contrast, MitoSox fluorescence, which mirrors superoxide anion, became evident later (> 30 min), in coincidence with the appearance of apoptotic signs. It is noticed that HeLa cells exposed to 1mM H2O2 for 24 h showed the presence of superoxide anion not of hydroxyl radical (Chen et al., 2009). This is, however, not surprising considering that hydroxyl radicals are extremely reactive and short-lived radicals. DFO, a high-affinity ferric ion chelator produced by Streptomyces pilosus, acts exclusively within the endosomal-lysosomal compartment (Kurz et al., 2004). By binding Fe3+, DFO prevents the reconstitution of Fe2+ required for the production of hydroxyl radicals. The present data suggest that H2DCF is primarily oxidized within mitochondria by ROS (namely HO·) arising from a Fenton reaction between exogenous H2O2 and lysosomal-derived ferrous iron. Ferrous iron can be trafficked from lysosomes to mitochondria (Uchiyama et al., 2008). It is conceivable that lysosomes regularly supply the mitochondria with chelatable iron and that in our conditions the prolonged incubation with DFO interrupted this flux (Tenopoulou et al., 2005). Consistent with this interpretation, 1mM DFO was shown to rapidly and efficiently deplete the cytoplasm of iron (Doulias et al., 2003).
In conclusion, we have demonstrated that in the presence of H2O2, lysosomal labile iron is needed for the generation of free radicals (HO·) within mitochondria and that these radicals rapidly trigger a PI3k III-beclin-1 autophagy pathway. Persistent (> 30 min) exposure to H2O2 leads the cells to autophagy-dependent apoptosis. DFO prevents the generation of free radicals and induction of autophagy and finally protects from H2O2 injury. We also show that H2O2-induced phosphorylation of Akt occurs also in the presence of DFO, meaning independency from hydroxyl radicals. Finally, we show that DFO prevents the subsequent dephosphorylation of Akt, consistent with a direct involvement of iron in the activation of PP2A (Yu, 1998). It has been reported that following ischemia-reperfusion, a transient (15–30 min) peak of 100–175μM H2O2 occurs in striatal cerebral area, which causes dopaminergic neuron cell loss (Hyslop et al., 1995). In vivo, the toxicity due to H2O2 is exacerbated by the Fe2+ that is liberated in the microenvironmental milieu in association with anoxia (Castellanos et al., 2002). In this regard, the present findings provide a mechanistic rationale for the neuroprotective activity of DFO in neurons exposed to H2O2-generating metabolic stresses (Zhao and Rempe, 2011).
FUNDING
Fondazione CRT di Torino, Consorzio Interuniversitario Biotecnologie (Trieste, Italy); Regione Piemonte (Ricerca Sanitaria Finalizzata, Torino, Italy); Compagnia San Paolo di Torino (progetto Neuroscienze 2008.2395); Comoli-Ferrari & C. (Novara).
Acknowledgments
The authors wish to thank Prof. U.T. Brunk (Linköping, Sweden) and Prof. E. Albano (Novara, Italy) for helpful discussion.
References
- Alexander A, Cai SL, Kim J, Nanez A, Sahin M, MacLean KH, Inoki K, Guan KL, Shen J, Person MD, et al. ATM signals to TSC2 in the cytoplasm to regulate mTORC1 in response to ROS. Proc. Natl. Acad. Sci. U.S.A. 2010;107:4153–4158. doi: 10.1073/pnas.0913860107. [DOI] [PMC free article] [PubMed] [Google Scholar]
- Antico Arciuch VG, Galli S, Franco MC, Lam PY, Cadenas E, Carreras MC, Poderoso JJ. Akt1 intramitochondrial cycling is a crucial step in the redox modulation of cell cycle progression. PLoS One. 2009;4:e7523. doi: 10.1371/journal.pone.0007523. [DOI] [PMC free article] [PubMed] [Google Scholar]
- Arico S, Petiot A, Bauvy C, Dubbelhuis PF, Meijer AJ, Codogno P, Ogier-Denis E. The tumor suppressor PTEN positively regulates macroautophagy by inhibiting the phosphatidylinositol 3-kinase/protein kinase B pathway. J. Biol. Chem. 2001;276:35243–35246. doi: 10.1074/jbc.C100319200. [DOI] [PubMed] [Google Scholar]
- Arsham AM, Neufeld TP. Thinking globally and acting locally with TOR. Curr. Opin. Cell. Biol. 2006;18:589–597. doi: 10.1016/j.ceb.2006.09.005. [DOI] [PubMed] [Google Scholar]
- Bilski P, Belanger AG, Chignell CF. Photosensitized oxidation of 2′,7′-dichlorofluorescin: Singlet oxygen does not contribute to the formation of fluorescent oxidation product 2′,7′-dichlorofluorescein. Free Radic. Biol. Med. 2002;33:938–946. doi: 10.1016/s0891-5849(02)00982-6. [DOI] [PubMed] [Google Scholar]
- Brunk UT, Jones CB, Sohal RS. A novel hypothesis of lipofuscinogenesis and cellular aging based on interactions between oxidative stress and autophagocytosis. Mutat. Res. 1992;275:395–403. doi: 10.1016/0921-8734(92)90042-n. [DOI] [PubMed] [Google Scholar]
- Castellanos M, Puig N, Carbonell T, Castillo J, Martinez J, Rama R, Dávalos A. Iron intake increases infarct volume after permanent middle cerebral artery occlusion in rats. Brain Res. 2002;952:1–6. doi: 10.1016/s0006-8993(02)03179-7. [DOI] [PubMed] [Google Scholar]
- Castino R, Bellio N, Follo C, Murphy D, Isidoro C. Inhibition of PI3k class III-dependent autophagy prevents apoptosis and necrosis by oxidative stress in dopaminergic neuroblastoma cells. Toxicol. Sci. 2010;117:152–162. doi: 10.1093/toxsci/kfq170. [DOI] [PubMed] [Google Scholar]
- Castino R, Bellio N, Nicotra G, Follo C, Trincheri NF, Isidoro C. Cathepsin D-Bax death pathway in oxidative stressed neuroblastoma cells. Free Radic. Biol. Med. 2007;42:1305–1316. doi: 10.1016/j.freeradbiomed.2006.12.030. [DOI] [PubMed] [Google Scholar]
- Castino R, Lazzeri G, Lenzi P, Bellio N, Follo C, Ferrucci M, Fornai F, Isidoro C. Suppression of autophagy precipitates neuronal cell death following low doses of methamphetamine. J. Neurochem. 2008a;106:1426–1439. doi: 10.1111/j.1471-4159.2008.05488.x. [DOI] [PubMed] [Google Scholar]
- Castino R, Thepparit C, Bellio N, Murphy D, Isidoro C. Akt induces apoptosis in neuroblastoma cells expressing a C98X vasopressin mutant following autophagy suppression. J. Neuroendocrinol. 2008b;20:1165–1175. doi: 10.1111/j.1365-2826.2008.01769.x. [DOI] [PubMed] [Google Scholar]
- Chen Y, Azad MB, Gibson SB. Superoxide is the major reactive oxygen species regulating autophagy. Cell Death Differ. 2009;16:1040–1052. doi: 10.1038/cdd.2009.49. [DOI] [PubMed] [Google Scholar]
- Chen Y, McMillian-Ward E, Kong J, Israels SJ, Gibson SB. Oxidative stress induces autophagic cell death independent of apoptosis in transformed and cancer cells. Cell Death Diff. 2008;15:171–182. doi: 10.1038/sj.cdd.4402233. [DOI] [PubMed] [Google Scholar]
- Choi KC, Kim SH, Ha JY, Kim ST, Son JH. A novel mTOR activating protein protects dopamine neurons against oxidative stress by repressing autophagy related cell death. J. Neurochem. 2010;112:366–376. doi: 10.1111/j.1471-4159.2009.06463.x. [DOI] [PubMed] [Google Scholar]
- Degtyarev M, De Mazière A, Orr C, Lin J, Lee BB, Tien JY, Prior WW, van Dijk S, Wu H, Gray DC, et al. Akt inhibition promotes autophagy and sensitizes PTEN-null tumors to lysosomotropic agents. J. Cell Biol. 2008;183:101–116. doi: 10.1083/jcb.200801099. [DOI] [PMC free article] [PubMed] [Google Scholar]
- Doulias PT, Christoforidis S, Brunk UT, Galaris D. Endosomal and lysosomal effects of desferrioxamine: Protection of HeLa cells from hydrogen peroxide-induced DNA damage and induction of cell-cycle arrest. Free Radic. Biol. Med. 2003;35:719–728. doi: 10.1016/s0891-5849(03)00396-4. [DOI] [PubMed] [Google Scholar]
- Groeger G, Quiney C, Cotter TG. Hydrogen peroxide as a cell-survival signaling molecule. Antioxid. Redox Signal. 2009;11:2655–2671. doi: 10.1089/ars.2009.2728. [DOI] [PubMed] [Google Scholar]
- Halliwell B. Protection against tissue damage in vivo by desferrioxamine: what is its mechanism of action? Free Radic. Biol. Med. 1989;7:645–651. doi: 10.1016/0891-5849(89)90145-7. [DOI] [PubMed] [Google Scholar]
- Hatcher JM, Richardson JR, Guillot TS, McCormack AL, Di Monte DA, Jones DP, Pennell KD, Miller GW. Dieldrin exposure induces oxidative damage in the mouse nigrostriatal dopamine system. Exp. Neurol. 2007;204:619–630. doi: 10.1016/j.expneurol.2006.12.020. [DOI] [PMC free article] [PubMed] [Google Scholar]
- Hyslop PA, Zhang Z, Pearson DV, Phebus LA. Measurement of striatal H2O2 by microdialysis following global forebrain ischemia and reperfusion in the rat: correlation with the cytotoxic potential of H2O2 in vitro. Brain Res. 1995;671:181–186. doi: 10.1016/0006-8993(94)01291-o. [DOI] [PubMed] [Google Scholar]
- Isidoro C, Biagioni F, Giorgi FS, Fulceri F, Paparelli A, Fornai F. The role of autophagy on the survival of dopamine neurons. Curr. Top. Med. Chem. 2009;9:869–879. [PubMed] [Google Scholar]
- Kabeya Y, Mizushima N, Ueno T, Yamamoto A, Kirisako T, Noda T, Kominami E, Ohsumi Y, Yoshimori T. LC3, a mammalian homologue of yeast Apg8p, is localized in autophagosome membranes after processing. EMBO J. 2000;19:5720–5728. doi: 10.1093/emboj/19.21.5720. [DOI] [PMC free article] [PubMed] [Google Scholar]
- Karlsson M, Kurz T, Brunk UT, Nilsson SE, Frennesson CI. What does the commonly used DCF test for oxidative stress really show? Biochem. J. 2010;428:183–190. doi: 10.1042/BJ20100208. [DOI] [PubMed] [Google Scholar]
- Kawai A, Uchiyama H, Takano S, Nakamura N, Ohkuma S. Autophagosome-lysosome fusion depends on the pH in acidic compartments in CHO cells. Autophagy. 2007;3:154–157. doi: 10.4161/auto.3634. [DOI] [PubMed] [Google Scholar]
- Kidane TZ, Sauble E, Linder MC. Release of iron from ferritin requires lysosomal activity. Am. J. Physiol. Cell Physiol. 2006;291:C445–C455. doi: 10.1152/ajpcell.00505.2005. [DOI] [PubMed] [Google Scholar]
- Kihara A, Kabeya Y, Ohsumi Y, Yoshimori T. Beclin-phosphatidylinositol 3-kinase complex functions at the trans-Golgi network. EMBO Rep. 2001;2:330–335. doi: 10.1093/embo-reports/kve061. [DOI] [PMC free article] [PubMed] [Google Scholar]
- Kirkland RA, Saavedra GM, Franklin JL. Rapid activation of antioxidant defenses by nerve growth factor suppresses reactive oxygen species during neuronal apoptosis: evidence for a role in cytochrome c redistribution. J. Neurosci. 2007;27:11315–11326. doi: 10.1523/JNEUROSCI.3590-07.2007. [DOI] [PMC free article] [PubMed] [Google Scholar]
- Kroemer G, Levine B. Autophagic cell death: the story of a misnomer. Nat. Rev. Mol. Cell Biol. 2008;9:1004–1010. doi: 10.1038/nrm2527. [DOI] [PMC free article] [PubMed] [Google Scholar]
- Kurz T, Leake A, Von Zglinicki T, Brunk UT. Relocalized redox-active lysosoma iron is an important mediator of oxidative-stress-induced DNA damage. Biochem. J. 2004;378:1039–1045. doi: 10.1042/BJ20031029. [DOI] [PMC free article] [PubMed] [Google Scholar]
- Kurz T, Terman A, Gustafsson B, Brunk UT. Lysosomes in iron metabolism, ageing and apoptosis. Histochem. Cell Biol. 2008;129:389–406. doi: 10.1007/s00418-008-0394-y. [DOI] [PMC free article] [PubMed] [Google Scholar]
- Martin D, Salinas M, Fujita N, Tsuruo T, Cuadrado A. Ceramide and reactive oxygen species generated by H2O2 induce caspase-3-independent degradation of Akt/protein kinase B. J. Biol. Chem. 2002;277:42943–42952. doi: 10.1074/jbc.M201070200. [DOI] [PubMed] [Google Scholar]
- McCormack AL, Atienza JG, Johnston LC, Andersen JK, Vu S, Di Monte DA. Role of oxidative stress in paraquat-induced dopaminergic cell degeneration. J. Neurochem. 2005;93:1030–1037. doi: 10.1111/j.1471-4159.2005.03088.x. [DOI] [PubMed] [Google Scholar]
- Murata H, Ihara Y, Nakamura H, Yodoi J, Sumikawa K, Kondo T. Glutaredoxin exerts an antiapoptotic effect by regulating the redox state of Akt. J. Biol. Chem. 2003;278:50226–50233. doi: 10.1074/jbc.M310171200. [DOI] [PubMed] [Google Scholar]
- Persson HL, Yu Z, Tirosh O, Eaton JW, Brunk UT. Prevention of oxidant-induced cell death by lysosomotropic iron chelators. Free Radic. Biol. Med. 2003;34:1295–1305. doi: 10.1016/s0891-5849(03)00106-0. [DOI] [PubMed] [Google Scholar]
- Pivtoraiko VN, Stone SL, Roth KA, Shacka JJ. Oxidative stress and autophagy in the regulation of lysosome-dependent neuron death. Antioxid. Redox Signal. 2009;11:481–496. doi: 10.1089/ars.2008.2263. [DOI] [PMC free article] [PubMed] [Google Scholar]
- Roberts RA, Laskin DL, Smith CV, Robertson FM, Allen EM, Doorn JA, Slikker W. Nitrative and oxidative stress in toxicology and disease. Toxicol. Sci. 2009;112:4–16. doi: 10.1093/toxsci/kfp179. [DOI] [PMC free article] [PubMed] [Google Scholar]
- Robinson KM, Janes MS, Pehar M, Monette JS, Ross MF, Hagen TM, Murphy MP, Beckman JS. Selective fluorescent imaging of superoxide in vivo using ethidium-based probes. Proc. Natl. Acad. Sci. U.S.A. 2006;103:15038–15043. doi: 10.1073/pnas.0601945103. [DOI] [PMC free article] [PubMed] [Google Scholar]
- Sadidi M, Lentz SI, Feldman EL. Hydrogen peroxide-induced Akt phosphorylation regulates Bax activation. Biochimie. 2009;91:577–585. doi: 10.1016/j.biochi.2009.01.010. [DOI] [PMC free article] [PubMed] [Google Scholar]
- Sarbassov DD, Guertin DA, Ali SM, Sabatini DM. Phosphorylation and regulation of Akt/PKB by the rictor-mTOR complex. Science. 2005;307:1098–1101. doi: 10.1126/science.1106148. [DOI] [PubMed] [Google Scholar]
- Scherz-Shouval R, Shvets E, Fass E, Shorer H, Gil L, Elazar Z. Reactive oxygen species are essential for autophagy and specifically regulate the activity of Atg4. EMBO J. 2007;26:1749–1760. doi: 10.1038/sj.emboj.7601623. [DOI] [PMC free article] [PubMed] [Google Scholar]
- Seglen PO, Gordon PB. 3-Methyladenine: specific inhibitor of autophagic/lysosomal protein degradation in isolated rat hepatocytes. Proc. Natl. Acad. Sci. U.S.A. 1982;79:1889–1892. doi: 10.1073/pnas.79.6.1889. [DOI] [PMC free article] [PubMed] [Google Scholar]
- Simon HU, Haj-Yehia A, Levi-Schaffer F. Role of reactive oxygen species (ROS) in apoptosis induction. Apoptosis. 2000;5:415–418. doi: 10.1023/a:1009616228304. [DOI] [PubMed] [Google Scholar]
- Slemmer JE, Shacka JJ, Sweeney MI, Weber JT. Antioxidants and free radical scavengers for the treatment of stroke, traumatic brain injury and aging. Curr. Med. Chem. 2008;15:404–414. doi: 10.2174/092986708783497337. [DOI] [PubMed] [Google Scholar]
- Tato I, Bartrons R, Ventura F, Rosa JL. Amino acids activate mammalian target of rapamycin complex 2 (mTORC2) via PI3K/Akt signaling. J. Biol. Chem. 2011;286:6128–6142. doi: 10.1074/jbc.M110.166991. [DOI] [PMC free article] [PubMed] [Google Scholar]
- Tenopoulou M, Doulias PT, Barbouti A, Brunk U, Galaris D. Role of compartmentalized redox-active iron in hydrogen peroxide-induced DNA damage and apoptosis. Biochem. J. 2005;387:703–710. doi: 10.1042/BJ20041650. [DOI] [PMC free article] [PubMed] [Google Scholar]
- Thompson JE, Thompson CB. Putting the rap on Akt. J. Clin. Oncol. 2004;22:4217–4226. doi: 10.1200/JCO.2004.01.103. [DOI] [PubMed] [Google Scholar]
- Trincheri NF, Follo C, Nicotra G, Peracchio C, Castino R, Isidoro C. Resveratrol-induced apoptosis depends on the lipid kinase activity of Vps34 and on the formation of autophagolysosomes. Carcinogenesis. 2008;29:381–389. doi: 10.1093/carcin/bgm271. [DOI] [PubMed] [Google Scholar]
- Uchiyama A, Kim JS, Kon K, Jaeschke H, Ikejima K, Watanabe S, Lemasters JJ. Translocation of iron from lysosomes into mitochondria is a key event during oxidative stress-induced hepatocellular injury. Hepatology. 2008;48:1644–1654. doi: 10.1002/hep.22498. [DOI] [PMC free article] [PubMed] [Google Scholar]
- Wong CH, Iskandar KB, Yadav SK, Hirpara JL, Loh T, Pervaiz S. Simultaneous induction of non-canonical autophagy and apoptosis in cancer cells by ROS-dependent ERK and JNK activation. PLoS One. 2010;5:e9996. doi: 10.1371/journal.pone.0009996. [DOI] [PMC free article] [PubMed] [Google Scholar]
- Wu, Y. T., Tan, H. L., Shui, G., Bauvy, C., Huang, Q., Wenk, M. R., Ong, C. N., Codogno, P., and Shen, H. M. (2010). Dual role of 3-methyladenine in modulation of autophagy via different temporal patterns of inhibition on class I and III phosphoinositide 3-kinase. J. Biol. Chem.285, 10850–10861. [DOI] [PMC free article] [PubMed]
- Yamato M, Kudo W, Shiba T, Yamada KI, Watanabe T, Utsumi H. Determination of reactive oxygen species associated with the degeneration of dopaminergic neurons during dopamine metabolism. Free Radic. Res. 2010;44:249–257. doi: 10.3109/10715760903456084. [DOI] [PubMed] [Google Scholar]
- Yang Z, Klionsky DJ. Mammalian autophagy: core molecular machinery and signaling regulation. Curr. Opin. Cell Biol. 2010;22:124–131. doi: 10.1016/j.ceb.2009.11.014. [DOI] [PMC free article] [PubMed] [Google Scholar]
- Yu JS. Activation of protein phosphatase 2A by the Fe2+/ascorbate system. J. Biochem. 1998;124:225–230. doi: 10.1093/oxfordjournals.jbchem.a022084. [DOI] [PubMed] [Google Scholar]
- Yu Z, Persson HL, Eaton JW, Brunk UT. Intralysosomal iron: a major determinant of oxidant-induced cell death. Free Radic. Biol. Med. 2003;34:1243–1252. doi: 10.1016/s0891-5849(03)00109-6. [DOI] [PubMed] [Google Scholar]
- Zhao Y, Rempe DA. Prophylactic neuroprotection against stroke: low-dose, prolonged treatment with deferoxamine or deferasirox establishes prolonged neuroprotection independent of HIF-1 function. J. Cereb. Blood Flow Metab. 2011;31:1412–1423. doi: 10.1038/jcbfm.2010.230. [DOI] [PMC free article] [PubMed] [Google Scholar]


