

Abstract
Collective motion, where large numbers of individuals move synchronously together, is achieved when individuals adopt interaction rules that determine how they respond to their neighbors’ movements and positions. These rules determine how group-living animals move, make decisions, and transmit information between individuals. Nonetheless, few studies have explicitly determined these interaction rules in moving groups, and very little is known about the interaction rules of fish. Here, we identify three key rules for the social interactions of mosquitofish (Gambusia holbrooki): (i) Attraction forces are important in maintaining group cohesion, while we find only weak evidence that fish align with their neighbor’s orientation; (ii) repulsion is mediated principally by changes in speed; (iii) although the positions and directions of all shoal members are highly correlated, individuals only respond to their single nearest neighbor. The last two of these rules are different from the classical models of collective animal motion, raising new questions about how fish and other animals self-organize on the move.
Keywords: collective animal behavior, fish shoals, group motion, self-propelled particles, self-organization
Collective motion of animal groups occurs when multiple individuals move synchronously, producing large scale “flocking” patterns (1–5). Numerous models have been developed to describe patterns of collective motion in terms of interactions between individuals (6–9). These simulation models usually assume that individuals move at a constant speed and their interactions are mediated through direction changes (1). Often these models use zonal rules, where individuals move away from neighbors at close distances and align and/or move toward neighbors at greater distances. Interactions can be with either all neighbors within some zone (7) or with a set of n nearest neighbors (10). These and other models have succeeded in reproducing qualitatively similar patterns to those seen in the collective motion of animal groups in nature.
It remains unclear, however, whether the interaction rules implemented in models are the ones used by animals. Indeed, many collective motion patterns observed in nature can be simulated by models using very different interaction rules (1). We are only now beginning to accumulate evidence about which interaction rules are used. There has been recent identification of zones of repulsion and alignment in surf scoters (11). The structure of starling flocks is consistent with topological interactions between the birds (10). Homing pigeons appear to have hierarchical interactions such that birds with higher route-following fidelity act as leaders (12–15). Partridge showed that lateral line and vision are both important in producing directional alignment in Gadid fish (16). Nonetheless, there remain a large number of open questions about the interactions of fish. For example, do fish adopt attraction and alignment within distinct zones as purported in most models? How many neighbors do fish interact with? Do fish swim at more or less the same speed, with changes in angle mediating a fish’s response to conspecifics? Answering these questions requires detailed study of the rules of interaction of particular fish species.
We set out to determine which rules individual fish used by analyzing data on the movements of individuals in groups of mosquitofish (Gambusia holbrooki). We first present visualizations of interactions and identify correlations between neighbors in order to determine which (if any) of the above rules are relevant to mosquitofish. In reality, a fish’s movement from its current location will be a response to both social cues and environmental topography. These two interactions are hard to separate by correlation alone, yet it is clearly important to do so in order to isolate and understand the rules used in social interactions (17). We isolate the social interactions from other effects using techniques taken from machine learning (18–20). Assuming that the behavioral response of the focal fish can be decomposed into a mixture of the previous behavior of the focal fish, its position in its environment and the position on its n nearest neighbors (Fig. 1), we used auto-regression and nonlinear function estimation through artificial neural networks (21) to learn a model that fits the movements of the focal fish as a combination of these variables (22).
Fig. 1.

Parameters that characterize the position of the focal fish (represented in red) with respect to neighbors and to the walls of the experimental basin. r: distance from the neighbor. d: distance from the closest wall. ϑ: direction to the neighbor. φ: orientation of the neighbor. γ: orientation to the nearest wall. α: change in direction of the focal fish. All angles are computed with reference to the current moving direction of the focal fish.
Results
We filmed groups of 2, 4, or 8 fish (12 trials of each) (Gambusia holbrooki) in a square arena for 5 min (at 15 fps). Using semiautomated tracking software we subsequently analyzed the trajectories of each fish and how they responded to the position and orientation of their neighbors (see Materials and Methods). We recorded the following key parameters: ϑ, the relative position of the neighbor with respect to the focal fish; φ, the orientation of the neighbor with respect to the focal fish, r, the distance between the neighbor and the focal fish; and α, the change in direction of the focal fish (Fig. 1).
In terms of acceleration, the fish showed clearly defined zones of repulsion and attraction. Fish accelerated when neighbors were directly behind them (within 6 cm; approximately 2 body lengths) and decelerated when neighboring fish were directly in front of them (Fig. 2 A and B). At these short distances, the changes to acceleration were more pronounced when individuals were facing each other—i.e., ϑ and φ have opposite signs (Fig. 4A). This acceleration response was dependent on the fish’s current speed (Fig. 2C); fish moving faster decelerated more than fish moving slower.
Fig. 2.

(A) Acceleration of the focal fish vs. distance (r) and position (ϑ) of the neighbors. (In these plots, the focal fish is located at the origin and faces to the right.) (B) Acceleration of the focal fish vs. distance of the neighbors. Positive or negative x-axis values indicate the neighbor was respectively in front of or behind the focal fish. (C) Same plot as in B, but each curve corresponds to a different speed of the focal fish immediately before the acceleration response. (D) Average acceleration of the focal fish vs. own current speed. (E) Average turning angle of the focal fish as a function of distance and position of all neighbors. Negative values indicate a right turn, positive values indicate a left turn. (F) Average turning angle as a function of the position of the neighbor (ϑ). Data are calculated using the position of all neighbors; error bars (often smaller than symbol size) represent standard errors.
Fig. 4.

(A and B) Average acceleration of the focal fish vs. position (ϑ) and orientation (φ) of the neighbors. (A) repulsion zone (r ≤ 6 cm); (B) attraction zone (r > 6 cm); (C and D) average turning angle (α) of the focal fish vs. position (ϑ) and orientation (φ) of the neighbors. (C) repulsion zone (r ≤ 6 cm); (D) attraction zone (r > 6 cm).
The focal fish were generally attracted to neighbors that were more than 6 cm from them (Fig. 2 A, B, and C). This was manifest by fish accelerating toward neighbors in front of them and decelerating in response to neighbors behind them. The transition from repulsion to attraction occurs at about 6 cm, which is close to the mean distance between a fish and its nearest neighbor (mean, median, and modal distance to nearest neighbor are 6.2 cm, 3.8 cm, and 2.6 cm, respectively; Fig. S1A). There was no clear relationship between the orientation of neighbors in the attraction zone and the acceleration of the focal fish (Fig. 4B). These results suggest that the fish actively regulate the distance to their nearest neighbor, mediated through acceleration, but only respond to orientation in cases where collision is imminent.
The angle to neighbors in the attraction zone had an effect on the turning angle of the focal fish (Fig. 2E); fish turned toward the position of their neighbor. This effect increased as a function of ϑ, so that it was greatest when neighbors were at a right angle to the fish’s current heading (Fig. 2F). This is consistent with the observation that nearest neighbors were more likely to be found directly ahead of or behind each other (Fig. S1B). Unlike acceleration, turning angle did not strongly depend on the distance to neighbors. Thus, the repulsion zone involves fish sharply stopping in response to neighbors within two body lengths, while changing their direction to face toward them.
While fish orientated to face their neighbor’s position, alignment with the orientation of neighbors was less important. Fig. 4 C and D shows a very clear difference in response to direction, ϑ, and less clear pattern in response to orientation, φ (see also Fig. S2). There is possibly a weak effect on the change in angle of a focal fish, whereby when ϑ is approximately equal to φ ± π, the focal fish produces a stronger turning response toward the neighbor. This would correspond to a fish responding more strongly when neighbors are traveling directly away from (or toward) it.
If fish do not systematically align with their neighbors’ orientation, how do groups show strong polarization? One explanation is that fish are attracted more strongly to neighbors in front of them than those behind, producing an asymmetry of leading and following that promotes group alignment (23). Fig. 3 provides empirical support for such leading and following behavior. A fish’s direction is maximally correlated with the direction of a fish in front of it after a 1 s time lag, suggesting that the fish behind follows the fish in front, thereby coming into alignment with this neighbor.
Fig. 3.

(Top) Directional correlation delay vs. distance (r) and position (ϑ) of the nearest neighbor. In order to avoid spurious correlations introduced by the experimental setup, the analysis is limited to video frames in which the focal fish is far from the corners of the basin (> 15 cm). (Bottom) Directional correlation delay vs. distance of the nearest neighbor. Positive or negative x-axis values indicate the neighbor was respectively in front or behind the focal fish.
The accelerations and turning angles of the fish were also affected by the walls of the tank and the immediate previous behavior of the fish. For example, fish tended to be positioned parallel to and about 5 cm from the wall of the tank (Fig. S3A). Moreover, fish generally maintained a cruise speed of 6.9 cms-1 (Fig. 2D). The influence from these factors cannot be immediately separated from the social interactions we have observed thus far. By assuming that the effect of the fish’s past behavior, its interactions with the environmental topography (walls and obstacles), and its social interactions with neighbors are additive, we can estimate each by fitting an additive mixture of response functions. Specifically we model the turning angle and the acceleration of the fish as a sum of five components (see Eq. 1, Materials and Methods). First, a linear auto-regression component mapping past turning angles and accelerations to their current values. This allows us to account for the extended period of time a fish takes to complete its turning or acceleration movements. Second, a nonlinear function of the focal fish’s distance d and angle γ to the nearest wall. The third, fourth, and fifth components are functions of the relative position of the first, second, and third nearest neighbors, respectively, specified by the distance ri and angle ϑi to neighbor i. These nonlinear components are fitted using artificial neural networks (see Materials and Methods). Maximum-likelihood methods are then used to train the sum of these components. Fig. 2A suggests that the acceleration response to neighbors is symmetric about the axis of the focal fish. Similarly, the turning response should be antisymmetric about the same axis (Fig. 2E). Given these observations, we assume both of these symmetries in our fitting.
The model fitting confirms all our earlier observations and also provides more detail about the components of the interactions. A fish’s acceleration was principally controlled by the position of the wall (Fig. 5A) and its nearest neighbor (Fig. 5B). The focal fish tended to accelerate when moving perpendicular and away from the wall (γ = -π/2). The walls had otherwise only weak effects on the fish’s acceleration (Fig. 5A) and turning (Fig. 5E). The acceleration toward the nearest neighbor was strongest when it was between 10 and 20 cm and directly in front of the focal fish (Fig. 5B). Deceleration in response to a neighbor behind the focal fish was also present but was weaker than the acceleration response (Fig. 5B). There was also evidence of a repulsion zone close to the focal fish. Model fitting of the turning angle of a fish again confirmed our earlier observations; the turning response to the wall was weak (Fig. 5E), and the focal fish turned most strongly in response to the nearest neighbor when it was 10 cm away and at right angles to the motion of the focal fish (Fig. 5F). The second and third nearest neighbors had a comparatively much weaker effect on both acceleration and turning angle (Fig. 5 C, D, G, and H). For example, the first nearest neighbor 15 cm in front of a focal fish produces an average acceleration five times larger than the second nearest neighbor at an equivalent position. Additionally, the responses to the second and third nearest neighbor show less spatial structure than those responses to the nearest neighbor.
Fig. 5.

Effect of the wall, first, second and third nearest neighbor on the acceleration (A–D) and turning angle (E–H) of the focal fish. The color scale indicates the size of the acceleration or turning response as a function of the relevant environmental or social variables. Each panel shows the predicted component of the acceleration or turning angle as a function of the variables indicating the positions of the wall and the nearest neighbors. The total predicted response, either acceleration or turning angle, is the addition of all four of these components. Each panel is plotted as a semicircular arc as we assume left-right symmetry in the acceleration response and antisymmetry in the turning. Only data from groups of four fish are used for producing this figure; see Fig. S6 for similar results from groups of eight fish. See Materials and Methods for details of the analysis.
Discussion
With a combination of high resolution data on group movements and function fitting, we have tested the assumptions made by models of the collective motion of fish. We have identified some key similarities with many model assumptions—namely, that fish responded to the position of their neighbors through short-range repulsion and longer-range attraction rules. These rules have been proposed by a number of models (7, 24, 25, 26). There are also some inconsistencies between the classical models of fish motion and our results. For example, we do not find evidence that fish aligned specifically with their neighbor’s orientation; a rule adopted by some models (7, 26). Instead, it appears that group alignment is achieved in some other way, possibly through attraction and repulsion rules and by fish following individuals in front of themselves. Models have already shown that such interactions can produce highly polarized groups (23, 27). However, this is not to say that alignment rules are never adopted by this or other species. Under simulated predation threat, it is clear that alignment with neighbors can allow information to be transmitted rapidly through fish schools (28). Whether fish change their adopted rules depending on context is an intriguing possibility that warrants further investigation.
Another difference is the importance of acceleration in response to a neighbor’s position. Unlike many self-propelled particle models, where speed is fixed and interactions are mediated through changes in direction (1, 6), mosquitofish actively changed their speed in order to avoid or move toward neighbors. Other studies on bird flocks and fish schools have also found strong evidence that individuals’ speeds fluctuate in groups (29–31). Clearly, therefore, it is important for future models to incorporate changes and differences in speeds, which is likely to affect a number of group level properties.
Perhaps the most surprising finding of our study is the extent to which the single nearest neighbor dominates social interactions. Previous observations on birds have identified interacting neighbors using correlations in movement (1, 15) or anisotropy of the position of the nearest neighbors (10). These methods have typically identified multiple interacting neighbors. Given that we find only one interacting neighbor using our function fitting method, it would be interesting to see if similar results hold for birds and other species. Indeed, if we apply a purely correlational approach to our data, we find that the turning angle of a focal fish is as correlated with its second and third neighbors as it is with its first, suggesting multiple interacting neighbors (Fig. S4). These correlations likely arise through multiple interactions between the fish over time and do not necessarily reflect their immediate rules of motion.
Previous experiments on mosquitofish have shown that information about the position of predators can be transmitted rapidly between group members (32). A question remains as to whether these nearest neighbor interactions are sufficient to explain these observations or if the fish change their interactions in risky situations. Early models of collective motion suggested that interactions with more than one neighbor are required for collective motion (33). More recent models have shown that single neighbor interactions can produce complex schooling patterns (5). Further modeling work is required to understand the group-level outcome of the rules we have identified. Mosquitofish form relatively small shoals in freshwater, unlike the larger pelagic shoals formed by some marine species, so we would expect models based on the rules we have identified to produce only a limited range of collective patterns.
There is a qualitative difference between paying attention to one neighbor or to multiple individuals. Responding to two or more neighbors is likely to bear significant costs in information processing time because it requires integrating positional information over the whole visual field (34). Integrating larger quantities of information may be a strategy affordable to animals with larger brains such as birds or mammals but less suitable to animals such as small shoaling fish. However, we are beginning to appreciate that even humans might rely on relatively simple rules to effectively navigate their environment (35). A model on retinal information processing shows that having a threshold mediated response plus sensitivity to particular information can allow individuals to filter out unimportant information from multiple neighbors while responding to strong directed motion of others (36). Such a mechanism is indeed compatible with our findings and may explain how individuals can disregard information from multiple neighbors.
Future studies should attempt to identify the interaction rules between individuals in a comparative way across species. Under different selection pressures different interaction rules are likely to be selectively advantageous (2, 37, 38). Our aim should be to compare the interaction rules adopted by different species, classify the group-level properties generated by these rules, and discuss these in the light of evolution and phylogenetic considerations. If the rules adopted by individuals are similar across distantly related species, then this will show their effectiveness in driving coordinated group movement under different evolutionary pressures. On the other hand, universality in the patterns generated by groups may mean that each species has a very distinct set of rules, each leading to the same set of global patterns (1). Our current study shows us that a detailed analysis of animal interactions of a particular species can provide a different picture of collective motion than we imagine when we concentrate solely on building models.
Materials and Methods
Female mosquitofish (Gambusia holbrooki) were collected from Lake Northam (33°53′07, 15°11′35), Sydney, Australia. Fish were kept in 50 L aquaria on a 12∶12 hour, dark:light photo period and were fed flake food ad libitum. An experimental arena (730 × 730 × 150 mm; see Movie S1) made of 10-mm acrylic was filled to a depth of 70 mm with dechlorinated water and two liters of water taken from a housing tank containing over 50 mosquitofish. This was done to keep the amount of chemical cues between trials constant. Two circular sandstone cores were placed 240 mm in from two of the arenas corners to add structural complexity to the arena. A frame with an opaque black plastic curtain visually isolated the arena in order to prevent external disturbances to the fish. The arena was lit by fluorescent lights. In one corner of the arena was a transparent and perforated door, which could be remotely lifted with a poly-nylon cord. Fish were held in this holding corner (behind the door) prior to the start of trials. For each trial we placed a group of 2, 4, or 8 individuals in the holding corner for 5 min in order to acclimate the fish to the arena. Following this period, we raised the door, allowing the fish to enter the arena. A webcam (Logitech Pro 9000) placed directly over the arena recorded the movements of the fish for 5 min (at 15 frames per second). Twelve replicates of each group size were done.
Data Collection.
Videos were converted from .wmv to .avi format using RAD Video Tools (v 1.9n), uncompressed using VirtualDub (v 1.9.2), and imported to an automated tracking software program, CTrax (v 0.1). This program automatically tracked the position of each fish in each trial, at every frame in the 5-min video, giving 4,500 x and y coordinates of each fish in each video. Data were subsequently imported into MATLAB®, and any errors that the tracking software had made were manually corrected using the associated MATLAB® FixErrors GUI. For a full description of the tracking-software see ref. 39. The x and y coordinates in pixels were converted into cm using a conversion ratio determined by measuring the distance (in pixels) between two corners of the tank (1,032 mm). Coordinates were smoothed using a Savitzky & Sgolay smoothing filter with span 7 frames (approximately 1/2 second) to remove any small spurious changes in position.
Data Analysis.
In turn, each fish in the shoal is selected as the “focal fish.” At each frame t we measure its instantaneous speed
 |
where x(t) and y(t) are the x and y coordinates of the focal fish at time t and dt is the length of the time interval (dt = 1/fps). The direction of movement of the focal fish is
with respect to the positive x axis. The position and direction of movement of all the other fish in the shoal and the position of the corners and walls of the basin are then expressed in the reference system provided by the focal fish coordinates and direction of movement (Fig. 1). Two parameters characterize the response of the focal fish to the conspecifics and to the environment: Its tangential acceleration
and its speed of direction change
where care is taken to compute the correct angular difference, ψ(t) - ψ(t - 1), with regard to the periodicity of ψ(t). We compiled the data from all group sizes together (unless otherwise stated). Analysis revealed no qualitative differences in acceleration or turning angle between group sizes (see Fig. S5).
Function Fitting.
Data from the groups of four or eight fish were analyzed separately in this analysis. We assume an additive model that gives the response, αt, of the focal fish, as a sum of functions of the past responses, the position relative to the nearest wall and the positions of each of the nearest three neighbors,
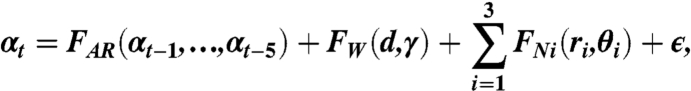 |
[1] |
where FAR is a auto-regressive linear sum of the past five responses, FW is a nonlinear function of the position of the focal fish relative to the nearest wall, and FNi is a nonlinear function of the position of the ith nearest neighbor, relative to the focal fish. The stochastic variable ε represents Gaussian noise and allows for the intrinsic variability of the response.
Auto-regression was based on five previous time steps, equivalent to one third of a second. Fitting was performed by standard least-squares linear regression. The NETLAB (40) toolbox for MATLAB® was used to construct and optimize artificial neural networks for fitting general nonlinear functions. Each network was initialized with the appropriate input and output data, a hidden layer of 20 nodes, and a linear output function. The maximum-likelihood weights for the network were estimated via the back-propagation algorithm. An expectation-maximization (41) algorithm was used to iteratively fit each function (see SI Text).
Supplementary Material
Acknowledgments.
This work was supported by a European Research Council starting grant to D.J.T.S. (ref: IDCAB). J.E.H.R. and A.J.W.W. were supported by funds from the University of Sydney. T.M.S. was funded by the Australian Research Council. We would like to thank two anonymous referees who considerably improved the manuscript
Note.
While preparing our manuscript we became aware of the excellent work of Katz et al., which addresses similar questions on a different fish species (42).
Footnotes
The authors declare no conflict of interest.
This article is a PNAS Direct Submission.
This article contains supporting information online at www.pnas.org/lookup/suppl/doi:10.1073/pnas.1109355108/-/DCSupplemental.
References
- 1.Vicsek T, Zafiris A. Collective motion. 2010 arXiv:1010.5017. [Google Scholar]
- 2.Sumpter DJT. Collective Animal Behavior. Princeton: Princeton Univ Press; 2010. [Google Scholar]
- 3.Cavagna A, et al. The starflag handbook on collective animal behaviour: 1. Empirical methods. Anim Behav. 2008;76:217–236. [Google Scholar]
- 4.Giardina I. Collective behavior in animal groups: theoretical models and empirical studies. HFSP J. 2008;2:205–219. doi: 10.2976/1.2961038. [DOI] [PMC free article] [PubMed] [Google Scholar]
- 5.Bode NWF, Franks DW, Wood AJ. Limited interactions in flocks: Relating model simulations to empirical data. J R Soc Interface. 2011;8:301–304. doi: 10.1098/rsif.2010.0397. [DOI] [PMC free article] [PubMed] [Google Scholar]
- 6.Vicsek T. Application of statistical mechanics to collective motion in biology. Physica A. 1999;274:182–189. [Google Scholar]
- 7.Couzin ID, Krause J, James R, Ruxton GD, Franks NR. Collective memory and spatial sorting in animal groups. J Theor Biol. 2002;218:1–11. doi: 10.1006/jtbi.2002.3065. [DOI] [PubMed] [Google Scholar]
- 8.Huth A, Wissel C. The simulation of the movement of fish schools. J Theor Biol. 1992;156:365–385. [Google Scholar]
- 9.Ginelli F, Chate H. Relevance of metric-free interactions in flocking phenomena. Phys Rev Lett. 2010;105 doi: 10.1103/PhysRevLett.105.168103. 168103. [DOI] [PubMed] [Google Scholar]
- 10.Ballerini M, et al. Interaction ruling animal collective behavior depends on topological rather than metric distance: Evidence from a field study. Proc Natl Acad Sci USA. 2008;105:1232–1237. doi: 10.1073/pnas.0711437105. [DOI] [PMC free article] [PubMed] [Google Scholar]
- 11.Lukeman R, Li YX, Edelstein-Keshet L. Inferring individual rules from collective behavior. Proc Natl Acad Sci USA. 2010;107:12576–12580. doi: 10.1073/pnas.1001763107. [DOI] [PMC free article] [PubMed] [Google Scholar]
- 12.Biro D, Sumpter DJT, Meade J, Guilford T. From compromise to leadership in pigeon homing. Curr Biol. 2006;16:2123–2128. doi: 10.1016/j.cub.2006.08.087. [DOI] [PubMed] [Google Scholar]
- 13.Sumpter DJT, Buhl J, Biro D, Couzin ID. Information transfer in moving animal groups. Theory Biosci. 2008;127:177–186. doi: 10.1007/s12064-008-0040-1. [DOI] [PubMed] [Google Scholar]
- 14.Freeman R, Mann R, Guilford T, Biro D. Group decisions and individual differences: Route fidelity predicts flight leadership in homing pigeons (Columba livia) Biol Lett. 2011;7:63–66. doi: 10.1098/rsbl.2010.0627. [DOI] [PMC free article] [PubMed] [Google Scholar]
- 15.Nagy M, Akos Z, Biro D, Vicsek T. Hierarchical group dynamics in pigeon flocks. Nature. 2010;464:890–893. doi: 10.1038/nature08891. [DOI] [PubMed] [Google Scholar]
- 16.Partridge BL, Pitcher T. The sensory basis of fish schools: Relative roles of lateral line and vision. J Comp Physiol A. 1980;135:315–325. [Google Scholar]
- 17.Eriksson A, Jacobi MN, Nystrom J, Tunstrom K. Determining interaction rules in animal swarms. Behav Ecol. 2010;21:1106–1111. [Google Scholar]
- 18.Vapnik VN. Statistical Learning Theory. New York: Wiley-Interscience; 1998. [Google Scholar]
- 19.Mackay DJC. Information theory, inference and learning algorithms. Cambridge, UK: Cambridge Univ Press; 2003. [Google Scholar]
- 20.Bishop C. Pattern Recognition and Machine Learning. New York: Springer; 2006. [Google Scholar]
- 21.Bishop C. Neural Networks for Pattern Recognition. Oxford: Oxford Univ Press; 1995. [Google Scholar]
- 22.Mann RP. Bayesian inference for identifying interaction rules in moving animal groups. PLoS ONE. 2011;6:e22827. doi: 10.1371/journal.pone.0022827. [DOI] [PMC free article] [PubMed] [Google Scholar]
- 23.Strombom D. Collective motion from local attraction. J Theor Biol. 2011 doi: 10.1016/j.jtbi.2011.05.019. 10.1016/j.jtbi.2011.05.019. [DOI] [PubMed] [Google Scholar]
- 24.Reynolds CW. Flocks, herds and schools: A distributed behavioral model. Comput Graph. 1987;21:25–34. [Google Scholar]
- 25.Okubo A. Dynamical aspects of animal grouping: Swarms, schools, flocks, and herds. Adv Biophys. 1986;22:1–94. doi: 10.1016/0065-227x(86)90003-1. [DOI] [PubMed] [Google Scholar]
- 26.Vicsek T, Czirók A, Ben-Jacob E, Cohen I, Shochet O. Novel type of phase transition in a system of self-driven particles. Phys Rev Lett. 1995;75:1226–1229. doi: 10.1103/PhysRevLett.75.1226. [DOI] [PubMed] [Google Scholar]
- 27.Romey W. Individual differences make a difference in the trajectories of simulated schools of fish. Ecol Modell. 1996;92:65–77. [Google Scholar]
- 28.Radakov DV. Schooling in the ecology of fish. New York: Wiley; 1973. [Google Scholar]
- 29.Cavagna A, et al. Scale-free correlations in starling flocks. Proc Natl Acad Sci USA. 2010;107:11865–11870. doi: 10.1073/pnas.1005766107. [DOI] [PMC free article] [PubMed] [Google Scholar]
- 30.Bode NWF, Faria JJ, Franks DW, Krause J, Wood AJ. How perceived threat increases synchronization in collectively moving animal groups. Proc R Soc Lond B Biol Sci. 2010;277:3065–3070. doi: 10.1098/rspb.2010.0855. [DOI] [PMC free article] [PubMed] [Google Scholar]
- 31.Hemelrijk C, Hildenbrandt H. Self-organized shape and frontal density of fish schools. Ethology. 2008;114:245–254. [Google Scholar]
- 32.Ward AJW, Herbert-Read JE, Sumpter DJT, Krause J. Fast and accurate decisions through collective vigilance in fish shoals. Proc Natl Acad Sci USA. 2011;108:2312–2315. doi: 10.1073/pnas.1007102108. [DOI] [PMC free article] [PubMed] [Google Scholar]
- 33.Huth A, Wissel C. The simulation of the movement of fish schools. J Theor Biol. 1992;156:365–385. [Google Scholar]
- 34.Dukas R. Cognitive Ecology. In: Dukas R, editor. The Evolutionary Ecology of Information Processing and Decision Making. Chicago: Univ of Chicago Press; 1998. pp. 89–127. [Google Scholar]
- 35.Moussaïd M, Helbing D, Theraulaz G. How simple rules determine pedestrian behavior and crowd disasters. Proc Natl Acad Sci USA. 2011;108:6884–6888. doi: 10.1073/pnas.1016507108. [DOI] [PMC free article] [PubMed] [Google Scholar]
- 36.Lemasson B, Anderson J, Goodwin R. Collective motion in animal groups from a neurobiological perspective: The adaptive benefits of dynamic sensory loads and selective attention. J Theor Biol. 2009;261:501–510. doi: 10.1016/j.jtbi.2009.08.013. [DOI] [PubMed] [Google Scholar]
- 37.Krause J, Ruxton GD. Living in groups. Oxford: Oxford Univ Press; 2002. [Google Scholar]
- 38.Wood AJ, Ackland GJ. Evolving the selfish herd: Emergence of distinct aggregating strategies in an individual-based model. Proc R Soc Lond B Biol Sci. 2007;274:1637–1642. doi: 10.1098/rspb.2007.0306. [DOI] [PMC free article] [PubMed] [Google Scholar]
- 39.Branson K, Robie AA, Bender J, Perona P, Dickinson MH. High-throughput ethomics in large groups of Drosophila. Nat Methods. 2009;6:451–457. doi: 10.1038/nmeth.1328. [DOI] [PMC free article] [PubMed] [Google Scholar]
- 40.Nabney IT. NETLAB: Algorithms for Pattern Recognition. New York: Springer; 2002. [Google Scholar]
- 41.Neal RM, Hinton GE. In: Learning in graphical models. Jordan M, editor. Dordrecht, the Netherlands: Kluwer Academic Publishers; 1998. pp. 355–367. [Google Scholar]
- 42.Katz Y, Tunstrom K, Ioannou CC, Huepe C, Couzin ID. Inferring the structure and dynamics of interactions in schooling fish. Proc Natl Acad Sci USA. 2011 doi: 10.1073/pnas.1107583108. 10.1073/pnas.1107583108. [DOI] [PMC free article] [PubMed] [Google Scholar]
Associated Data
This section collects any data citations, data availability statements, or supplementary materials included in this article.