

Abstract
Recently, single-molecule imaging and photocontrol have enabled superresolution optical microscopy of cellular structures beyond Abbe’s diffraction limit, extending the frontier of noninvasive imaging of structures within living cells. However, live-cell superresolution imaging has been challenged by the need to image three-dimensional (3D) structures relative to their biological context, such as the cellular membrane. We have developed a technique, termed superresolution by power-dependent active intermittency and points accumulation for imaging in nanoscale topography (SPRAIPAINT) that combines imaging of intracellular enhanced YFP (eYFP) fusions (SPRAI) with stochastic localization of the cell surface (PAINT) to image two different fluorophores sequentially with only one laser. Simple light-induced blinking of eYFP and collisional flux onto the cell surface by Nile red are used to achieve single-molecule localizations, without any antibody labeling, cell membrane permeabilization, or thiol-oxygen scavenger systems required. Here we demonstrate live-cell 3D superresolution imaging of Crescentin-eYFP, a cytoskeletal fluorescent protein fusion, colocalized with the surface of the bacterium Caulobacter crescentus using a double-helix point spread function microscope. Three-dimensional colocalization of intracellular protein structures and the cell surface with superresolution optical microscopy opens the door for the analysis of protein interactions in living cells with excellent precision (20–40 nm in 3D) over a large field of view (12 × 12 μm).
Keywords: cell biology, wide-field microscopy, cytoskeleton, fluorescence microscopy, bacteria
Fluorescence microscopy and its associated labeling techniques have become invaluable tools for cell biologists because of their remarkable label specificity, high signal-to-background, and noninvasive nature. However, far-field conventional optical microscopy is limited by the diffraction limit to a lateral (xy) resolution of approximately λ/2 and an axial (z) resolution of approximately λ due to the finite numerical aperture of microscope objective lenses and diffraction of light of wavelength λ. X-ray (1) and electron (2) microscopes can provide higher spatial resolution but usually sacrifice contrast or specificity, involve more complex sample preparation, and are extremely difficult to use for live-cell imaging.
Recently, many superresolution optical microscopy methods have been developed to push fluorescence optical imaging beyond the diffraction limit in all three dimensions. One class, based on spatial patterning of the excitation and/or a nonlinear response, includes three-dimensional (3D) structured illumination microscopy (3), which improves resolution by a factor of two, and 3D stimulated emission depletion microscopy (4), which has been demonstrated to have an isotropic resolution of approximately 40 nm depending upon the emitter. The complementary class, denoted by the mechanism-independent term single-molecule active control microscopy (SMACM), includes (fluorescence) photoactivated localization microscopy [(F)PALM] (5, 6), [direct (7)] stochastic optical reconstruction microscopy (STORM) (8), points accumulation for imaging in nanoscale topography (PAINT) (9, 10), photoswitching of fluorescent proteins (11), ground state depletion microscopy followed by individual molecule return (12), and blink microscopy (13). All of these pointillist techniques localize sparse subsets of single-molecule emitters sequentially over time, thereby building up a superresolution reconstruction, until the desired structure is resolved. Each of the aforementioned acronyms refers to the specific active control mechanism that is used to prevent single-molecule overlap in any one image by keeping the emitting concentration low, such as photoactivation, photoswitching, collisional flux from the surrounding solution, and pumping into reversible long-lived dark states.
Three-dimensional localizations are possible with SMACM techniques by breaking the axial symmetry of the standard point spread function (PSF) (14–16), imaging in multiple focal planes simultaneously (17), or projecting the axial dimension onto a lateral dimension (18). These methods can achieve precisions below 100 nm in 3D over a 2-μm range (14, 19, 20). In addition, sub-10-nm precision can be obtained via interferometry (21); however, these methods severely restrict the sample geometry, have a shallower operational depth of field (∼650 nm) (22), and are not yet conducive to live-cell imaging.
Superresolution microscopy has been particularly useful in protein localization studies within bacterial cells (23) because of the comparable size of most bacteria relative to the visible diffraction limit. For example, Caulobacter crescentus is a bacterium whose physical dimensions (∼2 × 0.6 μm) lie close to the resolving power of conventional optical microscopy (∼250 nm). C. crescentus exhibits differential polar localization of regulatory proteins and polar organelles such as flagella and pili. Enhanced YFP (eYFP) has been used in superresolution imaging to observe multiple structures in C. crescentus including: a banded structure and a midplane ring formed by the protein MreB (11), eukaryotic spindle-like DNA segregation structure composed of the ATPase ParA (24), and the spatial distribution of the nucleoid-associated protein HU during different phases of the C. crescentus cell cycle (25). Although actual biological interactions occur in 3D space, studies of C. crescentus thus far have been constrained by the use of two-dimensional (2D) superresolution microscopy, and extending these studies to 3D is necessary to reveal the true spatial relationships between these biological structures.
A natural extension to these studies is the colocalization of proteins relative to other cellular features within C. crescentus. Relative distances between proteins, for example, can reveal details about their dynamic interaction. Colocalization is often accomplished via multicolor imaging of photoactivatable fluorescent molecules, which requires multiple collinear imaging lasers creating alternating activation and imaging pulses (26, 27). Furthermore, the choice of fluorescent molecules is restricted, as the activation and emission spectra of each molecule must be carefully evaluated to minimize crosstalk. Samples must also be shielded from ambient light until they are imaged. In the case of fluorescent proteins, multicolor imaging requires the stable transfection of at least two fluorescent protein fusions, and additional controls must be performed to ensure that biological processes are unaffected by both fusions.
Here, we describe a method for sequential localization of an internal protein superstructure and the bacterial surface, termed superresolution by power-dependent active intermittency and points accumulation for imaging in nanoscale topography (SPRAIPAINT), which is a combination of photo-induced blinking of eYFP (SPRAI) and transient labeling of the cell surface via PAINT (9, 10). This method features the advantages of requiring a single reading laser, and PAINT can be performed indefinitely because of the continuous replenishment of dye from solution. The experimental setup and sample preparation are simple compared to multicolor photoactivation and photoswitching imaging experiments. Moreover, the use of wide field imaging techniques instead of spatial patterning of the excitation beam allows a large field of view to be imaged in 3D simultaneously. Combining this technique with the 3D imaging capabilities of the double-helix PSF (DH-PSF) (15, 20), we show remarkable 3D superresolution images of Crescentin-eYFP (CreS-eYFP), a cytoskeletal protein fusion, colocalized with the cell surface of live C. crescentus. The blinking behavior and localization characteristics of CreS-eYFP are also characterized. Furthermore, we analyze the spatial and temporal properties of cell surface localizations via PAINT. Finally, the generality of this imaging approach is demonstrated by replacing the standard PAINT dye, Nile red, with a unique dicyanomethylenedihydrofuran (DCDHF) derivative (28) and characterizing the spatial properties of the resulting reconstruction. To our knowledge, this demonstration of 3D superresolution imaging of intracellular protein superstructures colocalized with the surface of living cells has not been reported previously.
Results
Three-Dimensional SPRAIPAINT.
To image protein superstructures relative to their biological context, the SPRAIPAINT concept (Fig. 1A, Inset) is based upon the idea of imaging two different fluorophores sequentially with only a single pumping laser and no need for a photoactivation laser. In other, more conventional SMACM methods such as PALM (5), FPALM (6), and STORM (8), the active fluorophore concentration must be controlled by some other mechanism to achieve PSF isolation and superlocalization (29, 30). In the SPRAI portion of our technique, eYFP is made to blink reversibly by driving the molecules into a dark state with simple high intensity laser pumping (25). During PAINT (9), fluorophores in solution dynamically bind to and unbind from the cellular membrane. As the bound form of the fluorophore is bright compared to the form in solution, single molecules on the surface can be preferentially imaged as required. In our experiments, we immobilized live C. crescentus cells expressing CreS-eYFP (Fig. 1A, Inset). In the first stage of imaging (SPRAI), we imaged and localized blinking single eYFP molecules until the population irreversibly photobleached. Next, we introduced a PAINT dye to the sample whose absorption was resonant with the same excitation source and imaged single molecules until a sufficient number of localizations were collected to effectively define the complex Caulobacter cell surface.
Fig. 1.

Three-dimensional SPRAIPAINT concept. (A) Schematic of fluorescence detection path in the DH-PSF microscope. Inset shows SPRAIPAINT procedure. DM, dichroic mirror; LP, long pass filter; BP, band-pass filter; M, mirror; TL, tube lens; L1 and L2, lenses in 4f imaging system; P, polarizer; SLM, spatial light modulator; EMCCD, electron-multiplying charge-coupled device. (B) Images of the DH-PSF for various z positions of a fluorescent bead. (C) Calibration curve of angle versus z position for the DH-PSF, sampled every 50 nm. (D) Transmission white-light image of several C. crescentus cells during SPRAIPAINT imaging. (E) Raw DH-PSF fluorescence images of blinking eYFP during SPRAI imaging and (F) Nile red PAINT, both of the same field of view as D. Scale bars, 1 μm.
Three-dimensional superresolution information was collected by optically convolving the single-molecule images with the double-helix point spread function (Fig. 1A) (20, 31, 32). The DH-PSF converts the normal fluorescence spot of a single molecule into two spots by processing the image with a specially designed phase mask on a spatial light modulator. The DH-PSF imaging system encodes different z positions as different angles of the line between the two spots (Fig. 1B). For different axial positions, the two spots rotate about one another over a 1.6-μm range (Fig. 1C), creating a double helix along the z axis.
During our experiments, we observed C. crescentus cells in various stages of the cell cycle (Fig. 1D). For each field of view, we measured approximately 15,000 frames of eYFP blinking before photobleaching (Fig. 1E), with a 50-ms integration time and a mean background of 2.1 photons/pixel in each frame. This mean background increased to 4.0 photons/pixel per frame (30 ms exposure time) when imaging Nile red on the cell surface (Fig. 1F), consistent with a high concentration (3.5 nM) of freely diffusing fluors in the aqueous surroundings. We collected approximately 25,000 frames of Nile red PAINT data from each field of view, and the total SPRAIPAINT imaging time lasted approximately 20 min. To maximize localization precision, the exposure times were chosen such that most of the observed single molecules emitted photons for only a single frame (78% for eYFP, 79% for Nile red). Fiduciary fluorescent beads were used to correct for drift of the microscope stage. Three-dimensional positions were extracted from movies of blinking single molecules using an automated recognition and fitting algorithm written in MATLAB.
We observed 3D localizations of the single CreS-eYFP molecules, as expected from previous studies (33), assembled into diverse filament structures extending along much of the length of the cell (Fig. 2 and Movies S1–S4). Comparison of the diffraction-limited images to the superresolution images shows the wealth of information now revealed by performing 3D superresolution microscopy on bacterial superstructures over a wide field of view (Fig. 2G and Movie S3). In agreement with previous diffraction-limited optical studies, the CreS fiber is often localized near the inner cell surface (33, 34). In predivisional cells, the fiber extends across the division septum, as evidenced by the pinching membrane sensed by the Nile red dye.
Fig. 2.

Three-dimensional SPRAIPAINT images of C. crescentus. (A) Three-dimensional perspective images of a predivisional stalked cell (Left to Right): Diffraction-limited image of the CreS-eYFP fiber (red-orange) and cell membrane (gray), superresolution image of the fiber alone (159 localizations), superresolution image of the cell membrane alone (854 localizations), and overlay of both the fiber and cell membrane. Inset shows a transmission white-light image of the same cell. Two-dimensional isometric (B) xy and (C) yz projections of the cell shown in A. (D) Three-dimensional superresolution (Top) and diffraction-limited (Bottom) perspective images of another predivisional cell with the CreS-eYFP fiber inside it. Inset shows a transmission white-light image of the same cell, whose stalk is faintly visible. Here, there are 170 localizations of the fiber and 1,097 localizations of the cell surface. Two-dimensional isometric (E) xy and (F) yz projections of the cell shown in D. The stalk of the cell is clearly resolved in the PAINT localizations (white arrows). (G) Three-dimensional superresolution perspective image of a large field of view (12 × 10 μm). Inset shows a white-light image of the same field of view. Grids and scale bars, 1 μm.
As a test to ensure truly random sampling, we analyzed the spatial positions of both eYFP and Nile red localizations as a function of time (Fig. S1), and we observed reasonably random sampling over both the linear structure (eYFP) and on the cell surface (Nile red) during the entire imaging time. Occasionally, clustered localizations occurred for Nile red, almost certainly arising from a single long-lived bright molecule that was localized more than once (Fig. S1C). It is possible for such events to be filtered out in postprocessing of the data before final rendering; however, we include these points in our images (Figs. 2–5) for completeness. No spatial or temporal postprocessing filters were used on the 3D localizations acquired by our microscope to convey the excellent experimental characteristics of 3D SPRAIPAINT imaging using the DH-PSF.
Fig. 3.

Characterization of eYFP SPRAI imaging. (A) Diffraction-limited and superresolution 3D perspective images of a CreS-eYFP structure within C. crescentus generated using 431 localizations of eYFP. Inset shows a transmission white-light image of the same cell. Grid and scale bar, 1 μm. (B) Spatial distribution of eYFP within 150 nm of the yellow line shown in A. A Gaussian fit to the distribution shows a measured fiber thickness of 39 nm. (C) Measured intensity of bulk CreS-eYFP inside C. crescentus with pulsed excitation (0.5 s on time, 1 s off time) at various pump intensities (blue, 26 W/cm2; green, 770 W/cm2; red, 2.9 kW/cm2). The blue and green curves are shifted upward by 60 and 30 kphotons/pixel per second, respectively, to enhance readability. The number of molecules recovered from the dark state during the first cycle is denoted by horizontal lines. (D) Fraction of unbleached molecules in the reversible dark state, as measured between the first and second pulses denoted in C, as a function of pump intensity. Dashed red line shows the fit to that of a three-level system with a long-lived dark state. (E) Distribution of photons detected from single eYFPs in the cell shown in A. (F) Distribution of lateral localization precision computed from the photon distribution in E. (G) Distribution of axial localization precision computed from the photon distribution in E.
Fig. 4.

Characterization of Nile red PAINT. (A) Scatter plot of 1,097 PAINT localizations of the C. crescentus cell surface (gray). These localizations clearly resolve the division septum and cell stalk (white arrows) and were used to compute the location of the cell’s central axis (cyan). Inset shows transmission white-light image of the cell. Grid and scale bar, 1 μm. (B) Distribution of measured membrane radii as a function of distance along the cell. Scale bar, 1 μm. (C) Cross-section of PAINT localizations of the yellow slice of cell surface shown in A and B. Outer box, 1 × 1 μm. (D) Distribution of measured radii for the yellow slice of membrane shown in A–C. Fitting the distribution to a Gaussian shows a measured thickness of 58 nm. (E) Cumulative number of Nile red PAINT localizations (gray) compared to eYFP SPRAI localizations (orange) versus acquisition time in a 30 × 30 μm field of view. Plotted data corresponds to 5,000-frame acquisitions. (F) Distribution of photons detected from Nile red for the cell shown in A. (G) Distribution of lateral localization precision computed from the photon distribution in F. (H) Distribution of axial localization precision computed from the photon distribution in F.
Fig. 5.

Three-dimensional SPRAIPAINT using eYFP and DCDHF-tail. (A) Three-dimensional SPRAIPAINT image of CreS-eYFP (395 localizations, red-orange) and DCDHF-tail (1,291 localizations, gray). PAINT localizations were used to compute the location of the cell’s central axis (cyan). Inset shows a transmission white-light image of the cell. Grid and scale bar, 1 μm. (B) Cross-section of PAINT localizations of the yellow slice of cell membrane shown in A. Outer box, 1 μm. (C) Distribution of measured radii for the yellow slice of membrane shown in A and B. Fitting the distribution to a Gaussian shows a measured thickness of 61 nm. (D) Chemical structure of DCDHF-tail. (E) Absorbance and fluorescence of DCDHF-tail in PBS with (dashed line) and without (solid line) C. crescentus cells. (F) Normalized fluorescence versus viscosity for Nile red (gray squares), DCDHF-tail (magenta diamonds), and Rhodamine 6G (green circles). (G) Distribution of photons detected from DCDHF-tail for the cell shown in A. (H) Distribution of lateral localization precision computed from the DCDHF-tail photon distribution in G. (I) Distribution of axial localization precision computed from the DCDHF-tail photon distribution in G.
The false positive rate of localization outside the cells during SPRAIPAINT was analyzed by examining a large (∼10 × 10 μm) field of view containing 426 eYFP and 3,003 Nile red localizations (Fig. S2). Localizations that appear too far away from cells (∼100 nm) were hand-designated as false positives, yielding an error rate of 3.8% for eYFP and 3.5% for Nile red. It is important to note that this total error rate arises from many sources. Sample-related errors may include leakage of CreS-eYFP fusions into the surrounding medium and localization of Nile red on the agarose pad instead of on cell surface. Image processing errors can include misrecognition of DH-PSFs in raw fluorescence data and fitting errors associated with low signal-to-background events. Regardless of the error source, the error rate during SPRAIPAINT imaging is sufficiently low to produce high quality 3D superresolution reconstructions of the CreS-eYFP structure and the C. crescentus cell surface.
Characterization of eYFP SPRAI Imaging.
The CreS-eYFP fiber also formed a curved helix-like superstructure in several cells. This helical shape is unclear in diffraction-limited images but is readily observable in our 3D superresolution images (Fig. 3A and Movies S1–S4). By drawing a line perpendicular to the fiber and binning molecule localizations within a 150 nm radius of the line, we measure the distribution shown and extract a fiber radius of approximately 39 nm (standard deviation, Fig. 3B). Because this CreS-eYFP fusion is expressed above the native background of the endogenous CreS population, the thickness of the fiber may be influenced somewhat by presence of the eYFP fusion. It is clear that the same underlying principles and methods could be applied to any other quasi-static protein superstructure of interest.
During our imaging experiments, the active control mechanism for eYFP was blinking, induced by the reading light. This blinking behavior is essential for superresolution microscopy, as the active emitter concentration must be reduced so that the individual single-molecule PSFs do not overlap. In the first report of single-molecule imaging of eYFP (35), both blinking and blue-light-induced rescue from a long-lived dark state were reported. In a previous study, a blue laser (405 nm) was used to reactivate eYFP protein fusions that had entered a long-lived dark state (11). Spontaneous return from a dark state was observed in several recent superresolution studies using eYFP without the need for a blue reactivating laser (24, 25). Here, we characterized the blinking mechanism of eYFP by measuring the fluorescence of the CreS-eYFP fusions as a function of pumping power in a region containing many living cells. We pulsed the pumping laser with a mechanical shutter (on time = 0.5 s, off time = 1 s) and measured the fluorescence decay for three separate samples at each power level (1.4 W/cm2 to 2.9 kW/cm2). At high pumping intensities, a larger fractional portion of the eYFP population was observed to return from an inaccessible dark state, signified by a spike in fluorescence intensity after each off cycle (Fig. 3C). For shorter off times, the degree of recovery was reduced, suggesting a dark state lifetime on the order of hundreds of milliseconds. The fractional degree of fluorescence recovery increased dramatically with higher pumping intensities. The fraction of unbleached molecules shelved into the reversible dark state can be computed by measuring the fluorescence intensity before and after the first off cycle, such that
 |
[1] |
where I1,end is the fluorescent intensity recorded at the end of the initial excitation pulse and I2,start is the fluorescent intensity recorded at the beginning of the second pulse. For a pumping intensity of 26 W/cm2, the dark state fraction was measured to be 0.02 ± 0.02. However, for 770 W/cm2 and 2.9 kW/cm2, we measured the fraction of molecules in the dark state to be 0.31 ± 0.03 and 0.62 ± 0.01, respectively. The measured dark state fraction versus pumping power curve (Fig. 3D) fits the well-known behavior of a three-level system with a long-lived dark state (R2 = 0.99) (36–38), which is given by
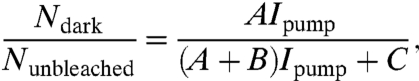 |
[2] |
where Ipump is the intensity of the excitation laser and A, B, and C are fitting parameters. This analysis confirms the existence of a long-lived, reversible dark state in eYFP, where the time-averaged probability of occupation of the dark state is dependent upon the reading power. It is important to note that, in addition to dark state shelving, photobleaching increases with pumping power, and thus, the pumping intensity must be chosen carefully to balance photobleaching and dark state shelving to achieve a desired number of localizations within a certain imaging time. (For the SPRAI imaging experiments shown here, we used a pumping intensity of 450 W/cm2.) The dark state does not appear to be a simple triplet state because the recovery time is longer than most triplet lifetimes, and may arise from reversible photophysics or photochemistry such as isomerization or hydrogen bond rearrangements. A more detailed photophysical analysis of eYFP is reserved for further study.
In our SPRAI imaging with eYFP, we measured approximately 1,000 photons detected per localization on average (Fig. 3E), although some molecules emitted significantly more photons. This number of photons corresponds to 15 nm localization precision in the lateral dimensions (Fig. 3F) and 27 nm localization precision in the axial dimension (Fig. 3G) using the previously measured scaling behavior of the DH-PSF (20).
Although SPRAIPAINT has the ability to resolve two-color 3D superresolution images in live bacterial cells with a single excitation source, as implemented here it is currently not suitable for every 3D biological sample. One of the shortcomings is the intrinsic sampling loss associated with the irreversible photobleaching of eYFP. Because the intense laser excitation does not drive all the fluorophores into the reversible long-lived dark state, some are irreversibly lost because of photobleaching (Fig. 3C). This loss will therefore decrease the number of single-molecule localizations available to sample the superresolution structure. This drawback could be potentially solved by switching to a photoactivatable fluorescent protein [e.g., Dendra2, mEos2, or PA-mCherry (39–41)]; however, these systems present their own experimental challenges, for example, the need for a collinear switching laser in addition to the reading laser.
Characterization of Nile Red PAINT.
The ability to colocalize intracellular proteins with respect to the cell surface depends on the labeling characteristics of the PAINT fluorophore. Here, we used our 3D localizations of Nile red to sense the surface of C. crescentus. The PAINT image shows that Nile red labels the surface with high specificity (Fig. 4A and Movies S1–S3). In particular, the division septum and stalk of the cell are highly resolved. In addition, the sampling of the surface is approximately uniform across the entire cell. Assuming the cross-section of the cell to be approximately circular, we computed the location of the central axis along the cell’s entire length. The radial distance from this axis to each of the PAINT localizations was calculated as a function of location along the cell’s axis (Fig. 4B). This analysis reveals that a majority of the Nile red localizations occur on the cell surface and relatively few molecules localize inside the cell. We measure a characteristic cell diameter of approximately 500–600 nm, which is consistent with previous studies of Caulobacter (42–44). In addition, we isolated a 400-nm thick axial slice of the surface, and as expected, these localizations reveal that the membrane cross-section is approximately circular (Fig. 4C), with the preponderance of localizations residing on the surface rather than in the cytoplasm.
By binning the radii of these localizations, we measured a mean membrane radius of 270 nm and a membrane thickness of 58 nm (standard deviation, Fig. 4D). This thickness is larger than the precision predicted by the number of detected photons and can be attributed to a number of factors. First, the binding kinetics of Nile red molecules on living cell membranes are not well understood, and Nile red may emit fluorescence not only in the outer or inner membrane but also when interacting with the cell wall. Secondly, because of the imperfect nature of the live-cell gel immobilization technique, nanoscale movements of the live bacteria relative to the fiducial marker may cause broadening. Finally, single-molecule dipole orientation effects could introduce an error (45), depending on the orientational mobility of emitting Nile red molecules.
Photobleaching, which normally limits the number and precision of single-molecule localizations during SMACM, is not an issue during PAINT because of the continuous supply of new emitters from the solution, and this property is a defining characteristic of the technique. This replenishment is evidenced by the number of PAINT single-molecule localizations we detect as a function of time (Fig 4E). During the first 5,000-frame acquisition, the cumulative number of SPRAI localizations of eYFP approaches an asymptote as the sample is imaged, which shows that photobleaching limits the total number of single-molecule localizations of eYFP. In contrast, the number of PAINT localizations increases linearly with time, once the concentration of PAINT dye reaches equilibrium after being added to the sample. This localization rate is a defining signature of the PAINT technique.
Furthermore, we measured the number of photons detected per localization versus acquisition time for both eYFP and Nile red (Fig. S3). There is a slight decay in the number of photons detected from eYFP as the experiment progressed, but the number of photons detected from Nile red is essentially constant throughout the entire experiment. This result demonstrates that photobleaching is the primary limitation for SPRAI imaging of eYFP, whereas Nile red can be imaged almost indefinitely during PAINT.
With an average of 1,000 photons detected per localization (Fig. 4F), our mean precision with Nile red PAINT is 19 nm in the x and y directions (Fig. 4G) and 34 nm in the z direction (Fig. 4H). Even though we detect approximately the same number of photons from eYFP and Nile red, our background when imaging Nile red was higher, thereby causing our localization precision with Nile red to be worse.
Three-Dimensional SPRAIPAINT Using eYFP and DCDHF-Tail.
DCDHF chromophores have been demonstrated to be useful single-molecule labels with beneficial properties such as viscosity-dependent fluorescence and strong solvatochromism (46, 47). This interesting family of fluorophores has been shown to provide many imaging functionalities by chemical derivatization (48). With long-chain alkyl substituents, DCDHFs can be synthesized with amphiphilic properties and can therefore in principle label aliphatic cell membranes (49). To demonstrate the broad usefulness of SPRAIPAINT and verify the cell surface imaging by Nile red, we performed 3D SPRAIPAINT on C. crescentus using an amphiphilic DCDHF derivative, henceforth referred to as DCDHF-tail (Fig. 5D) (28).
A 3D SPRAIPAINT image using eYFP and DCDHF-tail shows that DCDHF-tail also labels the cell membrane with high specificity (Fig. 5A and Movie S4). The sampling of the cell membrane is roughly uniform, and the division septum is clearly resolved in the image. Similar to the Nile red measurements, we computed the location of the cell’s central axis, and by isolating a 1-μm axial slice of membrane, we found that the measured membrane cross-section using DCDHF-tail is also approximately circular (Fig. 5B). By binning the PAINT localization radii for this slice, we measured a membrane radius of 260 nm and a thickness of 61 nm (standard deviation, Fig. 5C). Again, this thickness is larger than that measured by electron microscopy and is likely attributable to the aforementioned factors that affect Nile red PAINT.
To characterize DCDHF-tail (Fig. 5D) as a PAINT dye, we measured its absorption and fluorescence spectra in PBS buffer with and without C. crescentus cells (Fig. 5E). DCDHF-tail’s absorption is unaffected by adding cells to the buffer. However, we measure a 1.8-fold increase in integrated fluorescence intensity when adding cells to the DCDHF-tail solution. This increase is most likely because of DCDHF-tail’s strong viscosity-dependent emission, which causes an increase in fluorescence intensity as large as 30-fold in glycerol versus water (Fig. 5F). This viscosity dependence is extremely beneficial for PAINT, as it increases the effective turn-on ratio of the molecule. As a comparison, the fluorescence of Nile red exhibited a similar increase but Rhodamine 6G did not show any increase with viscosity, and therefore, in this regard both Nile red and DCDHF-tail are more suitable PAINT dyes.
With an average value of 1,100 photons detected per localization (Fig. 5G), our mean precision with DCDHF-tail PAINT is 18 nm in the x and y directions (Fig. 5H) and 33 nm in the z direction (Fig. 5I). The mean background during these measurements was 5.1 photons/pixel per frame. The PAINT imaging conditions used for DCDHF-tail were identical to those used for Nile red, and it is possible that with further optimization, the additional photons available from DCDHF-tail can be used to achieve even higher localization precision.
Discussion
It is important to understand the factors that are used to optimize good PAINT fluorophores in order to develop future probes. Nile red has been used almost exclusively in PAINT experiments (9, 10) for many reasons, including: its specificity to the cell surface and not the substrate, its viscosity-dependent fluorescence emission (sometimes called membrane sensing), its excellent turn-on ratio, and its spectral shift of absorption during binding. In addition, its lack of charge aids its solubility in both polar and lipid environments, where a careful tuning of the amphiphilic nature of the dye is required for optimal temporal binding kinetics (50). Fortunately, DCDHF-tail also displays the characteristics of a good PAINT dye, namely: an aliphatic region for membrane binding, charge to allow the molecule to remain outside the cell and to impart water solubility, and the push-pull DCDHF fluorophore moiety. In addition, this molecule also demonstrates excellent photophysical characteristics including: uniform labeling of the membrane (Fig. 5A), a strong increase in fluorescence emission in more viscous environments comparable to that of Nile red (Fig. 5D), and an increased number of detected photons through the DH-PSF microscope as compared to Nile red (Fig. 5E). All these factors demonstrate that other molecules can be excellent candidates for PAINT imaging and warrant further investigation.
In these experiments, the binding of the PAINT dye is nonspecific, allowing nonbiased sampling of the entire outer surface of the C. crescentus cell, where the number of localizations is linear with and limited only by the length of imaging time (Fig. 4E). Although this binding characteristic is useful in determining spatial positions of interior proteins relative to the cell surface, we propose that it may be possible to modify the dye so that it binds to specific regions of the membrane (10) (e.g., regions with high curvature or at lipid-partitioning regions). This approach can be explored with future rational fluorophore design. In the sample geometry demonstrated here, washing out the PAINT dye after adding it to the sample is not possible. However, incorporating the imaging in a microfluidic platform, for example, could facilitate the introduction and washing of the PAINT dye, as well as delivery of nutrients to the cells for longer-term imaging.
Notably, the SPRAIPAINT imaging strategy is independent of the 3D imaging method used to localize single molecules. Here, we utilized the DH-PSF for its excellent and uniform 3D localization precision across its whole depth of field (20, 51), but other 3D superresolution methods (14, 17) can be applied for 3D SPRAIPAINT as well. The choice of 3D method is largely influenced by the desired localization precision and depth of field required to image the target structure labeled with a candidate fluorophore. The DH-PSF has an operational depth of field of 2 μm, limited by the PSF design itself. If the target structure spans an axial range greater than 2 μm, the sample would need to be scanned axially (52) to use the DH-PSF for 3D SPRAIPAINT. Aberrations associated with imaging deeply into mismatched media would also need to be considered.
Three-dimensional SPRAIPAINT achieves colocalization via the sequential acquisition of intracellular protein locations followed by imaging of the cell surface, thereby simplifying the optical setup and biological sample preparation required versus typical two-color colocalization experiments using photoactivatable fluorophores. In addition, observing protein dynamics within single living cells relative to the cell surface is possible using the SPRAIPAINT technique. In the future, it is to be expected that SPRAIPAINT can be optimized to decrease the total amount of imaging time required to resolve complex 3D structures, modified by using PAINT dyes designed to light up specific desired regions of the cellular surface or membrane, and enhanced with additional optimized fluorescent proteins.
Methods
Bacterial Strains and Culture Conditions.
To enable superresolution localization of fluorescently-tagged CreS molecules in Caulobacter, we created a xylose-inducible eYFP fusion to creS in the wild-type Caulobacter background. KOD Hot Start DNA Polymerase (Novagen) was used to PCR amplify the Caulobacter creS gene from genomic DNA using the primers GCATCACATATGCAGCACCAGATCGAGTCCAC and GCATCAGAGCTCGGGCGCTCGCGGCCACGTCGCCGTC, which add a 5′ NdeI and in frame 3′ SacI site to the product (underlined). This amplified fragment and the plasmid pXYFPC-5 (53) were digested with NdeI and SacI, and the vector was dephosphorylated using Calf Intestinal Phosphatase (New England BioLabs, Inc.) before gel purification and ligation using T4 DNA ligase (Fermentas). The correct plasmid, pJP124, was sequence verified. The plasmid pJP124 was introduced into wild-type Caulobacter CB15N via electroporation and integrated at the xylX chromosomal locus. The resulting strain, JP198, contained a xylose-inducible creS-eyfp gene at xylX in addition to the untagged creS gene at the native chromosomal locus.
Sample Preparation for Single-Molecule SPRAIPAINT Imaging.
Asynchronous cultures of C. crescentus strain JP198 were grown in minimal growth media (M2G) at 28 °C for 2 d at log phase, induced with 0.03% xylose for 90 min. The culture was washed by centrifugation (8,000 rpm for 3 min) and resuspension in clean cold M2G three times, before a final suspension in pH 7.4 PBS buffer (Gibco). One microliter of cells was mounted on a ∼5 × 5 × 2 mm pad of 2% agarose (Sigma) in M2G, which was mounted in the center of a 25 × 25 mm glass slide (Fisher Finest, No. 1) and imaged immediately and only once before being discarded. Fluorescent beads (2 pM in PBS) were added (565/580 carboxylate-modified FluoSpheres, Molecular Probes, 100 nm) as fiduciary markers.
Single-Molecule SPRAIPAINT Imaging.
The double-helix 3D microscope uses a 4f imaging system (f = 15 cm) to relay the fluorescence image from an inverted microscope (Olympus IX71) onto an electron-multiplying charge-coupled camera (Andor Ixon+ DU-897E) (Fig. 1A). The imaging system convolves the standard PSF of the microscope with the DH-PSF using a phase-only spatial light modulator (Boulder Nonlinear Systems XY phase series) and has been described previously in detail (20, 32, 54). For this study, we illuminated C. crescentus cells with 514-nm light (Coherent Innova 90 Ar+ laser). The fluorescence from the sample was collected by a 100 × 1.4 N.A. oil-immersion objective (Olympus UPlanSApo 100 × /1.40) and filtered through a dichroic mirror (Chroma, Z514RDC) and a 530-nm long pass filter (Omega XF3082). During imaging, the focal plane of the microscope was positioned near the axial midplane of the cells. In addition, the excitation beam was tilted at an angle with respect to the optical axis; this pseudo-total internal reflection fluorescence configuration reduced the background fluorescence during imaging. The size of the excitation spot was 30 μm (1/e2 radius).
Imaging was performed sequentially with the genetically encoded fluorescent protein imaged first (SPRAI imaging) until near complete photobleaching was observed, then the nonspecific PAINT dye was added and allowed to quickly diffuse through the (intentionally) small agarose pad.
For SPRAI imaging, we illuminated the sample at a peak intensity of 450 W/cm2 (calibrated by taking into account the shape of the background fluorescence created by the excitation spot), used an additional 535/70 band-pass filter (Chroma HQ535/70 M), and acquired the data with a 50 ms exposure time. The use of eYFP required initial bleaching and shelving of fluorophores into the dark state by the illumination laser until separated single molecules were observed. Imaging continued until few molecules were observed returning from the dark state (∼15,000 frames).
For PAINT, we used a peak intensity of 1.1 kW/cm2, filtered the emission with a 590/60 band-pass filter, and imaged the single molecules with a 30 ms integration time. The PAINT dye was introduced by pipetting 20 μL of dye solution (3.5 nM of Nile red or 2.2 μM of DCDHF-tail in PBS buffer) onto the coverslip near the agarose pad. The cell positions were monitored by white light to ensure minimal sample perturbation while the dye was deposited, with the fiduciary markers providing confirmation. PAINT imaging began immediately after dye deposition and continued for 25,000 frames.
Power intensities were experimentally optimized in an attempt to maximize the signal-to-background ratio, and hence the localization precision, in each imaging frame. The precise effect of intensity upon precision is controlled by various fluorophore-dependent parameters (e.g., binding kinetics of the PAINT fluorophore, dark state shelving kinetics).
SPRAIPAINT Image Analysis.
The 3D positions of single molecules exhibiting the DH-PSF were analyzed using custom software written in MATLAB (MathWorks, SI Text). In brief, the code identifies images of the DH-PSF within each frame of fluorescence data using known templates (Fig. S4) and then fits each of them to a double Gaussian function (Fig. S5). The lateral xy position of a single molecule is computed from the midpoint between the two fitted Gaussians, and the axial z position is computed from the angle of the line between the two Gaussians relative to a fixed horizontal line using a calibration curve (Fig. 1C). Lateral shift of the DH-PSF as a function of z position is also removed using a similar calibration curve (Fig. S6). Drift correction was applied to each localization by tracking the movements of 2–3 fiduciary beads within the field of view (Fig. S7 and SI Text). The precision of each localization was computed directly from the number of photons detected and the measured background (20) (SI Text).
The calibration curve was measured by imaging fluorescent beads (565/580 carboxylate-modified FluoSpheres, Molecular Probes, 100 nm) in agarose gel. The rotation and translation of the DH-PSF was measured while translating the objective lens in 50-nm steps along the z-direction using a piezoelectric objective scanner (Physik Instrumente PIFOC P-721.CDQ with E-625.CO controller). More details on the calibration of the DH-PSF imaging system can be found in previous work (20, 54).
Because of the index mismatch between immersion oil (n = 1.518) and C. crescentus cells (n ≈ 1.3), the true z position of a fluorescent molecule differs from the measured z position in our experiments (55, 56). Because we place the focal plane of the microscope approximately 300 nm from the glass-water interface and image single molecules within 300 nm of this focal plane, the focal shift is mostly linear (52, 57). We therefore use a z correction factor of nwater/noil = 0.88 to convert measured z positions to true z positions, and this correction factor is accurate enough to produce circular membrane cross sections in our 3D data (Fig. 4C and Fig. 5B). A more precise correction factor may be required if measurements are taken further away from the glass-water interface.
The location of each cell’s central axis was computed using a custom MATLAB script (SI Text). Briefly, the 3D PAINT localizations from each individual cell were isolated and rotated to align as closely as possible with the x axis. The localizations were then separated into transverse yz slices along the x axis (300-nm thick, sampled every 100 nm). In each slice, the best position for the cell’s central axis was calculated by minimizing the standard deviation of the distances between the best center position and each localization in the slice. By sectioning the PAINT localizations in this manner, a smooth representation of the cell’s central axis was readily obtained (Fig. 4A and Fig. 5A).
The superresolution images are the sum of all fitted positions, where the long integration times of 30 ms and 50 ms rejected quickly diffusing molecules. When plotting data from individual cells, localizations from nearby cells were removed for clarity. All scatter plots used 20-nm diameter circles to plot localizations. Two-dimensional projections of 3D data were plotted using a custom macro written in ImageJ (http://rsb.info.nih.gov/ij/). Each localization was plotted as an identical 2D Gaussian spot with a width σ of 20 nm. Three-dimensional perspective renders were generated using a custom script written in MATLAB. Again, each localization was plotted as an identical 3D Gaussian spot with width σ of 20 nm. For simulating the diffraction-limited 3D PSF, each localization was plotted as an identical 3D Gaussian spot with widths σx = σy = 100 nm and σz = 400 nm.
Photophysical Measurements of Nile Red, DCDHF-Tail, and Rhodamine 6G.
The shift in absorbance and emission of DCDHF-tail in PBS upon addition of wild-type C. crescentus cells was measured on a Cary 6000i UV-visible-near infrared spectrophotometer (Varian) and a Fluorolog 3 (Jobin–Yvon Horiba) fluorimeter with an excitation wavelength of 480 nm and standard 1-cm path length cuvettes. The cells and dye were incubated for 10 min to ensure equilibrium was reached. Final spectra subtract the absorbance and emission from the cells only.
The effect of viscosity on the fluorescence from DCDHF-tail, Nile red and Rhodamine 6G was quantified by measuring the emission spectra in varying glycerol-water mixtures. Emission spectra were measured on a FluoroMax-4 spectrofluorometer (Jobin-Yvon Horiba), with excitation at 480 nm and the same OD of fluorophore. The OD was kept below 0.1 to avoid inner filter effects. The integrated fluorescence areas were normalized by the total fluorescence in water.
The dynamic viscosity of the glycerol-water mixtures was estimated using the following procedure (58). Briefly, the dynamic viscosity μ [centipoise (cP) or 0.001 Ns/m2] is related to the two component viscosities in power form:
| [3] |
where μg is the viscosity of glycerol, μw is the viscosity of water, and A = ln(μw/μg). In addition,
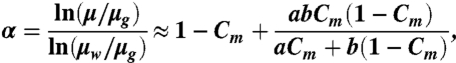 |
[4] |
where Cm is the glycerol concentration in mass, and a and b are temperature-dependent coefficients, empirically given by a = 0.705 - 0.0017T, a = 0.705 - 0.0017T, and b = (4.9 + 0.036T)a2.5. At 20 °C, μw = 1.0049 cP and μg = 1,413.8 cP.
Supplementary Material
Acknowledgments.
We acknowledge R. Piestun for providing the DH-PSF phase mask design. We thank Dr. Randall Goldsmith and Michael Thompson for helpful discussions and Scott Hsieh for assistance with the double helix fitting and visualization code. This work was supported by National Institute of General Medical Sciences Grants R01GM085437 (to W.E.M.), R01GM032506 (to L.S.), and R01GM086196 (to W.E.M., R.J.T., and L.S.), a National Science Foundation Graduate Research Fellowship and 3Com Corporation Stanford Graduate Fellowship (M.D.L.), and a National Institutes of Health/National Institute of General Medical Sciences Fellowship F32GM088966-2 (to J.P.).
Footnotes
The authors declare no conflict of interest.
See Author Summary on page 18577.
This article contains supporting information online at www.pnas.org/lookup/suppl/doi:10.1073/pnas.1114444108/-/DCSupplemental.
References
- 1.Larabell CA, Le Gros MA. X-ray tomography generates 3-D reconstructions of the yeast, Saccharomyces cerevisiae, at 60-nm resolution. Mol Biol Cell. 2004;15:957–962. doi: 10.1091/mbc.E03-07-0522. [DOI] [PMC free article] [PubMed] [Google Scholar]
- 2.Hohmann-Marriott M, et al. Nanoscale 3D cellular imaging by axial scanning transmission electron tomography. Nat Methods. 2009;6:729–731. doi: 10.1038/nmeth.1367. [DOI] [PMC free article] [PubMed] [Google Scholar]
- 3.Schermelleh L, et al. Subdiffraction multicolor imaging of the nuclear periphery with 3D structured illumination microscopy. Science. 2008;320:1332–1336. doi: 10.1126/science.1156947. [DOI] [PMC free article] [PubMed] [Google Scholar]
- 4.Donnert G, et al. Macromolecular-scale resolution in biological fluorescence microscopy. Proc Natl Acad Sci USA. 2006;103:11440–11445. doi: 10.1073/pnas.0604965103. [DOI] [PMC free article] [PubMed] [Google Scholar]
- 5.Betzig E, et al. Imaging intracellular fluorescent proteins at nanometer resolution. Science. 2006;313:1642–1645. doi: 10.1126/science.1127344. [DOI] [PubMed] [Google Scholar]
- 6.Hess ST, Girirajan TPK, Mason MD. Ultra-high resolution imaging by fluorescence photoactivation localization microscopy. Biophys J. 2006;91:4258–4272. doi: 10.1529/biophysj.106.091116. [DOI] [PMC free article] [PubMed] [Google Scholar]
- 7.Heilemann M, et al. Subdiffraction-resolution fluorescence imaging with conventional fluorescent probes. Angew Chem Int Ed. 2008;47:6172–6176. doi: 10.1002/anie.200802376. [DOI] [PubMed] [Google Scholar]
- 8.Rust MJ, Bates M, Zhuang X. Sub-diffraction-limit imaging by stochastic optical reconstruction microscopy (STORM) Nat Methods. 2006;3:793–795. doi: 10.1038/nmeth929. [DOI] [PMC free article] [PubMed] [Google Scholar]
- 9.Sharonov A, Hochstrasser RM. Wide-field subdiffraction imaging by accumulated binding of diffusing probes. Proc Natl Acad Sci USA. 2006;103:18911–18916. doi: 10.1073/pnas.0609643104. [DOI] [PMC free article] [PubMed] [Google Scholar]
- 10.Kuo C, Hochstrasser RM. Super-resolution microscopy of lipid bilayer phases. J Am Chem Soc. 2011;133:4664–4667. doi: 10.1021/ja1099193. [DOI] [PMC free article] [PubMed] [Google Scholar]
- 11.Biteen JS, et al. Super-resolution imaging in live Caulobacter crescentus cells using photoswitchable EYFP. Nat Methods. 2008;5:947–949. doi: 10.1038/NMETH.1258. [DOI] [PMC free article] [PubMed] [Google Scholar]
- 12.Folling J, et al. Fluorescence nanoscopy by ground-state depletion and single-molecule return. Nat Methods. 2008;5:943–945. doi: 10.1038/nmeth.1257. [DOI] [PubMed] [Google Scholar]
- 13.Steinhauer C, Forthmann C, Vogelsang J, Tinnefeld P. Superresolution microscopy on the basis of engineered dark states. J Am Chem Soc. 2008;130:16840–16841. doi: 10.1021/ja806590m. [DOI] [PubMed] [Google Scholar]
- 14.Huang B, Wang W, Bates M, Zhuang X. Three-dimensional super-resolution imaging by stochastic optical reconstruction microscopy. Science. 2008;319:810–813. doi: 10.1126/science.1153529. [DOI] [PMC free article] [PubMed] [Google Scholar]
- 15.Pavani SRP, et al. Three-dimensional, single-molecule fluorescence imaging beyond the diffraction limit by using a double-helix point spread function. Proc Natl Acad Sci USA. 2009;106:2995–2999. doi: 10.1073/pnas.0900245106. [DOI] [PMC free article] [PubMed] [Google Scholar]
- 16.Lew MD, Lee SF, Badieirostami M, Moerner WE. Corkscrew point spread function for far-field three-dimensional nanoscale localization of pointlike objects. Opt Lett. 2011;36:202–204. doi: 10.1364/OL.36.000202. [DOI] [PMC free article] [PubMed] [Google Scholar]
- 17.Juette MF, et al. Three-dimensional sub-100 nm resolution fluorescence microscopy of thick samples. Nat Methods. 2008;5:527–529. doi: 10.1038/nmeth.1211. [DOI] [PubMed] [Google Scholar]
- 18.Tang J, Akerboom J, Vaziri A, Looger LL, Shank CV. Near-isotropic 3D optical nanoscopy with photon-limited chromophores. Proc Natl Acad Sci USA. 2010;107:10068–10073. doi: 10.1073/pnas.1004899107. [DOI] [PMC free article] [PubMed] [Google Scholar]
- 19.Mlodzianoski MJ, Juette MF, Beane GL, Bewersdorf J. Experimental characterization of 3D localization techniques for particle-tracking and super-resolution microscopy. Opt Express. 2009;17:8264–8277. doi: 10.1364/oe.17.008264. [DOI] [PubMed] [Google Scholar]
- 20.Thompson MA, Lew MD, Badieirostami M, Moerner WE. Localizing and tracking single nanoscale emitters in three dimensions with high spatiotemporal resolution using a double-helix point spread function. Nano Lett. 2010;10:211–218. doi: 10.1021/nl903295p. [DOI] [PMC free article] [PubMed] [Google Scholar]
- 21.Shtengel G, et al. Interferometric fluorescent super-resolution microscopy resolves 3D cellular ultrastructure. Proc Natl Acad Sci USA. 2009;106:3125–3130. doi: 10.1073/pnas.0813131106. [DOI] [PMC free article] [PubMed] [Google Scholar]
- 22.Aquino D, et al. Two-color nanoscopy of three-dimensional volumes by 4Pi detection of stochastically switched fluorophores. Nat Methods. 2011;8:353–359. doi: 10.1038/nmeth.1583. [DOI] [PubMed] [Google Scholar]
- 23.Greenfield D, et al. Self-organization of the Escherichia coli chemotaxis network imaged with super-resolution light microscopy. PLoS Biol. 2009;7:e1000137. doi: 10.1371/journal.pbio.1000137. [DOI] [PMC free article] [PubMed] [Google Scholar]
- 24.Ptacin JL, et al. A spindle-like apparatus guides bacterial chromosome segregation. Nat Cell Biol. 2010;12:791–798. doi: 10.1038/ncb2083. [DOI] [PMC free article] [PubMed] [Google Scholar]
- 25.Lee SF, Thompson MA, Schwartz MA, Shapiro L, Moerner WE. Super-resolution imaging of the nucleoid-associated protein HU in Caulobacter crescentus. Biophys J. 2011;100:L31–L33. doi: 10.1016/j.bpj.2011.02.022. [DOI] [PMC free article] [PubMed] [Google Scholar]
- 26.Bates M, Huang B, Dempsey GT, Zhuang X. Multicolor super-resolution imaging with photo-switchable fluorescent probes. Science. 2007;317:1749–1753. doi: 10.1126/science.1146598. [DOI] [PMC free article] [PubMed] [Google Scholar]
- 27.Shroff H, et al. Dual-color superresolution imaging of genetically expressed probes within individual adhesion complexes. Proc Natl Acad Sci USA. 2007;104:20308–20313. doi: 10.1073/pnas.0710517105. [DOI] [PMC free article] [PubMed] [Google Scholar]
- 28.Wang H, Lu Z, Lord SJ, Moerner WE, Twieg RJ. Modifications of DCDHF single molecule fluorophores to impart water solubility. Tetrahedron Lett. 2007;48:3471–3474. doi: 10.1016/j.tetlet.2007.03.026. [DOI] [PMC free article] [PubMed] [Google Scholar]
- 29.Yildiz A, et al. Myosin V walks hand-over-hand: Single fluorophore imaging with 1.5-nm localization. Science. 2003;300:2061–2065. doi: 10.1126/science.1084398. [DOI] [PubMed] [Google Scholar]
- 30.Kim SY, Gitai Z, Kinkhabwala A, Shapiro L, Moerner WE. Single molecules of the bacterial actin MreB undergo directed treadmilling motion in Caulobacter crescentus. Proc Natl Acad Sci USA. 2006;103:10929–10934. doi: 10.1073/pnas.0604503103. [DOI] [PMC free article] [PubMed] [Google Scholar]
- 31.Pavani SRP, Piestun R. Three dimensional tracking of fluorescent microparticles using a photon-limited double-helix response system. Opt Express. 2008;16:22048–22057. doi: 10.1364/oe.16.022048. [DOI] [PubMed] [Google Scholar]
- 32.Pavani SRP, Greengard A, Piestun R. Three-dimensional localization with nanometer accuracy using a detector-limited double-helix point spread function system. Appl Phys Lett. 2009;95:021103. [Google Scholar]
- 33.Ausmees N, Kuhn JR, Jacobs-Wagner C. The bacterial cytoskeleton: An intermediate filament-like function in cell shape. Cell. 2003;115:705–713. doi: 10.1016/s0092-8674(03)00935-8. [DOI] [PubMed] [Google Scholar]
- 34.Charbon G, Cabeen MT, Jacobs-Wagner C. Bacterial intermediate filaments: In vivo assembly, organization, and dynamics of crescentin. Genes Dev. 2009;23:1131–1144. doi: 10.1101/gad.1795509. [DOI] [PMC free article] [PubMed] [Google Scholar]
- 35.Dickson RM, Cubitt AB, Tsien RY, Moerner WE. On/Off blinking and switching behavior of single green fluorescent protein molecules. Nature. 1997;388:355–358. doi: 10.1038/41048. [DOI] [PubMed] [Google Scholar]
- 36.Ambrose WP, Basché T, Moerner WE. Detection and spectroscopy of single pentacene molecules in a p-terphenyl crystal by means of fluorescence excitation. J Chem Phys. 1991;95:7150–7163. [Google Scholar]
- 37.Hell SW, Kroug M. Ground-state-depletion fluorscence microscopy: A concept for breaking the diffraction resolution limit. Appl Phys B: Lasers Opt. 1995;60:495–497. [Google Scholar]
- 38.Schwille P, Kummer S, Heikal AA, Moerner WE, Webb WW. Fluorescence correlation spectroscopy reveals fast optical excitation-driven intermolecular dynamics of yellow fluorescent proteins. Proc Natl Acad Sci USA. 2000;97:151–156. doi: 10.1073/pnas.97.1.151. [DOI] [PMC free article] [PubMed] [Google Scholar]
- 39.Gurskaya NG, et al. Engineering of a monomeric green-to-red photoactivatable fluorescent protein induced by blue light. Nat Biotechnol. 2006;24:461–465. doi: 10.1038/nbt1191. [DOI] [PubMed] [Google Scholar]
- 40.McKinney SA, Murphy CS, Hazelwood KL, Davidson MW, Looger LL. A bright and photostable photoconvertible fluorescent protein. Nat Methods. 2009;6:131–133. doi: 10.1038/nmeth.1296. [DOI] [PMC free article] [PubMed] [Google Scholar]
- 41.Subach FV, et al. Photoactivatable mCherry for high-resolution two-color fluorescence microscopy. Nat Methods. 2009;6:153–159. doi: 10.1038/nmeth.1298. [DOI] [PMC free article] [PubMed] [Google Scholar]
- 42.Poindexter JS. Biological properties and classification of the caulobacter group. Microbiol Mol Biol Rev. 1964;28:231–295. doi: 10.1128/br.28.3.231-295.1964. [DOI] [PMC free article] [PubMed] [Google Scholar]
- 43.Skerker JM, Laub MT. Cell-cycle progression and the generation of asymmetry in Caulobacter crescentus. Nat Rev Microbiol. 2004;2:325–337. doi: 10.1038/nrmicro864. [DOI] [PubMed] [Google Scholar]
- 44.Laub MT, Shapiro L, McAdams HH. Systems biology of caulobacter. Annu Rev Genet. 2007;41:429–441. doi: 10.1146/annurev.genet.41.110306.130346. [DOI] [PubMed] [Google Scholar]
- 45.Engelhardt J, et al. Molecular orientation affects localization accuracy in superresolution far-field fluorescence microscopy. Nano Lett. 2011;11:209–213. doi: 10.1021/nl103472b. [DOI] [PubMed] [Google Scholar]
- 46.Willets KA, Callis PR, Moerner WE. Experimental and theoretical investigations of environmentally sensitive single-molecule fluorophores. J Phys Chem B. 2004;108:10465–10473. [Google Scholar]
- 47.Willets KA, Nishimura SY, Schuck PJ, Twieg RJ, Moerner WE. Nonlinear optical chromophores as nanoscale emitters for single-molecule spectroscopy. Acc Chem Res. 2005;38:549–556. doi: 10.1021/ar0401294. [DOI] [PubMed] [Google Scholar]
- 48.Lord SJ, et al. Azido push-pull fluorogens photoactivate to produce bright fluorescent labels. J Phys Chem B. 2010;114:14157–14167. doi: 10.1021/jp907080r. [DOI] [PMC free article] [PubMed] [Google Scholar]
- 49.Nishimura SY, et al. Diffusion of lipid-like single-molecule fluorophores in the cell membrane. J Phys Chem B. 2006;110:8151–8157. doi: 10.1021/jp0574145. [DOI] [PMC free article] [PubMed] [Google Scholar]
- 50.Kim SY, et al. Probing the sequence of conformationally induced polarity changes in the molecular chaperonin GroEL with fluorescence spectroscopy. J Phys Chem B. 2005;109:24517–24525. doi: 10.1021/jp0534232. [DOI] [PMC free article] [PubMed] [Google Scholar]
- 51.Badieirostami M, Lew MD, Thompson MA, Moerner WE. Three-dimensional localization precision of the double-helix point spread function versus astigmatism and biplane. Appl Phys Lett. 2010;97:161103. doi: 10.1063/1.3499652. [DOI] [PMC free article] [PubMed] [Google Scholar]
- 52.Huang B, Jones SA, Brandenburg B, Zhuang X. Whole-cell 3D STORM reveals interactions between cellular structures with nanometer-scale resolution. Nat Methods. 2008;5:1047–1052. doi: 10.1038/nmeth.1274. [DOI] [PMC free article] [PubMed] [Google Scholar]
- 53.Thanbichler M, Iniesta AA, Shapiro L. A comprehensive set of plasmids for vanillate- and xylose-inducible gene expression in Caulobacter crescentus. Nucleic Acids Res. 2007;35:e137. doi: 10.1093/nar/gkm818. [DOI] [PMC free article] [PubMed] [Google Scholar]
- 54.Lew MD, Thompson MA, Badieirostami M, Moerner WE. In vivo three-dimensional superresolution fluorescence tracking using a double-helix point spread function. Proc SPIE. 2010;7571:75710Z. doi: 10.1117/12.842608. [DOI] [PMC free article] [PubMed] [Google Scholar]
- 55.Hell SW, Reiner G, Cremer C, Stelzer EHK. Aberrations in confocal fluorescence microscopy induced by mismatches in refractive index. J Microsc. 1993;169:391–405. [Google Scholar]
- 56.Neuman KC, Abbondanzieri EA, Block SM. Measurement of the effective focal shift in an optical trap. Opt Lett. 2005;30:1318–1320. doi: 10.1364/ol.30.001318. [DOI] [PMC free article] [PubMed] [Google Scholar]
- 57.Deng Y, Shaevitz JW. Effect of aberration on height calibration in three-dimensional localization-based microscopy and particle tracking. Appl Opt. 2009;48:1886–1890. doi: 10.1364/ao.48.001886. [DOI] [PubMed] [Google Scholar]
- 58.Cheng N. Formula for the viscosity of a glycerol-water mixture. Ind Eng Chem Res. 2008;47:3285–3288. [Google Scholar]
