

Abstract
Cytochrome P450 (P450) 3A4 (CYP3A4) is the most abundant P450 protein in human liver and intestine, and is highly inducible by a variety of drugs and other compounds. The P450 catalytic cycle is known to uncouple and release reactive oxygen species (ROS), but the effects of ROS from P450 and other enzymes in the endoplasmic reticulum has been poorly studied from the perspective of effects on cell biology. In this study, we express low levels of CYP3A4 in HepG2 cells, a human hepatocarcinoma cell line, and examine effects on intracellular levels of ROS and on the secretion of a variety of growth factors that are important in extracellular communication. Using the redox sensitive dye, RedoxSensor Red, we demonstrate that CYP3A4 expression increases levels of ROS in viable cells. A custom ELISA microarray platform was employed to demonstrate that expression of CYP3A4 increased secretion of amphiregulin, intracellular adhesion molecule 1, matrix metalloprotease 2, platelet-derived growth factor (PDGF) and vascular endothelial growth factor but suppressed secretion of CD14. The antioxidant, N-acetylcysteine, suppressed all P450-dependent changes in protein secretion except for CD14. Quantitative RT-PCR demonstrated that changes in protein secretion were consistently associated with corresponding changes in gene expression. Inhibition of the NF-κB pathway blocked P450 effects on PDGF secretion. CYP3A4 expression also altered protein secretion in human mammary epithelial cells and C10 mouse lung cells. Overall, these results suggest that increased ROS production in the endoplasmic reticulum alters the secretion of proteins that have key roles in paracrine and autocrine signaling.
INTRODUCTION
Cytochrome P450 (P450) 3A4 (CYP3A4) is the most abundant P450 in human intestine and liver, comprising about 70% and 30%, respectively, of the total cytochrome P450 present in these tissues [1]. Although CYP3A4 is basally expressed at high levels in human liver, this enzyme can be transcriptionally induced by agents that activate the pregnane X receptor [2, 3]. Because of its abundance and broad substrate specificity, CYP3A4 contributes to the metabolism of approximately half of all prescribed drugs [4]. Many drugs, as well as compounds found in foods such as grapefruit, inhibit this P450 [5].
An early study that utilized reconstituted enzyme systems demonstrated that the P450 catalytic cycle can uncouple to produce hydrogen peroxide, superoxide anion, or water [6]. This study did not examine any CYP3A enzymes, presumably because conditions for purifying and reconstituting active CYP3A enzymes had yet to be reported [7]. Even so, we have used microsomal and reconstituted enzyme systems that contain active CYP3A to demonstrate that CYP3A activity is associated with protein aggregation, lipid peroxidation, and hydroxynonenal-protein conjugation [8, 9]. These effects could be reversed by antioxidants and a selective CYP3A substrate, consistent with the concept that CYP3A enzymes generate significant amounts of reactive oxygen species (ROS) in these non-cellular systems.
It has been suggested that ROS have an important roles in the induction and progression of all types of liver disease [10]. The primary sources of ROS in the liver are believed to be the mitochondria and P450 enzyme systems [10]. ROS production in mitochondria has been extensively studied but the effects of ROS production in most other organelles has not been as well characterized. An exception is ROS production by cytochrome P450 2E1 (CYP2E1), which resides primarily in the ER. Studies on this alcohol-inducible P450 suggest that under conditions that enhance oxidative stress, such as elevated levels of free iron, CYP2E1 expression further increases oxidative stress and cellular toxicity [11, 12]. Even so, we know of no studies that examine the effects of P450-generation of ROS on normal cell biology, such as might be seen following the subtle disruption of normal cell-signaling pathways by modest increases in ROS. These types of effects may be observable under normal cellular redox conditions, but are much more difficult to identify under conditions of more pronounced oxidative stress.
In the current study, we examine the effects of ROS production by CYP3A4 when this protein is expressed at levels that are well below those found in the human liver. These studies were undertaken using HepG2 cells under standard cell culture conditions, without any enhancement of oxidative stress. We examine the effects of the P450-associated ROS on the secretion of proteins that have important roles in liver cancer. The results of this study suggest a novel process by which ROS could activate a variety of key signaling pathways associated with liver cancer. Overall, the current study suggests that ROS effects on protein secretion could impact several processes involved in a variety of human diseases, including angiogenesis, matrix metalloprotease secretion, and cell-to-cell communication.
METHODS
Cell Culture and Determination of Intracellular ROS Levels
HepG2 cells were cultured and transduced with Ad3A4 or AdRSV, as described previously [13, 14], except that cells were cultured using a Nunc 8-well chamber slide to facilitate ROS detection using fluorescence microscopy. HepG2 cells were transduced with either Ad3A4 or AdRSV (as vector control) using an MOI of 25. In order to measure intracellular ROS levels, cells were cultured with Redox-Sensor Red (InVitrogen, Carlsbad, CA), which is a nonfluorescent compound that readily diffuses into cells and is converted to a fluorescent, non-permeable, product (Ex540/Em600) upon oxidation. The HepG2 cells were incubated with 5 μM RedoxSensor Red for 10 min and images were immediately captured using a 40× objective. To quantify average fluorescence intensity, the data were pooled from 4 independent cell-culture chambers per treatment (three independent fields of view/chamber; ≥ 100 cells total), with background (i.e., the fluorescent signal when no dye was added) subtraction. Fluorescence values were quantified using Metamorph software (Molecular Devices, Sunnyvale, CA) using equal exposure times for all analyses.
Human mammary epithelial cells (HMEC) and mouse lung C10 cells were cultured as reported previously [15, 16]. These cells were treated with the adenoviruses as described for the HepG2 cells. All cells lines were grown to confluence for these studies.
ELISA Microarray Analysis
Quantitative, multiplexed, sandwich ELISA microarray analysis was undertaken as described previously [17, 18]. We have previously demonstrated that the multiplexed assays used in the current study do not have any detectable cross-assay interference, and that this analytical platform can quantitatively detect purified antigens spiked into human sera [17]. Data from these studies was analyzed using the Protein Microarray Analysis Tool (freely available at www.pnl.gov/statistics/ProMAT/), a custom bioinformatics tool that we developed specifically for this purpose [19].
Analysis of mRNA
Total RNA isolation and quantitative assessment of mRNA expression were performed by quantitative RT-PCR, as described previously [13]. We have also demonstrated that these protocols do not have detectable levels of genomic or viral DNA contamination, even when using PCR [13]. Quantitative RT-PCR data for transcripts were normalized to cyclophilin A (CYPH) transcript levels [20]. The RT-PCR primers used for this analysis are shown in Table 1.
Table 1.
Primers for quantitative RT-PCR.
| Target | Forward primer (5′→3′) | Reverse primer (5′→3′) | Product | GenBank no. |
|---|---|---|---|---|
| AmR | CGGAGAATGCAAATATATAGAGCAC | CACCGAAATATTCTTGCTGACA | 68 bp | NM_001657 |
| CD14 | GTTCGGAAGACTTATCGACCAT | ACAAGGTTCTGGCGTGGT | 95 bp | NM_000591 |
| CYPH | GCATACGGGTCCTGGCATCTTGTCC | ATGGTGATCTTCTTGCTGGTCTTGC | 201 bp | NM_021130 |
| ICAM1 | CCTTCCTCACCGTGTACTGG | AGCGTAGGGTAAGGTTCTTGC | 90 bp | NM_000201 |
| MMP2 | ATAACCTGGATGCCGTCGT | AGGCACCCTTGAAGAAGTAGC | 63 bp | NM_004530 |
| PDGF | ACACGAGCAGTGTCAAGTGC | ATTCCACCTTGGCCACCT | 69 bp | NM_002607 |
| VEGF | CTACCTCCACCATGCCAAGT | CCACTTCGTGATGATTCTGC | 74 bp | NM_001025370 |
Statistics
For multiple treatment groups, statistical differences between all treatment groups were initially determined by ANOVA and then delineated using the Fisher’s test using StatView 5.0.1 software (SAS Institute). When only two treatment groups were present in a study, the data were analyzed using a two-tailed Student’s t-test. A significance level of 0.05 was used in all cases.
RESULTS AND DISCUSSION
As is typical of established cell lines, HepG2 cells do not normally express significant levels of CYP3A4 protein or other common drug-metabolizing P450s [13, 21]. We have previously used immunoblot analysis to characterize the expression levels of the CYP3A4 proteins in HepG2 cells under transfection conditions that were identical to those used in this study [13]. This prior study demonstrated that an MOI of 25, as was consistently used in this study, produces cellular levels of CYP3A4 protein that are only a few percent of those found in normal human hepatocytes [13]. Thus, although we increase the expression of CYP3A4 in the HepG2 cells to detectable levels, the amount of CYP3A4 in the HepG2 cells is clearly not overexpressed compared to the levels normally present in human liver. In addition, we previously demonstrated that the CYP3A4 protein is localized to the ER of the HepG2 cells, the same subcellular location as in the human liver [13]. This conclusion was supported by the combined use of immunohistochemistry that employed confocal microscopy, and by immunoblot analysis of subcellular fractions [13].
CYP3A4 alters cellular redox status
We used Redox-Sensor Red to evaluate the redox status of the HepG2 cells in the presence and absence of CYP3A4 transfection. Redox-Sensor Red is a cell permeable compound that becomes fluorescent and loses it membrane permeability after oxidation [22]. This compound is oxidized by a broad spectrum of reactive species, including superoxide and hydrogen peroxide [22], which are produced as a result of P450 uncoupling. CYP3A4 expression increases cellular fluorescent of Redox-Sensor Red by approximately 70% compared to cells treated with the control virus (Fig. 1). This is the first direct evidence that low-level CYP3A4 expression alters cellular redox status.
Fig. 1. Expression of CYP3A4 in HepG2 cells increases intracellular ROS levels.
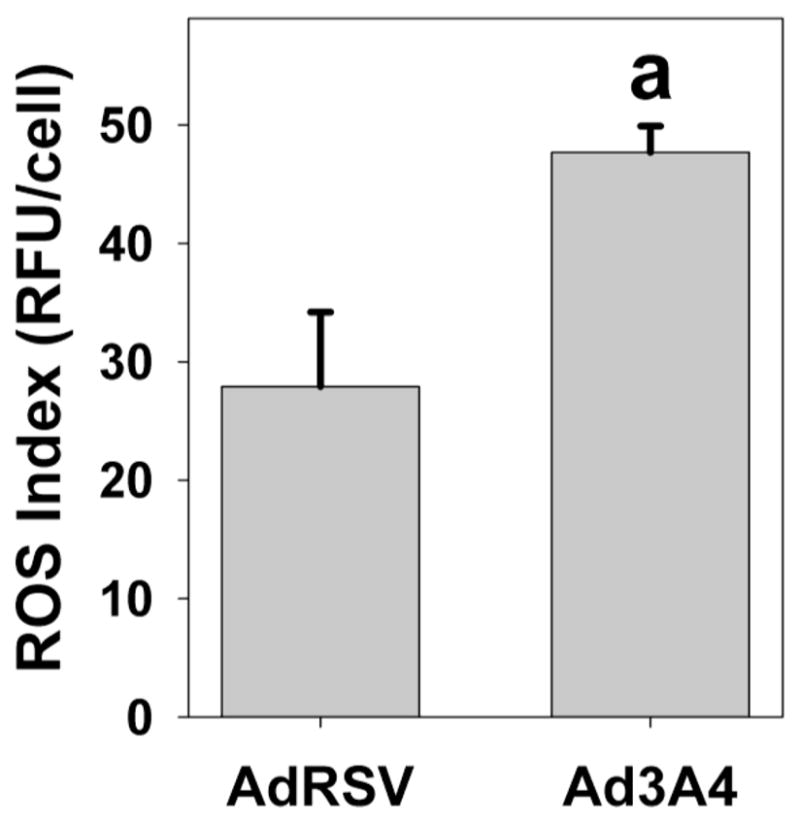
HepG2 cells were infected with control adenovirus (AdRSV) or adenovirus containing CYP3A4 (Ad3A4) at MOIs of 25, as described in the Methods. Cells were subsequently treated with 5 μM RedoxSensor Red, which is not fluorescent until oxidized, before quantitative analysis of the fluorescent signal by microscopy. Columns and crossbars represent the mean and SE, respectively, of the relative fluorescent units (RFU) per cell for over 100 cells/group. aData significantly different from AdRSV group (p<0.05).
CYP3A4 alters protein secretion in an antioxidant-sensitive manner
We have developed an ELISA microarray platform that can quantify a variety of proteins that are important in the development and progression of human liver diseases [17]. We used this ELISA microarray platform to measure proteins secreted by the HepG2 cells into the culture medium. This analysis demonstrated that low-level CYP3A4 expression increased the secretion of amphiregulin (AmR), an EGFR ligand, platelet-derived and vascular endothelial growth factors (PDGF and VEGF, respectively), both of which induce angiogenesis, matrix metalloprotease 2 (MMP2), and intracellular adhesion molecule 1 (ICAM1); but decreased the secretion of endotoxin receptor, CD14 (Fig. 2). In order to determine the role of ROS in the P450-dependent changes in protein secretion, the HepG2 cells were treated with the antioxidant, N-acetylcysteine (NAC; 5 mM). In the control, AdRSV-treated, HepG2 cells, NAC treatment was without effect on protein secretion except for a suppression of PDGF secretion (Fig. 2). In contrast, in the CYP3A4-expressing cells, NAC suppressed secretion of all the proteins that were more actively secreted in the CYP3A4-expressing cells. Overall, these results are consistent with the concept that CYP3A4 primarily modifies protein secretion through pathways that are sensitive to intracellular ROS levels. In contrast, changes in CD14 secretion in response to CYP3A4 expression were not altered by NAC treatment. Thus, of the proteins examined only CD14 secretion appears to be regulated by a process other than NAC-sensitive ROS production.
Fig. 2. CYP3A4 expression alters the secretion of key autocrine and paracrine factors.

HepG2 cells were infected with control adenovirus (AdRSV) or adenovirus encoding for CYP3A4 (Ad3A4) at MOIs of 25, in the presence (NAC) or absence (−) of 5 mM N-acetylcysteine. Columns and crossbars represent the mean and SE, respectively, of four replicate samples, each prepared from a seperate cell culture dish. a and b indicated that the treatment mean is statistically different (p < 0.05) from the AdRSV or the Ad3A4 group, respectively, based on ANOVA and Fisher’s test. Data are representative of duplicate studies conducted on separate days.
In order to confirm that NAC acts as an antioxidant in the HepG2 cells, we evaluated the effect of NAC treatment on RedoxSensor Red fluorescence. This experiment demonstrated that NAC partially suppresses intracellular oxidation levels whether or not cells are treated to express additional CYP3A4 (Figure 3).
Fig. 3. N-acetylcysteine decreases intracellular ROS levels.
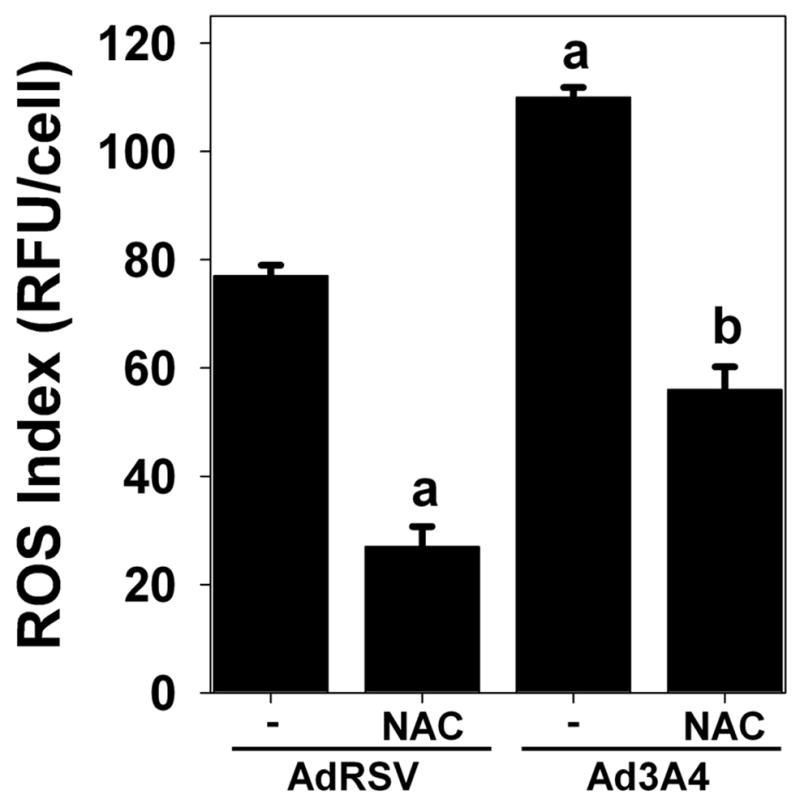
HepG2 cells were infected with control adenovirus (AdRSV) or adenovirus containing CYP3A4 (Ad3A4) at MOIs of 25, in the presence (NAC) or absence (−) of 5 mM N-acetylcysteine, as described in the Methods. Cells were subsequently treated with 5 μM RedoxSensor Red, which is not fluorescent until oxidized, before quantitative analysis of the fluorescent signal by microscopy. Columns and crossbars represent the mean and SE, respectively, of the relative fluorescent units (RFU) per cell for over 100 cells/group. aData significantly different from AdRSV group (p<0.05). bData significantly different from Ad3A4 group (p<0.05).
Previous studies with P450 substrates that used in vitro systems have demonstrated that these compounds can increase, decrease or have no affect on ROS production by these enzymes (reviewed in [23]). Using a reconstituted CYP3A4 enzyme system, we previously demonstrated that clotrimazole, a CYP3A4 substrate, reduced oxidative protein modification, suggesting that CYP3A4 substrates reduce ROS generation. We therefore evaluated the effects of several CYP3A4 substrates and inhibitors on protein secretion, including clotrimazole, troleandomycin, ketoconazole and nicardipine. These compounds did not have any significant affect on protein secretion, as measured by our ELISA microarray platform, in the HepG2 cells treated with Ad3A4 at an MOI of 25 (data not shown).
These results provide insight into an alternative mechanism whereby low-level ROS production could affect hepatocarcinogenesis. For example, ROS are known to indirectly activate the EGFR [24], but the mechanism associated with this activation is poorly understood. In cultured human mammary epithelial cells, we previously demonstrated that autocrine secretion of EGFR ligands is a common mechanism by which a variety of growth factors stimulate cell growth and migration [25, 26]. Since AmR is an EGFR ligand, its secretion (which is mediated by proteolytic shedding from the cell surface) in response to intracellular ROS production suggests a mechanism by which ROS could indirectly activate the EGFR pathway. It has previously been demonstrated that ROS production associated with mitochondrial dysfunction also increases AmR expression and secretion in HepG2 cells [27], suggesting that this process is not dependent on the intracellular source of the ROS. In addition, ROS increase the expression of PDGF and VEGF in vascular endothelial cells [28]. Since hypoxia increases intracellular ROS levels and thereby alters related cell-signaling pathways [29], the increase in secretion of these angiogenic factors in the HepG2 cells may represent an adaptive response to ROS and hypoxia that is present in many cell types.
Gene Expression Correlates with Protein Secretion
In order to examine the possibility that changes in protein secretion were due to alterations in gene expression, we used quantitative RT-PCR to measure the levels of the mRNA that encode for the secreted proteins that were regulated by CYP3A4 expression (Fig. 3). These studies demonstrate that all proteins that were secreted at higher levels in response to CYP3A4 expression also had higher levels of the corresponding mRNA; while CD14, whose secretion was decreased by CYP3A4 expression, had reduced levels of mRNA. In contrast, β-actin mRNA levels were not altered by treatment (data not shown). The coordinated changes in protein secretion and corresponding mRNA levels strongly suggest that changes in gene expression are the primary mechanism for altering protein secretion in response to CYP3A4 expression.
NF-κB Activity Contributes to CYP3A4 Stimulation of PDGF Secretion
NF-κB is a transcription factor with a central role in the cellular response to ROS [30–32]. We have demonstrated that the HepG2 cells have a basal level of NF-κB activity, and that inhibition of this activity reduces the stability of CYP3A4 protein [13]. We therefore suspected that there may be a regulatory feedback loop between NF-κB and CYP3A4. To examine the role of NF-B in mediating the effects of CYP3A4 ROS generation, we treated cells with NF-κB activity inhibitor I (NAI; or [6-amino-4-(4-phenoxyphenylethylamino)quinazoline]). In contrast to the 24 h treatment with NAC, cells were only treated with NAI for 6 h. Due to the reduced time for the secreted proteins to accumulate in the conditioned media, many of the proteins that were observed after 24 h treatment were undetectable in this experiment. We found that inhibition of NF-κB resulted in a marked suppression of P450 stimulation of PDGF secretion, demonstrating that P450-dependent changes in protein secretion are influenced by NF-κB activity in some cases (Fig. 3). Although PDGF signaling is known to be mediated by ROS generated by NADPH oxidase, and this activity may be important in liver fibrosis [33], our results appears to be the first evidence that NF-κB activity regulates PDGF secretion Even so, secretion of ICAM1 and VEGF were not altered by NAI, suggesting that there are additional ROS-dependent signaling pathways that regulate protein secretion in the HepG2 cells.
Effects of CYP3A4 expression in human mammary and mouse lung epithelial cells
We also examined the effects of CYP3A4 expression on protein secretion in human mammary epithelial cells (HMEC), which were originally derived from normal (noncancerous) mammary tissue. In these studies, the CYP3A4 expression levels in the HMEC were no more than a few percent of normal human hepatocytes (data not shown). Since CYP3A4 level in breast cancer tissue approach those in the liver [34], it seems likely that HMEC CYP3A4 levels are much less than can be found in breast cancer tissue. We found that CYP3A4 expression selectively increased extracellular levels of epidermal growth factor (EGF) and transforming growth factor (TGF) and decreased secretion of MMP1 (Fig. 6B). We have previously demonstrated that the HMEC cell is responsive to autocrine signaling by secreted EGFR ligands [26]. It is also well established that EGFR activation results in endocytosis and lysosomal degradation of the receptor. Because TGFα and EGF are ligands for EGFR, we examined cellular levels of EGFR using immunoblot. Increasing levels of CYP3A4 expression progressively suppressed EGFR in the HMEC (Fig. 6A), consistent with autocrine activation of this receptor and subsequent degradation. We were unable to detect phosphotyrosine-modified EGFR in this study (data not shown), as is typical of confluent HMECs that have not been previously fasted. AmR, another EGFR ligand, was increased by CYP3A4 expression in the HepG2 cells (Fig. 4). Therefore, CYP3A4 expression alters secretion of EGFR ligands in both the HMEC and HepG2 cells and, in the HMECs at least, this process apparently results in degradation of the EGFR, presumably related to autocrine activation of this receptor.
Fig. 6. Effects of CYP3A4 expression on protein secretion in human breast and mouse lung epithelial cells.

Human mammary epithelial cells (HMEC) were treated with control adenovirus (AdRSV) at a multiplicity of infection (MOI) factor of 50 or adenovirus expressing CYP3A4 at MOI’s of 0 to 75. Mouse lung epithelial cells (C10 cells) were treated with Ad3A4 at MOI’s of 0 to 50, as indicated. A. EGF receptor (EGFR) immunoblot analysis of HMEC lysates. B. ELISA microarray analysis of HMEC culture medium. C. ELISA microarray analysis of C10 culture medium. For B and C, each data point is the mean ± SE from four samples, each of which was obtained from a different cell culture dish.
Fig. 4. Changes in protein secretion correlate with changes in gene expression.

The mRNAs for proteins that were secreted at different levels in response to CYP3A4 expression were measured using quantitative RT-PCR. Prior to RNA collection, HepG2 cells were infected with either control adenovirus (AdRSV) or adenovirus encoding for CYP3A4 (Ad3A4) at MOIs of 25. Columns and crossbars represent the mean and SE, respectively, of five replicate samples, each prepared from a separate cell culture dish. a The Ad3A4 data are statistically different (p < 0.05) from the AdRSV group based on a two-tailed t-test. Data are representative of duplicate studies conducted on separate days.
We also evaluated the effects of CYP3A4 expression on protein secretion in mouse C10 cells, which were derived from cultured primary BALB/c mouse lung cells. Because the ELISAs for human proteins typically do not react with the mouse homologs, we developed a 10-assay chip specifically for studies with mouse samples [35]. This mouse chip is primarily designed to measure secreted cytokines (no EGFR ligands), but these proteins were commonly undetectable in conditioned medium from the C10 cells. Even so, analysis of conditioned medium from C10 cells demonstrated that MMP2 protein secretion is increased in response to increasing CYP3A4 expression (Fig. 6C). MMP2 was also increased in HepG2 cells by CYP3A4 expression (Fig. 2), indicating that this protein is regulated by ROS in both human and mouse epithelial cell lines. Overall, these studies suggest that CYP3A4 alters protein secretion in a variety of mammalian epithelial cells, although the profiles of the secreted proteins may vary.
CONCLUSIONS
Comparison of microsomal ROS production by human CYPs 1A1, 1A2, 2B6 and 3A4 expressed in lymphoblasts found that CYP3A4 produced the most superoxide [36]. Subsequent studies by this same group did not support that conclusion. That is, compared to CYP2E1, CYP3A4 did not produce effects likely to be related to ROS production in HepG2 cell lines that were stably engineered to express these P450s [37]. In vivo studies on inducible P450 forms and oxidative stress, as measured by F2-isoprostane levels in tissues and urine, did not support that the rodent forms of CYP3A are active in generating ROS [38]. We have previously demonstrated that CYP3A4 produces oxidative stress, as measured by 4-hydroxynonenal protein adducts, in a reconstituted system [9]. Thus, the results of the current study, which provide direct evidence that CYP3A4 produces ROS in HepG2 cells, is generally in better agreement with prior studies on CYP3A4 in microsomes or reconstituted enzyme systems than with results from studies conducted in vivo or in cultured cells.
The understanding of the role of ROS in cell biology has changed considerably in recent years. At one time, all ROS were considered detrimental. It is now recognized that ROS are important messengers in signal transduction pathways and that intracellular levels of ROS are carefully regulated in order to maintain normal cellular homeostasis [39–45]. A variety of key cell-signaling proteins are directly regulated by ROS, including protein phosphatases 1α and 2A, Src, sarco(endo)plasmic reticulum Ca2+ ATPase and Ras [24, 46–50]. One key pathway that regulates and is regulated by intracellular ROS levels is the NF-κB pathway [30–32]. We recently demonstrated that this pathway regulates the stability of CYP3A4 protein [13], suggesting that NF-κB activity may provide a feedback mechanism that regulates ROS production by CYP3A4.
This study provides the first direct evidence that ROS formation in the ER broadly alters protein secretion. That is, our results demonstrate that the low-levels of ROS produced by CYP3A4 broadly affect the secretion of paracrine and autocrine factors, including increases in the secretion of AmR, ICAM1, MMP2, PDGF and VEGF in the HepG2 cells. The increase in the secretion of these proteins appears to be associated with ROS production, as indicated by partial suppression by the antioxidant, NAC. Altered production and secretion of these proteins in human liver is associated with a variety of diseases. Notably, all of these proteins are believed to have a mechanistic role in hepatocellular carcinoma [51, 52]. The current study appears to be the first demonstration that low-level, intracellular ROS production coordinately regulates these factors, thus suggesting a novel process by which ROS could facilitate carcinogenesis. That is, the results of this study provide novel evidence that intracellular ROS can regulate cellular and tissue function through coordinated regulation of autocrine and paracrine signaling.
Overall, this study provides the first evidence that ROS production in the ER may be an important factor regulating autocrine and paracrine signaling. Since CYP3A4 is the most abundant P450 in the human liver, and it can be sharply induced and inhibited by a variety of drugs and dietary compounds, our results raise the possibility that drug or dietary induced changes in CYP3A4 activity may affect liver function by changing intracellular ROS formation and thereby affecting cell signaling and protein secretion.
Fig. 5. NF-κB Activity is Required for CYP3A4 Induction of PDGF Secretion in HepG2 Cells.

HepG2 cells were transduced with the adenoviral vector (AdRSV) or virus expressing CYP3A4 (Ad3A4) at MOIs of 25. Fresh medium was added with or without 1 μM NF-κB Activity Inhibitor I (NAI) and medium was collected 6 h later. Columns and crossbars represent the mean and SE, respectively, for 4 individual samples, each of which was collected from a separate dish. a and b indicated that the treatment mean is statistically different (p < 0.05) from the AdRSV or the Ad3A4 group, respectively, based on ANOVA and Fisher’s test. Data are representative of duplicate studies conducted on separate days.
Highlights.
We examined the effects of low-level CYP3A4 expression in HepG2 cells.
CYP3A4 increased reactive oxygen levels in the cells
CYP3A4 altered the secretion of cancer-associated autocrine and paracrine factors
An antioxidant suppressed intracellular ROS levels and changes in protein secretion
An NFκB inhibitor suppressed secretion of platelet-derived growth factor (PDGF)
Acknowledgments
This work was supported by NIH grants CA117378 and EB006177.
ABBREVIATIONS
- Ad3A4
CYP3A4-expressing adenovirus
- AdRSV
control adenovirus vector
- AmR
amphiregulin
- CD14
monocyte differentiation antigen
- CYP2E1
cytochrome P450 2E1
- CYP3A4
cytochrome P450 3A4
- CYPH
cyclophilin A
- ER
endoplasmic reticulum
- ICAM1
intracellular adhesion molecule 1
- MMP2
matrix metalloprotease 2
- NAC
N-acetylcysteine
- NAI
NF-κB activation inhibitor I
- NF-κB
nuclear factor kappa B
- P450
cytochrome P450
- PDGF
platelet-derived growth factor
- VEGF
vascular endothelial growth factor
Footnotes
Publisher's Disclaimer: This is a PDF file of an unedited manuscript that has been accepted for publication. As a service to our customers we are providing this early version of the manuscript. The manuscript will undergo copyediting, typesetting, and review of the resulting proof before it is published in its final citable form. Please note that during the production process errors may be discovered which could affect the content, and all legal disclaimers that apply to the journal pertain.
References
- 1.Guengerich FP. Human Cytochrome P450 Enzymes. In: Ortiz de Montellano PR, editor. Cytochrome P450: Structure, Mechanisms, and Biochemistry. Plenum Press; 1995. pp. 473–535. [Google Scholar]
- 2.Kliewer SA, Moore JT, Wade L, Staudinger JL, Watson MA, Jones SA, McKee DD, Oliver BB, Willson TM, Zetterstrom RH, Perlmann T, Lehmann JM. An orphan nuclear receptor activated by pregnanes defines a novel steroid signaling pathway. Cell. 1998;92:73–82. doi: 10.1016/s0092-8674(00)80900-9. [DOI] [PubMed] [Google Scholar]
- 3.Akiyama TE, Gonzalez FJ. Regulation of P450 genes by liver-enriched transcription factors and nuclear receptors. Biochim Biophys Acta. 2003;1619:223–34. doi: 10.1016/s0304-4165(02)00480-4. [DOI] [PubMed] [Google Scholar]
- 4.Bertz RJ, Granneman GR. Use of in vitro and in vivo data to estimate the likelihood of metabolic pharmacokinetic interactions. Clin Pharmacokinet. 1997;32:210–58. doi: 10.2165/00003088-199732030-00004. [DOI] [PubMed] [Google Scholar]
- 5.Uno T, Yasui-Furukori N. Effect of grapefruit juice in relation to human pharmacokinetic study. Curr Clin Pharmacol. 2006;1:157–61. doi: 10.2174/157488406776872550. [DOI] [PubMed] [Google Scholar]
- 6.Gorsky LD, Koop DR, Coon MJ. On the stoichiometry of the oxidase and monooxygenase reactions catalyzed by liver microsomal cytochrome P-450. Products of oxygen reduction. J Biol Chem. 1984;259:6812–7. [PubMed] [Google Scholar]
- 7.Eberhart DC, Parkinson A. Cytochrome P450 IIIA1 (P450p) requires cytochrome b5 and phospholipid with unsaturated fatty acids. Arch Biochem Biophys. 1991;291:231–40. doi: 10.1016/0003-9861(91)90128-6. [DOI] [PubMed] [Google Scholar]
- 8.Zangar RC, Kimzey AL, Okita JR, Wunschel DS, Edwards RJ, Kim H, Okita RT. Cytochrome P450 3A conjugation to ubiquitin in a process distinct from classical ubiquitination pathway. Mol Pharmacol. 2002;61:892–904. doi: 10.1124/mol.61.4.892. [DOI] [PubMed] [Google Scholar]
- 9.Kimzey AL, Weitz KK, Guengerich FP, Zangar RC. Hydroperoxy-10,12-octadecadienoic acid stimulates cytochrome P450 3A protein aggregation by a mechanism that is inhibited by substrate. Biochemistry. 2003;42:12691–9. doi: 10.1021/bi0349975. [DOI] [PubMed] [Google Scholar]
- 10.Loguercio C, Federico A. Oxidative stress in viral and alcoholic hepatitis. Free Radic Biol Med. 2003;34:1–10. doi: 10.1016/s0891-5849(02)01167-x. [DOI] [PubMed] [Google Scholar]
- 11.Cederbaum AI. Iron and CYP2E1-dependent oxidative stress and toxicity. Alcohol. 2003;30:115–20. doi: 10.1016/s0741-8329(03)00104-6. [DOI] [PubMed] [Google Scholar]
- 12.Cederbaum AI. CYP2E1--biochemical and toxicological aspects and role in alcohol-induced liver injury. Mt Sinai J Med. 2006;73:657–72. [PubMed] [Google Scholar]
- 13.Zangar RC, Bollinger N, Verma S, Karin NJ, Lu Y. The nuclear factor-kappa B pathway regulates cytochrome P450 3A4 protein stability. Mol Pharmacol. 2008;73:1652–8. doi: 10.1124/mol.107.043976. [DOI] [PubMed] [Google Scholar]
- 14.Brimer C, Dalton JT, Zhu Z, Schuetz J, Yasuda K, Vanin E, Relling MV, Lu Y, Schuetz EG. Creation of polarized cells coexpressing CYP3A4, NADPH cytochrome P450 reductase and MDR1/P-glycoprotein. Pharm Res. 2000;17:803–10. doi: 10.1023/a:1007599923694. [DOI] [PubMed] [Google Scholar]
- 15.Zhang Y, Gonzalez RM, Zangar RC. Protein secretion in human mammary epithelial cells following HER1 receptor activation: influence of HER2 and HER3 expression. BMC Cancer. 2011;11:69. doi: 10.1186/1471-2407-11-69. [DOI] [PMC free article] [PubMed] [Google Scholar]
- 16.Orr G, Panther DJ, Cassens KJ, Phillips JL, Tarasevich BJ, Pounds JG. Syndecan-1 mediates the coupling of positively charged submicrometer amorphous silica particles with actin filaments across the alveolar epithelial cell membrane. Toxicol Appl Pharmacol. 2009;236:210–20. doi: 10.1016/j.taap.2009.01.022. [DOI] [PubMed] [Google Scholar]
- 17.Gonzalez RM, Seurynck-Servoss SL, Crowley SA, Brown M, Omenn GS, Hayes DF, Zangar RC. Development and validation of sandwich ELISA microarrays with minimal assay interference. J Proteome Res. 2008;7:2406–14. doi: 10.1021/pr700822t. [DOI] [PubMed] [Google Scholar]
- 18.Servoss SL, Gonzalez R, Varnum S, Zangar RC. High-throughput analysis of serum antigens using sandwich ELISAs on microarrays. Methods Mol Biol. 2009;520:143–50. doi: 10.1007/978-1-60327-811-9_10. [DOI] [PubMed] [Google Scholar]
- 19.White AM, Daly DS, Varnum SM, Anderson KK, Bollinger N, Zangar RC. ProMAT: protein microarray analysis tool. Bioinformatics. 2006;22:1278–9. doi: 10.1093/bioinformatics/btl093. [DOI] [PubMed] [Google Scholar]
- 20.Pfaffl MW, Horgan GW, Dempfle L. Relative expression software tool (REST) for group-wise comparison and statistical analysis of relative expression results in real-time PCR. Nucleic Acids Res. 2002;30:e36. doi: 10.1093/nar/30.9.e36. [DOI] [PMC free article] [PubMed] [Google Scholar]
- 21.Donato MT, Lahoz A, Castell JV, Gomez-Lechon MJ. Cell lines: a tool for in vitro drug metabolism studies. Curr Drug Metab. 2008;9:1–11. doi: 10.2174/138920008783331086. [DOI] [PubMed] [Google Scholar]
- 22.Chen CS, Gee KR. Redox-dependent trafficking of 2,3,4,5, 6-pentafluorodihydrotetramethylrosamine, a novel fluorogenic indicator of cellular oxidative activity. Free Radic Biol Med. 2000;28:1266–78. doi: 10.1016/s0891-5849(00)00265-3. [DOI] [PubMed] [Google Scholar]
- 23.Zangar RC, Davydov DR, Verma S. Mechanisms that regulate production of reactive oxygen species by cytochrome P450. Toxicol Appl Pharmacol. 2004;199:316–31. doi: 10.1016/j.taap.2004.01.018. [DOI] [PubMed] [Google Scholar]
- 24.Griendling KK, Sorescu D, Lassegue B, Ushio-Fukai M. Modulation of protein kinase activity and gene expression by reactive oxygen species and their role in vascular physiology and pathophysiology. Arterioscler Thromb Vasc Biol. 2000;20:2175–83. doi: 10.1161/01.atv.20.10.2175. [DOI] [PubMed] [Google Scholar]
- 25.Chen WN, Woodbury RL, Kathmann LE, Opresko LK, Zangar RC, Wiley HS, Thrall BD. Induced autocrine signaling through the epidermal growth factor receptor contributes to the response of mammary epithelial cells to tumor necrosis factor alpha. J Biol Chem. 2004;279:18488–96. doi: 10.1074/jbc.M310874200. [DOI] [PubMed] [Google Scholar]
- 26.Rodland KD, Bollinger N, Ippolito D, Opresko LK, Coffey RJ, Zangar R, Wiley HS. Multiple mechanisms are responsible for transactivation of the epidermal growth factor receptor in mammary epithelial cells. J Biol Chem. 2008;283:31477–87. doi: 10.1074/jbc.M800456200. [DOI] [PMC free article] [PubMed] [Google Scholar]
- 27.Chang CJ, Yin PH, Yang DM, Wang CH, Hung WY, Chi CW, Wei YH, Lee HC. Mitochondrial dysfunction-induced amphiregulin upregulation mediates chemo-resistance and cell migration in HepG2 cells. Cell Mol Life Sci. 2009;66:1755–65. doi: 10.1007/s00018-009-8767-5. [DOI] [PMC free article] [PubMed] [Google Scholar]
- 28.Eyries M, Collins T, Khachigian LM. Modulation of growth factor gene expression in vascular cells by oxidative stress. Endothelium. 2004;11:133–9. doi: 10.1080/10623320490482691. [DOI] [PubMed] [Google Scholar]
- 29.Hamanaka RB, Chandel NS. Mitochondrial reactive oxygen species regulate hypoxic signaling. Curr Opin Cell Biol. 2009;21:894–9. doi: 10.1016/j.ceb.2009.08.005. [DOI] [PMC free article] [PubMed] [Google Scholar]
- 30.Li N, Karin M. Is NF-kappaB the sensor of oxidative stress? FASEB J. 1999;13:1137–43. [PubMed] [Google Scholar]
- 31.Piva R, Belardo G, Santoro MG. NF-kappaB: a stress-regulated switch for cell survival. Antioxid Redox Signal. 2006;8:478–86. doi: 10.1089/ars.2006.8.478. [DOI] [PubMed] [Google Scholar]
- 32.Storz P, Toker A. NF-kappaB signaling--an alternate pathway for oxidative stress responses. Cell Cycle. 2003;2:9–10. doi: 10.4161/cc.2.1.234. [DOI] [PubMed] [Google Scholar]
- 33.De MS, Brenner DA. NOX in liver fibrosis. Arch Biochem Biophys. 2007;462:266–72. doi: 10.1016/j.abb.2007.04.016. [DOI] [PMC free article] [PubMed] [Google Scholar]
- 34.Schmidt R, Baumann F, Knupfer H, Brauckhoff M, Horn LC, Schonfelder M, Kohler U, Preiss R. CYP3A4, CYP2C9 and CYP2B6 expression and ifosfamide turnover in breast cancer tissue microsomes. Br J Cancer. 2004;90:911–6. doi: 10.1038/sj.bjc.6601492. [DOI] [PMC free article] [PubMed] [Google Scholar]
- 35.Waters KM, Masiello LM, Zangar RC, Tarasevich BJ, Karin NJ, Quesenberry RD, Bandyopadhyay S, Teeguarden JG, Pounds JG, Thrall BD. Macrophage responses to silica nanoparticles are highly conserved across particle sizes. Toxicol Sci. 2009;107:553–69. doi: 10.1093/toxsci/kfn250. [DOI] [PMC free article] [PubMed] [Google Scholar]
- 36.Puntarulo S, Cederbaum AI. Production of reactive oxygen species by microsomes enriched in specific human cytochrome P450 enzymes. Free Radic Biol Med. 1998;24:1324–30. doi: 10.1016/s0891-5849(97)00463-2. [DOI] [PubMed] [Google Scholar]
- 37.Mari M, Cederbaum AI. Induction of catalase, alpha, and microsomal glutathione S-transferase in CYP2E1 overexpressing HepG2 cells and protection against short-term oxidative stress. Hepatology. 2001;33:652–61. doi: 10.1053/jhep.2001.22521. [DOI] [PubMed] [Google Scholar]
- 38.Dostalek M, Hardy KD, Milne GL, Morrow JD, Chen C, Gonzalez FJ, Gu J, Ding X, Johnson DA, Johnson JA, Martin MV, Guengerich FP. Development of oxidative stress by cytochrome P450 induction in rodents is selective for barbiturates and related to loss of pyridine nucleotide-dependent protective systems. J Biol Chem. 2008;283:17147–57. doi: 10.1074/jbc.M802447200. [DOI] [PMC free article] [PubMed] [Google Scholar]
- 39.Khan A. Reactive Oxygen Species as Cellular Messengers. Chem Biol. 1995;2:437–45. doi: 10.1016/1074-5521(95)90259-7. [DOI] [PubMed] [Google Scholar]
- 40.Papa S, Skulachev VP. Reactive oxygen species, mitochondria, apoptosis and aging. Mol Cell Biochem. 1997;174:305–19. [PubMed] [Google Scholar]
- 41.Finkel T. Oxygen radicals and signaling. Curr Opin Cell Biol. 1998;10:248–53. doi: 10.1016/s0955-0674(98)80147-6. [DOI] [PubMed] [Google Scholar]
- 42.Lenaz G. Role of mitochondria in oxidative stress and ageing. Biochim Biophys Acta. 1998;1366:53–67. doi: 10.1016/s0005-2728(98)00120-0. [DOI] [PubMed] [Google Scholar]
- 43.Hensley K, Robinson KA, Gabbita SP, Salsman S, Floyd RA. Reactive oxygen species, cell signaling, and cell injury. Free Radic Biol Med. 2000;28:1456–62. doi: 10.1016/s0891-5849(00)00252-5. [DOI] [PubMed] [Google Scholar]
- 44.Skulachev VP. Cytochrome c in the apoptotic and antioxidant cascades. FEBS Lett. 1998;423:275–80. doi: 10.1016/s0014-5793(98)00061-1. [DOI] [PubMed] [Google Scholar]
- 45.Mignotte B, Vayssiere JL. Mitochondria and apoptosis. Eur J Biochem. 1998;252:1–15. doi: 10.1046/j.1432-1327.1998.2520001.x. [DOI] [PubMed] [Google Scholar]
- 46.Clerkin JS, Naughton R, Quiney C, Cotter TG. Mechanisms of ROS modulated cell survival during carcinogenesis. Cancer Lett. 2008;266:30–6. doi: 10.1016/j.canlet.2008.02.029. [DOI] [PubMed] [Google Scholar]
- 47.Kuster GM, Siwik DA, Pimentel DR, Colucci WS. Role of reversible, thioredoxin-sensitive oxidative protein modifications in cardiac myocytes. Antioxid Redox Signal. 2006;8:2153–9. doi: 10.1089/ars.2006.8.2153. [DOI] [PubMed] [Google Scholar]
- 48.Dremina ES, Sharov VS, Davies MJ, Schoneich C. Oxidation and inactivation of SERCA by selective reaction of cysteine residues with amino acid peroxides. Chem Res Toxicol. 2007;20:1462–9. doi: 10.1021/tx700108w. [DOI] [PubMed] [Google Scholar]
- 49.Vangheluwe P, Raeymaekers L, Dode L, Wuytack F. Modulating sarco(endo)plasmic reticulum Ca2+ ATPase 2 (SERCA2) activity: cell biological implications. Cell Calcium. 2005;38:291–302. doi: 10.1016/j.ceca.2005.06.033. [DOI] [PubMed] [Google Scholar]
- 50.Misquitta CM, Mack DP, Grover AK. Sarco/endoplasmic reticulum Ca2+ (SERCA)-pumps: link to heart beats and calcium waves. Cell Calcium. 1999;25:277–90. doi: 10.1054/ceca.1999.0032. [DOI] [PubMed] [Google Scholar]
- 51.Qin LX, Tang ZY. Recent progress in predictive biomarkers for metastatic recurrence of human hepatocellular carcinoma: a review of the literature. J Cancer Res Clin Oncol. 2004;130:497–513. doi: 10.1007/s00432-004-0572-9. [DOI] [PMC free article] [PubMed] [Google Scholar]
- 52.Berasain C, Castillo J, Perugorria MJ, Prieto J, Avila MA. Amphiregulin: a new growth factor in hepatocarcinogenesis. Cancer Lett. 2007;254:30–41. doi: 10.1016/j.canlet.2007.01.015. [DOI] [PubMed] [Google Scholar]