

Abstract
There is a growing use of bioinformatics based methods in the field of Glycobiology. These have been used largely to curate glycan structures, organize array-based experimental data and display existing knowledge of glycosylation-related pathways in silico. Although the cataloging of vast amounts of data is beneficial, it is often a challenge to gain meaningful mechanistic insight from this exercise alone. The development of specific analysis tools to query the database is necessary. If these queries can integrate existing knowledge of glycobiology, new insights may be gained. Such queries that couple biochemical knowledge and mathematics have been developed in the field of Systems Biology. The current review summarizes the current state of the art in the application of computational modeling in the field of Glycobiology. It provides (i) an overview of experimental and online resources that can be used to construct glycosylation reaction networks, (ii) mathematical methods to formulate the problem including a description of ordinary differential equation and logic-based reaction networks, (iii) optimization techniques that can be applied to fit experimental data for the purpose of model reconstruction and for evaluating unknown model parameters, (iv) post-simulation analysis methods that yield experimentally testable hypotheses and (v) a summary of available software tools that can be used by non-specialists to perform many of the above functions.
Keywords: in silico simulation, leukocyte–endothelium interaction, O-glycans, optimization, systems biology
Systems glycobiology
Glycosylation is a common type of post-translational modification. This results in the attachment of carbohydrates to protein and lipid scaffolds. By some accounts, 50% of all proteins are glycosylated (Apweiler et al. 1999). Such glycans participate in a variety of biological processes including protein folding, cell growth and development, immunity, anti-coagulation, microbial pathogenesis and cancer metastasis. Alteration of the normal glycosylation machinery can result in a variety of diseases that are grouped under the classification “congenital defects of glycosylation” (Freeze 2007; Jaeken and Matthijs 2007).
Although the conventional, reductionist approach of experimentation involves the study of individual proteins and molecular interactions one-at-a-time, recent advances in experimental methods and knowledge of biochemical processes enable the study of biological “systems” as a whole. Such systems-level studies focus on the discovery of “emergent” properties that arise as a result of multiple, complex molecular interactions. These interactions are often depicted using biochemical reaction networks, as opposed to single reactions alone. Both the application of conventional procedures and newer high-throughput technologies enable the collection of experimental data that are necessary for systems-level analysis. There is also a keen focus in this field on developing appropriate mechanistic, quantitative models that can guide the interpretation of such data. Together, the integration of experiments and computational modeling has given rise to a field of research that is termed “Systems Biology”.
Systems Biology approaches have been applied in studies of metabolic pathways (Orth et al. 2010) and signal transduction (Aldridge et al. 2006; Janes and Yaffe 2006). Such studies are fueled by the generation of -omics-based experimental data in the areas of Genomics, Proteomics, Metabolomics etc. Corollaries to the Systems Biology concept have emerged in recent years in other areas including Systems Chemistry that deals with the emerging properties of interacting chemical systems and networks, Systems Genetics that examines how the presence of a variety of interacting genes and molecules results in complex traits and Systems Physiology that integrates knowledge of structure–function relationships at the cellular, tissue and organ levels to explain the behavior of whole living organism. The recent availability of advanced experimental methodologies in the area of Glycomics and Glycobiology promises that advances in the field of Systems Biology will also impact studies of the Glycome—an emerging field that is called Systems Glycobiology.
The current article attempts to classify research problems in the field of Glycobiology that may be amenable to systems-level analysis and to discuss experimental and computational techniques that can aid such work. The case of leukocyte adhesion to vascular endothelial cells is used as an example in many sections since this is a well-studied and important biological interaction in the fields of Glycobiology and Medicine. Here, leukocyte and endothelial adhesion molecules belonging to the selectin family bind glycoprotein ligands, and this initiates a cascade of events that eventually results in the recruitment of leukocytes to sites of acute and chronic inflammation (McEver and Cummings 1997; Neelamegham 2004; Sackstein 2009). An overarching goal is to provide background information that may appeal both to glycobiologists interested in the application of quantitative analysis and to computational scientists interested in studying the Glycome.
Glycosylation reaction networks
The overall glycosylation process in mammalian cells is regulated by smaller networks of reactions that may be grouped into three classes (Figure 1). (i) Metabolic reactions that result in the formation of sugar nucleotides (uridine diphosphate galactose, cytidine monophosphate sialic acid etc.). These reactions, which take place in the cytoplasm and nucleus of cells, involve various families of enzymes including kinases, synthases and epimerases. Figure 2A provides a schematic that gives an overview of this class of biochemical pathways. (ii) Glycosylation reactions that mediate the addition of glycans to proteins and lipids. Such reactions, which primarily occur in the endoplasmic reticulum (ER) and Golgi compartments, involve primarily the glycosyltransferases and also other enzyme families like sulfotransferases. For this to occur, sugar nucleotides generated in the metabolic reactions must be transported to the ER/Golgi. Together, these reactions result in the construction of glycoproteins, glycosphingolipids, proteoglycans and glycosylphosphatidylinositol-linked protein anchors. Figure 2B–D provides an overview of the reaction pathways leading to the formation of O-glycans, N-glycans and glycolipids. Figure 2B shows the reactions that lead to the synthesis of the eight core structures that are common to O-glycans, labeled core-1 to core-8. It also shows one example of a reaction pathway that can lead to the formation of the sialyl Lewis-X tetrasaccharide (sLeX) glycan on the mucin core-2 structure. Such sLeX glycans can participate as ligands for the selectin family of adhesion molecules. This sLeX is defined as the “system output” in the example discussed in later sections of this review. Figure 2C shows that an array of high mannose, hybrid and complex N-glycans can emerge from the combinatorial action of exoglycosidases, chain extending and chain terminating glycosyltransferases. Figure 2D provides an overview of pathways leading to the formation of glycosphingolipids. More comprehensive information on these and other pathways that lead to cellular glycosylation can be found in textbooks in the field (Varki et al. 2008) and also at the Kyoto Encyclopedia of Genes and Genomes (KEGG) GLYCAN database (http://www.genome.jp/kegg/glycan/; Hashimoto et al. 2006). (iii) Once glycoproteins and glycolipids are formed, various transport mechanisms regulate the distribution of these glycoconjugates in cells, on the cell surface, nucleus and cytoplasm (Figure 1). There also exist recycling/salvage reactions that contribute to the synthesis of monosaccharides after the proteolysis of macromolecules.
Fig. 1.

Systems-level view of glycosylation.
Fig. 2.

Overview of selected glycosylation reaction pathways. (A) Biosynthesis and interconversion of monosaccharides. The schematic illustrates biochemical reactions leading to the formation of activated sugar nucleotides (UDP-Glc, UDP-Gal, UDP-GlcNAc, UDP-GalNAc, UDP-GlcA, UDP-Xyl, GDP-Man, GDP-Fuc and cytidine monophosphate (CMP)-sialic acid [Neu5Ac and Neu5Gc]) when glucose is the primary energy source. Here, the monosaccharide is metabolized by a series of kinase and epimerase reactions depicted by arrows to form various activated sugar nucleotides (shown in orange rectangle). Once sugar nucleotides are formed in the cytosol, they are directed to the ER/golgi where glycosylation takes place. The sugar nucleotide composition of cells along with the expression and activity of glycosyltransferases, together regulate the cellular glycan signature. Changes to other metabolic reactions like glycolysis (which consumes Glc-6-P and provides phosphophenolpyruvate (PEP)), respiration (which provides ATP etc.) and salvage pathways (which breakdown cell-surface glycoconjugates to regenerate monosaccharides) can also regulate the biochemical reaction rates. (B) O-Linked glycosylation. This is initiated by the attachment of GalNAcα to Ser/Thr residues using enzymes belonging to the ppGalNAcT family. These complex sugars consist of three distinct regions: core, backbone and non-reducing terminus. GlcNAc and Gal are key β-linked sugars found in the backbone region, whereas Galα, Fucα and NeuAcα2 are generally located at the non-reducing terminus. Among the eight known core structures in O-glycans, the core-2 structure Galβ1 → 3(GlcNAcβ1 → 6)GalNAcα-Ser/Thr is prominent in selectin ligands. The synthesis of sLeX (NeuAcα2,3Galβ1,4(Fucα1,3)GlcNAc), the prototypic selectin ligand, attached to a core-2 structure is shown. (C) N-Linked glycosylation. In the ER, the dolichol oligosaccharide precursor composed of 14 monosaccharides is transferred to Asp residues on the nascent protein. Trimming of the oligosaccharide by Glcase and α-mannosidase in the ER and Golgi results in high-mannose-type glycans. These can be further diversified into hybrid (with at least one GlcNAc attached to the mannose core residues) and complex N-glycans (with GlcNAc antennae attached to mannose). (D) Glycolipid synthesis. This proceeds when glucose or galactose attach to ceramide units to form glucosylceramides (GlcCers) or galactosylceramides (GalCers). The number of variants of GalCers is limited. GlcCers are diversified by addition of a galactose and additional diversification that results in Ganglio-series (with 1 or more sialic acids), neolacto-series (common in leukocytes) and their families of glycosylated lipids. Glc, glucose; Fruc, fructose; Gal, galactose; GlcNAc, N-acetylglucosamine; GalNAc, N-acetylgalactosamine; GlcN, glucosamine; P, phosphate; Xyl, xylose; GlcA, glucuronic acid; PEP, phosphoenolpyruvate; ATP, adenosine triphosphate; UDP, uridine diphosphate; GDP, guanosine diphosphate; CMP, cytidine monophosphate; OST, oligosaccharyltransferase. See Varki et al. (2008) for more details on the reaction pathways.
Besides the above three groups of reactions that regulate the synthesis and distribution of glycans, functional reactions in cells or at the cell surface regulate the effector functions of glycans. These effector functions include, but are not limited to, cell adhesion, signaling and apoptosis. Some glycans play important roles in signaling, like members of the Notch family (Jafar-Nejad et al. 2010), and this results in regulation of the cellular transcriptome. Together these complex interactions regulate cell function. In principle, it is possible to study each of the modules described in this section as a whole or in part individually, and then use systems-biology/multiscale approaches to integrate the information quantitatively. Thus, even though processes like glycoconjugate mass transport or salvage can be studied one at a time, these individual steps can also be integrated into a larger biosynthesis/network model.
Mathematical modeling of biochemical reaction networks
Development of mathematical models to describe glycosylation requires three essential steps (Figure 3). (i) “Biological information gathering”: this involves the definition of essential model components like enzymes, substrates and products. This step catalogs all the constituents of the biochemical network under study and their connectivity. It relies heavily on existing knowledge of cell biology and biochemistry, and analytical tools described below. (ii) “Model formulation”: this defines the nature of the computer model. This formulation may be based on simple linear algebra and optimization principles alone if we are interested primarily in the steady state behavior of the system. It can incorporate ordinary differential equations (ODEs) or Boolean networks when time is a variable. Depending on the nature of the model formulation and the specific enzymatic/non-enzymatic processes, then, one collates appropriate kinetic/thermodynamic/stochastic/optimization parameters associated with the system (e.g. Michaelis constant KM, dissociation constant Kd and on/off rate constants kon/off). (iii) “Simulation and post-simulation analysis”: this is performed in order to simulate the experimental system in silico (i.e. in the computer) and to determine unknown model parameters based on fitting experimental data. Since many different models may attempt to fit one experimental data set and since each of these can yield large amounts of time- and concentration-dependent data under varying knockout/chemical treatment conditions, visualization of multidimensional results is important. Thus, network analysis strategies are applied to consolidate the findings emerging from complex reaction network simulations and to generate experimentally testable hypotheses. Wet-lab (experimental) testing of hypotheses generated by dry-lab (computer) simulations is a critical step for model validation. This leads to the iterative refinement of model structure and parameters. The remaining sections of this manuscript describe each of these steps in some detail.
Fig. 3.

Basic steps during model construction.
Biological information gathering: experimental tools and online resources
The formulation of a quantitative biochemical model is initiated with the characterization of participating molecules in the network and the interaction between these components. More specifically, this information includes (i) molecular network topology in qualitative aspect and (ii) kinetic data that provide estimates of model parameters. Often, this knowledge is gleaned from a large-scale literature review of well-accepted biological findings. In addition to this, in recent years, a series of databases have appeared that provide leads for pathway construction by collating data related to the genome, proteome, interactome and metabolome (reviewed in Ng et al. 2006). Reaction networks resulting from this step may be described in XML (eXtensible Markup Language) format, since an increasing number of mathematical models and analysis tools developed in recent years utilize this representation. These modeling standards allow streamlined documentation and exchange of model information among research groups. The Systems Biology Markup Language (SBML; Hucka et al. 2003) and the Cell Markup Language (CellML; Garny et al. 2008) are two widely used formats for such representation of biochemical reaction networks. Graphical presentation of models using System Biology Graphical Notation (SBGN; Le Novere et al. 2009), Molecular Interaction Map (MIM; Kohn et al. 2006) or other tools can also be beneficial for the accurate transmission of biological information. MIM diagrams have been used to represent a wide range of molecular networks. SBGN contains three levels of diagrams including process diagram, entity relationships and activity flow diagram, and these are compatible with SBML. Presentation of glycosylation networks using SBML notation has been initiated (Liu et al. 2008). XML-based rules/schema to describe carbohydrate structures in silico have also been defined by several groups (Kikuchi et al. 2005; Sahoo et al. 2005; Herget et al. 2008). Thus, attempts to merge developments in computation/systems biology with experimental research in the field of glycobiology are underway.
With regard to collating data that can be used for model synthesis at the gene level, whereas most of the existing databases are not specifically curated for studies related to the glycome, databases like Gene Expression Omnibus (GEO; Boyle 2005), ArrayExpress (Parkinson et al. 2007) and CIBEX (Ikeo et al. 2003) do contain information relevant to this field. In addition, the Consortium of Functional Glycomics (CFG; www.functionalglycomics.org) has designed a custom Affymetrix array that has improved the representation of glycosyltransferase genes and related downstream targets, compared with whole-genome microarrays (Raman et al. 2005). This tool monitors the expression of ∼2000 human and mouse transcripts relevant to Glycobiology. In addition to this, efforts have been undertaken to apply quantitative real-time reverse transcriptase-polymerase chain reaction (PCR) to monitor glycosyltransferases and related genes in both human (Marathe et al. 2008; Ito et al. 2009) and mouse (Nairn et al. 2008) systems. Upon comparing >700 genes using real-time PCR vs microarray data, Nairn et al. (2008) report greater sensitivity and dynamic range for their PCR-based approach, particularly in the case of low-abundance glycan-related transcripts. Overall, experimental tools are available to interrogate the effect of system perturbation at the transcript level.
While gene expression measurements can be made rapidly, the relationship between gene expression and protein expression is typically non-linear. This is even more complicated in the case of Glycobiology, since glycosyltransferases catalyze post-translational modifications. Thus, in addition to the expression levels, quantitation of enzyme activity is important for model construction. This can be performed for various families of glycosyltransferases using an array of carbohydrate acceptors (Taniguchi et al. 2002; Marathe et al. 2008). Data related to enzyme activity, including but not limited to glycosylation-related processes, are also comprehensive catalogued in the BRENDA (www.brenda-enzymes.org/) database based on surveying over 79,000 primary literature (Chang et al. 2009). However, this database suffers from shortcomings of individual laboratories, since the units used in publications and the experimental procedures do not follow a uniform pattern. A second, but smaller, database that is geared toward computer simulation is called SABIO-RK (System for the Analysis of Biochemical Pathways - Reaction Kinetics; Rojas et al. 2007). This information resource collects much of its data from the KEGG database. Although this system has the advantage in that its output is in SBML format, data related to the field of Glycobiology is somewhat limited.
Besides gene and protein-level data, structural information can form a key component for model construction. Both advances in online tools and analytical methods enable this approach (Raman et al. 2005; Aoki-Kinoshita 2008; Mamitsuka 2008; Frank and Schloissnig 2010). In this regard, repositories of carbohydrate structures have emerged in recent years including the GlycosuiteDB (Cooper et al. 2003) and GlycomeDB databases (Ranzinger et al. 2009). The latter serves as a repository of glycan structure data collected from existing databases including CarbBank, GLYCOSCIENCES.de, CFG, KEGG and others. The KEGG GLYCAN (http://www.genome.jp/kegg/glycan/) database has also manually cataloged biochemical pathways relevant to glycosylation (Hashimoto et al. 2006). Finally, efforts are underway to extend this approach such that functional networks related to glycans can be dynamically created (Hashimoto et al. 2010).
Analytical tool development for Glycomics research can greatly benefit Systems Glycobiology. In this regard, although traditional methods focus on using electrophoresis, chromatography and associated radioactivity-based assays, new families of high-throughput technologies have been developed for Glycomics. In particular, MALDI (matrix-assisted laser desorption/ionization), liquid chromatography-mass spectrometry (MS) and variants of these methods are providing valuable data on the sites of proteins that are glycosylated and the profile of carbohydrates attached to specific proteins (Mechref and Novotny 2009; North et al. 2009; Zaia 2009). Using a variety of lectin-based purification steps, chemical modification protocols, exoglycosidase digestion methods and isotope labeling strategies, advances are being made with the goal of completely characterizing the site-specific nature of glycosylation. A major challenge remains the limited quantitative data regarding glycosylation that is necessary in order to account for glycan microheterogeneity. Another limitation remains the lack of automated programs that can be used to analyze MS data. Availability of more detailed information on protein-specific glycan structures may enable systems-level analysis that incorporates the stochastic nature of the glycan biosynthesis pathways, and it may explain non-linearities associated with glycan structure and function.
Other large-scale analytical technologies include microarray-based methods where either lectins, antibodies or carbohydrates are immobilized on substrates (reviewed by Paulson et al. 2006; Hsu and Mahal 2009). Lectin microarrays consist of dense spots of immobilized lectins. Fluorescent glycoproteins (Kuno et al. 2009) and cells (Pilobello et al. 2007) are hybridized with these lectin spots and scanners are used to monitor binding. Glycan structures associated with proteins/cells are then inferred based on the known specificity of lectins. As an alternative to lectins, some investigators have immobilized carbohydrates on substrates since these can be used to assay for glycan-binding proteins (Blixt et al. 2004; Xia et al. 2005). In yet another variant of the same principle, anti-glycoprotein antibodies have been immobilized on slides to capture specific glycoproteins. Specific glycan structures on the captured macromolecule are then assayed using fluorescent lectins and anti-carbohydrate antibodies (Chen et al. 2007). Such an approach where antibodies are used to capture glycoproteins onto substrates (polystyrene beads) and fluorescent anti-carbohydrate antibodies are used detect glycan structures has also been extended to a flow cytometry format in order to detect site-specific glycosylation (Jayakumar et al. 2009).
Model formulation: approaches for in silico simulation
Many different modeling approaches can be applied to study glycosylation reaction networks. The choice of strategies is driven by the amount of experimental data available and existing knowledge of biochemistry and also by the project goals and available expertise (Figure 4A). ODE network models can be simulated when rich experimental data sets and biochemical knowledge are available. Although this type of modeling is straightforward, a major challenge is that all necessary rate constants might not be available in literature and this can hinder mathematical model formulation. Boolean networks are simulated in the absence of such detailed information. In this case, the organization of the network is more important compared with the kinetic details. This is suitable either when there is insufficient information on overall network structure and molecular mechanism or when insufficient kinetic and temporal data exist. Statistical analysis is appropriate when experimental data are available, but detailed biochemical knowledge is lacking. This approach is particularly useful for semi-quantitative grouping of related components in a biochemical reaction network. These three groups of modeling approaches are described next.
Fig. 4.

Mathematical models. (A) Modeling approach selected depends on the volume of experimental data and biochemical knowledge available. This is a qualitative, conceptual figure generated using MATLAB. (B) Most reactions in glycosylation systems fall into one of three categories.
Models based on a set of coupled ODE networks
In this approach, each equation represents a single biological reaction or process. This type of representation is common in biological literature, and it has been used to describe cellular signaling (Aldridge et al. 2006) and glycosylation processes (described in the next section). This approach is appropriate (i) when there is only one independent variable (typically time) and (ii) when the number of reactants is large.
Reactions written here typically emerge from the law of mass action, which states that the rate of an elemental reaction (reaction with one transition state) is proportional to the frequency with which the reacting species collide. This, in turn, depends on the concentration of reactants in the system. Concentration terms are raised to the power of an arbitrary reaction order, which typically corresponds to the molecularity of the reaction. Although three different types of reactions are common in the field of glycobiology (Figure 4B), we discuss the case of the reversible biochemical reaction with forward and reverse velocities vf and vr, and kinetic rate constants kf and kr, below:
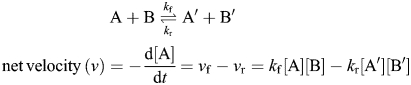 |
The equilibrium constant (Keq) for this equation is Keq = kf/kr = [A′][B′]/([A][B]). Extending this approach, the velocity of the ith reaction (vi) follows:
| (1) |
Here, Cl is the concentration of the lth species, and  refers to the forward (reverse) reaction order of the ith reaction with respect to the lth species. For a general system with m substrates and n reactions, the above equation can be written in matrix notations as:
| (2) |
Here, the vector v consists of n individual reaction velocities, C contains the concentrations of the m reactants and the m × n matrix αT contains the stoichiometric coefficients for the reaction network. In general, αT describes the connectivity between individual flux vectors or reaction velocities (v = v1, v2, …, vn) and the time derivative of species concentration (C = C1, C2, …, Cm). This matrix is typically a “sparse” matrix, i.e. it contains a large number of zeros. This is because in typical biological systems, each species/reactant participates in only a few biochemical reactions. Biological connectivity identified in αT is based on our knowledge of biochemistry/biology and also experiments that verify the existence or the absence of relevant reaction components, like specific glycosyltransferases or substrates. For typical biological reaction networks, the number of reactions (n) exceeds the number of reactants (m), i.e. n > m. The above equation is typically solved as an initial value problem with initial conditions:
| (3) |
In cases where there is more than one independent variable, e.g. if spatial gradients in reactants or enzymes exist in addition to time, this modeling approach is extended to incorporate partial differential equations. In this regard, although the distribution of glycosylating enzymes varies within ER/Golgi compartment, glycosylation processes can still be modeled using ODEs by simulating each Golgi or ER compartment as a separate well-mixed reactor and by arranging these compartments in series to simulate the entire network process.
With regard to the number of reactants, a variety of glycan structures may occur at a specific protein site if the number of reactants is low. This phenomenon is termed “microheterogeneity”. Similarly, heterogeneity that results in the presence or the absence of glycans at a given site is termed “macroheterogeneity”. Due to such heterogeneity, a single protein may have different molecular weights and function. Although the extent of heterogeneity can vary depending on the protein/cell type and specific glycosylation site, the precise mechanism is not well understood. In this regard, stochastic or probabilistic models can be used to simulate the distribution of glycans at a given site. In such computations, in addition to measuring the mean glycan structure at the site, there is also interest in generating fluctuation data that can explain heterogeneity. The coupling of experiments with theory can reveal the relative contributions of glycosyltransferase expression levels, substrate structure, enzyme catalysis rates and glycosyltransferase enzyme competition for common substrates in regulating glycan heterogeneity.
Logic-based models and related network analysis
Logic-based models use “gates” and “truth tables” to specify interactions between model species. In this case, the reaction networks are represented by a directed graph, where the nodes represent individual reactants/species and edges denote the connectivity. The m species in this reaction network are denoted Sj (j = 1, …, m), and they are said to have a concentration Cj. In the case of Boolean (two-state) networks, Cj is 1 if it exists (ON) and 0 if it does not (OFF). Figure 5 presents an example of such a network. Here, the conventional reaction pathway shown in Figure 5A is represented in Boolean network notation in Figure 5B. Boolean transfer functions represented on each edge contains “gate” information. These are typically the three logic operators “not”, “and” and “or” or derivatives of these. The future state of the nodes (S*, at time t + 1) is determined based on the current state (S, at time t) and the Boolean transfer functions as shown in Figure 5C. Due to the nature of the state diagram, Boolean networks typically achieve a stationary or recurring state that are together referred to as “dynamic attractors”. This is illustrated in Figure 5D, where following an increase at intermediate times, S4 settles to the basal level.
Fig. 5.

Boolean network. (A) Conventional representation of a small reaction system. (B) Representation of the same system as in (A) using logic gates. (C) Statements derived from the logic-gate diagram in (B). (D) Simulation of the network described in (C) using synchronous updating of species concentration. As seen, while S1 is available initially, it is suppressed by the formation of S4. S4 subsequently decreases to basal levels at time = 5.
Although Boolean network models are straightforward to simulate, they provide only limited information regarding network dynamics when all species are updated synchronously at each time point, as in Figure 5. It also does not allow simulation of processes that may proceed at different time scales, e.g. changes in gene expression and glycan synthesis. In order to better understand the dynamics of the network, thus various strategies have been developed to diversify the network output. The goal of this exercise is to obtain an understanding of the average behavior of each model element. Strategies implement to achieve this end include the updating of node concentrations asynchronously, i.e. each node is updated either in a random sequence or at selected time intervals. In addition, variants of the classical Boolean network have appeared like the threshold Boolean network and piecewise linear systems that allow definition of more complex logic operators (Albert and Wang 2009). In addition, multistate and fuzzy logic models have emerged that allow additional states to be populated, in addition to the ON/OFF (1/0) state (Morris et al. 2010). By incorporating these concepts, logic-based models aim to generate temporal behavior without detailed kinetic information. Logic-based models have found wide application in systems describing regulatory networks and signaling cascades. The application of this approach to studies of glycosylation pathways is anticipated.
Statistical analysis methods
“Data-driven models” constitute a collection of statistical tools that enable analysis of experimental data collected using high-throughput proteomic methods. The advantage of this approach is that models can be established using this approach, even when mechanistic knowledge of a particular pathway is sparse. Many of the modeling concepts used in this method are analogous to techniques previously developed for analysis of DNA microarray data (Janes and Yaffe 2006). This includes techniques like hierarchical clustering, principal component analysis and partial least-square methods. In addition to analyzing raw experimental data these same techniques can also be applied to consolidate the findings emerging from in silico simulations of glycosylation reaction networks.
Prior models of glycosylation reaction networks
Attempts have been initiated to create computational models that can resolve the complex nature of the glycosylation processes. The number of such approaches is few compared with other fields that study cell signaling or metabolic pathways. Most of these models focus on N-linked glycosylation (Shelikoff et al. 1996; Umana and Bailey 1997; Krambeck and Betenbaugh 2005; Hossler et al. 2007; Lau et al. 2007). The model by Umana and Bailey (1997) examines N-linked glycosylation based on experimentally determined rate constants, but it does not attempt to relate model output with experimentally determined glycan distribution. Krambeck and Betenbaugh (2005) make this comparison with experimental data. Their most recent effort (Krambeck et al. 2009) attempts to match matrix-assisted laser desorption/ionization time-of-flight (MALDI-TOF) mass spectrometer (MS) data of normal and leukemic monocytes by varying the rate constants of 19 enzymes that participate in N-glycan biosynthesis. In another extension of this concept, Hossler et al. (2007) simulated N-glycan biosynthesis pathways in two reactor configurations that simulate either glycoprotein movement across the Golgi (four continuous stirred-tank reactors in series) or cisternal maturation and vesicular transport (four plug flow reactors in series). These investigators also define hypothetical conditions where glycan micro-heterogeneity may be minimized. In a rigorous investigation, Lau et al. (2007) combine experiments with theory to demonstrate that the production of branched tri- and tetra-antennary N-glycans is ultrasensitive to hexosamine flux. By integrating a set of component models during analysis, these authors also demonstrate that the number and degree of branched N-glycans regulate cell-surface glycoprotein levels, cell growth and arrest function. These results have implications for salvage pathways and disorders that can be treated through salvage. Other attempts to apply mathematical modeling in the field of glycobiology focus on a limited set of reactions and not entire reaction networks (Monica et al. 1997; Bieberich and Yu 1999; Gerken 2004).
While these previous papers focus on N-glycan biosynthesis, we developed the first reaction network for modeling O-linked glycosylation (Liu et al. 2008; Figure 6). The goal of this study was to determine: (i) the rate limiting steps regulating the formation of O-glycans on P-selectin glycoprotein ligand (PSGL)-1 since these carbohydrates play an important role in mediating selectin-mediated leukocyte-endothelium adhesion during inflammation; and (ii) the extent to which computer simulations of O-glycosylation networks can fit experimentally derived glycan distribution data. To test this possibility, we gleaned experimental data on the distribution of O-glycans of PSGL-1 from literature (Aeed et al. 1998). By varying the rate constants and reaction pathway structure in the in silico O-glycosylation model, we then attempts to match the output of the computer model (Liu et al. 2008) with that of the measured experimental data (Aeed et al. 1998). The primary system output of this reaction network is the sLeX glycan (shown in Figure 6). The model parameters include five glycosyltransferase lumped rate constants, ki (these are the fitted unknowns). The in silico estimates of glycosyltransferase rate constants (Liu et al. 2008) were then compared with wet-lab experiments that measured these same enzyme activities (Marathe et al. 2008), and this confirmed that the in silico modeling approach was appropriate. For illustrative purposes, this example is further elaborated upon in the remaining portions of this manuscript.
Fig. 6.

O-Glycosylation reaction network. (A) The single compartment O-linked glycosylation model for the synthesis of sLeX-type structures in human leukocyte. The core-2 trisaccharide (Galβ1,3(GlcNAcβ1,6)GalNAcα-, species S1) is input into a well-mixed reactor that contains five enzyme activities labeled E1–5 (corresponding to GalT, two SialylTs, GlcNAcT and FucT). The rate constant values of these five rate constants are the unknowns. sLeX-type structures are generated on species S14 and S17 (red box). Glycan distribution generated by computer modeling is compared with experimental data by optimizing both model structure and enzyme rate constants (E1–5). (B) Eight hundred thirty-seven subset models were generated by deleting one or more species and associated reactions in the master pathway shown in (A). Hybrid-genetic algorithm was used to fit each of these models. Superior models have smaller fitness functions. The master pathway containing all reactions does not converge to experimental data as well as many of the subset models.
Simulation and optimization: reaction rate constants and model structure
Whether Glycomics data come from conventional experiments or from high-throughput datasets, fitting model parameters to experimental data is a challenge (Banga 2008). In this regard, there are two problems here that are not clearly separable: (i) finding a suitable model structure that is appropriate for the experiment; and (ii) determining model parameters that fit this “suitable model”. We consider the second problem first since this is more tractable.
Global and local optimization to define reaction rate constants
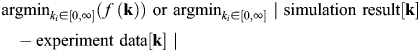
The goal here is to minimize the objective or cost function f(k), which is a measure of the error between model simulation results (“dry data”) and biological experimental data (“wet data”). In our example, simulation and experimental data represent glycan distribution data (Figure 6), the difference between which is minimized by varying the rate constants ki:
 |
(4) |
Due to the nature of the reactions (Figure 4B), the optimization problem is inherently non-linear, with possible differential-algebraic constraints. Solution can be attempted using either local or global optimization methods. Local methods determine solutions in the proximity of the starting guess. Global search algorithms span the entire parameter space and these are suitable when multiple solutions may exist. Due to this nature, global optimization methods are computationally expensive, and they converge more slowly compared with local optimization methods. Determination of the ideal solution cannot be guaranteed using global optimization routines. Taking this into consideration, our approach is to perform global optimization (genetic algorithm) first to find the neighborhood of the solution, and then to use local minimization (quasi-Newton method) to converge to the precise solution (Liu et al. 2008). This methodology is termed “hybrid-genetic algorithm”.
Genetic algorithm is a global optimization procedure that is inspired by Darwinian evolution. It includes many features that are common to natural inheritance like cross-over which is expected when there is genetic recombination, mutations that can occur naturally with some frequency and selection that aims to preserve the fittest species. In these calculations, in the first step, several sets of “parent” rate constants are generated at random, such that each set satisfies the constraints of the solution space. In our previous work that had five unknown rate constants (Liu et al. 2008), thus we generated 50 sets of “parent rate constants”. Each of these sets is denoted by the array k, and it represents an initial guess for the solution of the optimization problem. The fitness of each of these “parents” is evaluated using the objective/cost function [Eq. (4)]. In the next iteration, although a few (say four) of the fittest or “elite” parents with the smallest objective function are preserved or “selected”, the remaining k arrays are regenerated by either “crossing/mixing” rate constants among the parent sets and/or by generating additional diversity by randomly perturbing or “mutating” selected constants. The fitness of the new generation is then evaluated and the selection, cross-over and mutation steps are repeated again to refine the “elite” parents. This procedure is repeated a number of times. In general, the “elite” parents converge quite rapidly in the first few iterations, whereas the subsequent refinement of the solution proceeds quite slowly. Besides genetic algorithms, other techniques that can be used for solution of the global optimization problem include simulated annealing (Wolkenhauer 2007; Song et al. 2010) and other evolutionary programming methods (Moles et al. 2003; Patil et al. 2005).
Once we identify the vicinity of the global solution space, local optimization strategies can be used to rapidly refine the solution. These methods typically focus on the gradient of the function (∇f(k)) in the vicinity of the starting guess. Based on the gradient, the calculation steps the rate constant k in order to minimize the objective function until the convergence criteria are met. A common local optimizer is the iterative Newton method. According to this, if the function f(k) is twice differentiable, the sequence of k can be refined by:
The above scheme can be generalized in higher order matrix form by writing
| (5) |
Other variants of local optimization routines exist including the quasi-Newton method, conjugate gradient method and steepest descent method (Ashyraliyev et al. 2008). The precise choice of local optimization programs used depends on the nature of the problem.
Subset modeling to define model structure
The uncertainty of glycosylation models not only lies in the large parameter space, but also in the variation of the structure of the kinetic model. Estimation of network structure is termed “model reconstruction”. A heuristic approach to optimizing the network involves identifying all possible models fitting the experimental data and then extract the common features among the best data-fitted networks. This concept has been applied in our study of O-linked glycosylation (Liu et al. 2008). Here, an algorithm is proposed to generate a number of potential reaction networks using a concept called “subset modeling”. In this approach, individual species and associated reactions in the master pathway (which contains all possible reactions and species) are deleted sequentially. Either one or more than one species is deleted for a single simulation to generate subsets of the master pathway. The hybrid-genetic algorithm method described in the preceding section is then applied to fit experimental data to the model. The suitability of the subset models is evaluated based on its ability to minimize the f(k). Such analysis results in the ranking of “subset models” based on fitness function. Fitness function for 837 subset models is shown in Figure 6B. As seen, the fitness function for the various models varies over a wide range. Also, fitness of the master pathway which contains all possible biochemical reactions is poor compared with the subset pathways that contain only a fraction of all possible reactions.
Clustering analysis and principal component analysis can be performed to sets of pathways which display fitness function values in a narrow range (Liu et al. 2008). This can be used to quantify the relative contributions of specific network components to system output.
Post-simulation analysis: hypothesis generation
The ultimate goal of simulation programs is to define the “design principles” of nature. However, with the large number of calculations that are possible and the number of model equations and parameters, it is challenging to define intrinsic and dynamic network properties. Post-simulation analysis methods like sensitivity analysis and bifurcation analysis are thus necessary to define the emergent system properties including their robustness, fragility, oscillation, bistability and modularity. Such post-simulation analysis methods can also aid the generation of experimental hypothesis and guide model validation. In this regard, robustness measures the ability of a system to maintain cellular function at a given level even in the face of perturbation and evolution (Kitano 2004; Stelling et al. 2004). Oscillation describes the ability of a system to swing between two equilibrium states or fluctuate around a particular value (Reinke and Gatfield 2006; Pigolotti et al. 2007). Bistability refers to the ability of living cells to move from one state to another abruptly in a switch-like manner (Ferrell 2002; Dubnau and Losick 2006; Lau et al. 2007). System network modularity describes the ability of a module or set of biochemical reactions to function as one unit irrespective of the external connections (Sauro 2008; Kim et al. 2009). Selected post-simulation analysis methods are briefly discussed next.
Sensitivity analysis
Sensitivity analysis, also called parametric sensitivity analysis, is a perturbation method that quantifies the changes in system output in response to a small change in system parameter. System parameter defined here cannot only include the individual reaction rate constants or other kinetic coefficient such as Vm and Km, but they may also include pathway structure and initial concentrations of reacting molecules. System output includes individual species concentration, reaction velocity or functions of interest, e.g. biological oscillation period and amplitude. In the case of our simulations (Liu et al. 2008), we define the sensitivity coefficient based on the glycan sLeX which we define to be the system output. The system parameter considered was the glycosyltransferase rate constant, ki, i.e. we evaluate ∂[sLeX]/∂ki. Normalizing this coefficient is appropriate when comparing the large numbers of parameter sensitivities and for the identification of prominent factors in a complex parameter space. Thus, the scaled sensitivity coefficient is defined as:
| (6) |
Among the methodologies applied to evaluate sensitivity coefficients, the simplest one is the finite difference method (Hornberg et al. 2005; Liu et al. 2005; Wang et al. 2008), which is used to quantify local sensitivities. Here, the response of system output is simulated by manually varying the interested parameter within a small range while holding other parameters at a fixed value. The advantage of this approach is that no other complicated sensitivity equations are required. Another common method to evaluate local sensitivity coefficients is called the “direct differential method” (Liu et al. 2005). The sensitivity coefficients here can be described in terms of sensitivity equations resulting from the differentiation of kinetic ODEs with respect to the system parameters. In this case, sensitivity coefficients are obtained, by simultaneously solving both the sensitivity and kinetic ODEs (Liu et al. 2005). Although the above methods are conceptually straightforward, these techniques can become computationally expensive with increasing the size of the reaction network and the number of system parameters. Therefore, adjoint methods (Cao et al. 2003) or Greens function methods (Hwang et al. 1978; Nikolaev et al. 2007) have been applied to reduce computation time. These methods involve solution of the adjoint sensitivity ODE or Greens function equation associated with the kinetic equation. In comparison with the direct methods, the latter techniques are better suited for cases where the sensitivities of complex system variables have to be evaluated with respect to all system parameters (Rabitz et al. 1983).
Besides evaluating the effect of system perturbation, sensitivity analysis has also been widely used to quantify the robustness of complex biological systems. Parameters and components that are very sensitive to parametric variations can introduce fragility into the system and typically these are not natural properties of the biological system. Although robustness evaluates the overall response of network to perturbation, modularity involves similar analysis of small sections of the larger networks. Sensitivity analysis applied to these modules combined with flux analysis can define non-essential reaction (i.e. reaction with both smaller flux and sensitivity) in a system (Liu et al. 2005). Deletion of these non-essential reactions that only display weak effects on system output enables model reduction. Simplified models emerging from such analysis reveal the “design principles” of biochemical reaction networks.
Bifurcation analysis
Although sensitivity analysis offers quantitative insight regarding the dependency of system dynamics on parameters, bifurcation analysis applied on ODE network models is more focused on qualitatively understanding how the system steady states are affected by system parameters. The states of the biological systems can be stable, unstable or oscillatory. In the parameter space, the point at which the system states shift from one category to another is defined as the “bifurcation point”. At bifurcation points, where the network undergoes a qualitative change, a stable steady state solution may transit to an unstable state or vice versa. During such analysis, bifurcation diagrams display the equilibrium or periodic states of a system as a function of the bifurcation parameter. Four common types of local bifurcations defined in such analysis include saddle-node, transcritical, pitchfork and hopf bifurcations. Among these, saddle-node and hopf bifurcations are common in studies involving cell signaling (Xiong and Ferrell 2003; Bagci et al. 2006), cell cycle regulation (Tyson et al. 2003) and gene regulation networks (Ozbudak et al. 2004).
Detailed bifurcation analysis of glycosylation pathways has not been performed thus far. However, based on similar analysis performed for cell signaling pathways like the mitogen-activated protein kinase (MAP-kinase) signaling network (Bhalla et al. 2002; Angeli et al. 2004; Markevich et al. 2004), one would expect that the application of the Michaelis–Menten equation, the presence of non-linearities due to a large number of reactants and products, positive and/or double-negative feedback loops in glycosylation pathways may lead to bistability in at least some reaction pathways. As shown previously for the MAP-kinase pathway (Qiao et al. 2007), models at different regions of the parameters space may display oscillation and bistability behavior in non-linear systems.
Software resources
With the maturation of the field of Systems Biology, detailed development of simulation code is not necessary in most instances. This is because, there are currently well over a 100 software packages (listed at www.sbml.org) that can be used to perform most simulation and post-simulation analysis. Many of these programs focus on the simulation and analysis of ODE reaction networks, for general purpose or specialized functions. E-cell (Tomita et al. 1999), Copasi (Hoops et al. 2006), Virtual Cell (Schaff and Loew 1999) and Cell Designer (Funahashi et al. 2008) provide a variety of functions including friendly user interfaces for model input, parameter estimation, model simulation and analysis. They may also offer the capability of other functions such as stochastic simulation or partial differentiation equation solvers. SBML editor (Rodriguez et al. 2007) provides functions for input and editing of SBML files directly in a standalone package. IBRENA (Liu and Neelamegham 2008) provides multiple model analysis techniques including both forward and adjoint sensitivity analysis methods and principal component analysis. SBML-SAT (Zi and Klipp 2006) offers several global sensitivity analysis algorithms and robustness analysis. XPP-AUTO (Ermentrout 2002) and bifurcation discovery tool (Chickarmane et al. 2005) can be used for bifurcation analysis of ODE systems.
Conclusion
The advancement of analytical tools in the field of Glycomics is providing new opportunities for the integration of experiments with computer modeling. Such systems-level coupling of experiments with theory can reveal the design principles and emergent properties of glycosylation systems. They can help establish novel quantitative and mechanistic links between gene expression, protein expression, enzyme activity, carbohydrate structure and glycoconjugate function. Beyond uncovering novel Biochemistry and explaining previous experimental/natural observations in quantitative detail, predictions on the possible outcomes of system perturbation on cell function are also a likely outcome, and this can have clinical significance.
Funding
This work was supported by NIH (HL63014) and a grant from the NY State Stem Cell Foundation.
Conflict of interest
None declared.
Abbreviation
ER, endoplasmic reticulum; KEGG, Kyoto Encyclopedia of Genes and Genomes; MALDI-TOF, matrix-assisted laser desorption/ionization-time-of-flight; MAP, mitogen-activated protein; MIM, Molecular Interaction Map; MS, mass spectrometry; ODE, ordinary differential equation; PCR, polymerase chain reaction; PSGL, P-selectin glycoprotein ligand; SBGN, System Biology Graphical Notation; SBML, Systems Biology Markup Language; sLeX, sialyl Lewis-X; XML, eXtensible Markup Language.
References
- Aeed PA, Geng JG, Asa D, Raycroft L, Ma L, Elhammer AP. Characterization of the O-linked oligosaccharide structures on P-selectin glycoprotein ligand-1 (PSGL-1) Glycoconj J. 1998;15:975–985. doi: 10.1023/a:1006985825141. [DOI] [PubMed] [Google Scholar]
- Albert R, Wang RS. Discrete dynamic modeling of cellular signaling networks. Methods Enzymol. 2009;467:281–306. doi: 10.1016/S0076-6879(09)67011-7. [DOI] [PubMed] [Google Scholar]
- Aldridge BB, Burke JM, Lauffenburger DA, Sorger PK. Physicochemical modelling of cell signalling pathways. Nat Cell Biol. 2006;8:1195–1203. doi: 10.1038/ncb1497. [DOI] [PubMed] [Google Scholar]
- Angeli D, Ferrell JE, Jr, Sontag ED. Detection of multistability, bifurcations, and hysteresis in a large class of biological positive-feedback systems. Proc Natl Acad Sci U S A. 2004;101:1822–1827. doi: 10.1073/pnas.0308265100. [DOI] [PMC free article] [PubMed] [Google Scholar]
- Aoki-Kinoshita KF. An introduction to bioinformatics for glycomics research. PLoS Comput Biol. 2008;4 doi: 10.1371/journal.pcbi.1000075. e1000075. [DOI] [PMC free article] [PubMed] [Google Scholar]
- Apweiler R, Hermjakob H, Sharon N. On the frequency of protein glycosylation, as deduced from analysis of the SWISS-PROT database. Biochim Biophys Acta. 1999;1473:4–8. doi: 10.1016/s0304-4165(99)00165-8. [DOI] [PubMed] [Google Scholar]
- Ashyraliyev M, Jaeger J, Blom JG. Parameter estimation and determinability analysis applied to Drosophila gap gene circuits. BMC Syst Biol. 2008;2:83. doi: 10.1186/1752-0509-2-83. [DOI] [PMC free article] [PubMed] [Google Scholar]
- Bagci EZ, Vodovotz Y, Billiar TR, Ermentrout GB, Bahar I. Bistability in apoptosis: roles of bax, bcl-2, and mitochondrial permeability transition pores. Biophys J. 2006;90:1546–1559. doi: 10.1529/biophysj.105.068122. [DOI] [PMC free article] [PubMed] [Google Scholar]
- Banga JR. Optimization in computational systems biology. BMC Syst Biol. 2008;2:47. doi: 10.1186/1752-0509-2-47. [DOI] [PMC free article] [PubMed] [Google Scholar]
- Bhalla US, Ram PT, Iyengar R. MAP kinase phosphatase as a locus of flexibility in a mitogen-activated protein kinase signaling network. Science. 2002;297:1018–1023. doi: 10.1126/science.1068873. [DOI] [PubMed] [Google Scholar]
- Bieberich E, Yu RK. Multi-enzyme kinetic analysis of glycolipid biosynthesis. Biochim Biophys Acta. 1999;1432:113–124. doi: 10.1016/s0167-4838(99)00085-0. [DOI] [PubMed] [Google Scholar]
- Blixt O, Head S, Mondala T, Scanlan C, Huflejt ME, Alvarez R, Bryan MC, Fazio F, Calarese D, Stevens J, et al. Printed covalent glycan array for ligand profiling of diverse glycan binding proteins. Proc Natl Acad Sci U S A. 2004;101:17033–17038. doi: 10.1073/pnas.0407902101. [DOI] [PMC free article] [PubMed] [Google Scholar]
- Boyle J. Gene-Expression Omnibus integration and clustering tools in SeqExpress. Bioinformatics. 2005;21:2550–2551. doi: 10.1093/bioinformatics/bti355. [DOI] [PubMed] [Google Scholar]
- Cao Y, Li ST, Petzold L, Serban R. Adjoint sensitivity analysis or differential-algebraic equations: The adjoint DAE system and its numerical solution. Siam Journal on Scientific Computing. 2003;24:1076–1089. [Google Scholar]
- Chang A, Scheer M, Grote A, Schomburg I, Schomburg D. BRENDA, AMENDA and FRENDA the enzyme information system: new content and tools in 2009. Nucleic Acids Res. 2009;37:D588–592. doi: 10.1093/nar/gkn820. [DOI] [PMC free article] [PubMed] [Google Scholar]
- Chen S, LaRoche T, Hamelinck D, Bergsma D, Brenner D, Simeone D, Brand RE, Haab BB. Multiplexed analysis of glycan variation on native proteins captured by antibody microarrays. Nat Methods. 2007;4:437–444. doi: 10.1038/nmeth1035. [DOI] [PubMed] [Google Scholar]
- Chickarmane V, Paladugu SR, Bergmann F, Sauro HM. Bifurcation discovery tool. Bioinformatics. 2005;21:3688–3690. doi: 10.1093/bioinformatics/bti603. [DOI] [PubMed] [Google Scholar]
- Cooper CA, Joshi HJ, Harrison MJ, Wilkins MR, Packer NH. GlycoSuiteDB: a curated relational database of glycoprotein glycan structures and their biological sources. 2003 update. Nucleic Acids Res. 2003;31:511–513. doi: 10.1093/nar/gkg099. [DOI] [PMC free article] [PubMed] [Google Scholar]
- Dubnau D, Losick R. Bistability in bacteria. Mol Microbiol. 2006;61:564–572. doi: 10.1111/j.1365-2958.2006.05249.x. [DOI] [PubMed] [Google Scholar]
- Ermentrout B. Simulating, analyzing, and animating dynamical systems : a guide to XPPAUT for researchers and students. Philadelphia: Society for Industrial and Applied Mathematics; 2002. [Google Scholar]
- Ferrell JE., Jr. Self-perpetuating states in signal transduction: positive feedback, double-negative feedback and bistability. Curr Opin Cell Biol. 2002;14:140–148. doi: 10.1016/s0955-0674(02)00314-9. [DOI] [PubMed] [Google Scholar]
- Frank M, Schloissnig S. Bioinformatics and molecular modeling in glycobiology. Cell Mol Life Sci. 2010;67:2749–2772. doi: 10.1007/s00018-010-0352-4. [DOI] [PMC free article] [PubMed] [Google Scholar]
- Freeze HH. Congenital Disorders of Glycosylation: CDG-I, CDG-II, and beyond. Curr Mol Med. 2007;7:389–396. doi: 10.2174/156652407780831548. [DOI] [PubMed] [Google Scholar]
- Funahashi A, Matsuoka Y, Jouraku A, Morohashi M, Kikuchi N, Kitano H. CellDesigner 3.5: A versatile modeling tool for biochemical networks. Proceedings of the Ieee. 2008;96:1254–1265. [Google Scholar]
- Garny A, Nickerson DP, Cooper J, Weber dos Santos R, Miller AK, McKeever S, Nielsen PM, Hunter PJ. CellML and associated tools and techniques. Philos Transact A Math Phys Eng Sci. 2008;366:3017–3043. doi: 10.1098/rsta.2008.0094. [DOI] [PubMed] [Google Scholar]
- Gerken TA. Kinetic modeling confirms the biosynthesis of mucin core 1 (beta-Gal(1-3) alpha-GalNAc-O-Ser/Thr) O-glycan structures are modulated by neighboring glycosylation effects. Biochemistry. 2004;43:4137–4142. doi: 10.1021/bi036306a. [DOI] [PubMed] [Google Scholar]
- Hashimoto K, Goto S, Kawano S, Aoki-Kinoshita KF, Ueda N, Hamajima M, Kawasaki T, Kanehisa M. KEGG as a glycome informatics resource. Glycobiology. 2006;16:63R–70R. doi: 10.1093/glycob/cwj010. [DOI] [PubMed] [Google Scholar]
- Hashimoto R, Hirose K, Sato T, Fukushima N, Miura N, Nishimura SI. Functional network of glycan-related molecules: Glyco-Net in Glycoconjugate Data Bank. BMC Syst Biol. 2010;4:91. doi: 10.1186/1752-0509-4-91. [DOI] [PMC free article] [PubMed] [Google Scholar]
- Herget S, Ranzinger R, Maass K, Lieth CW. GlycoCT-a unifying sequence format for carbohydrates. Carbohydr Res. 2008;343:2162–2171. doi: 10.1016/j.carres.2008.03.011. [DOI] [PubMed] [Google Scholar]
- Hoops S, Sahle S, Gauges R, Lee C, Pahle J, Simus N, Singhal M, Xu L, Mendes P, Kummer U. COPASI–a COmplex PAthway SImulator. Bioinformatics. 2006;22:3067–3074. doi: 10.1093/bioinformatics/btl485. [DOI] [PubMed] [Google Scholar]
- Hornberg JJ, Binder B, Bruggeman FJ, Schoeberl B, Heinrich R, Westerhoff HV. Control of MAPK signalling: from complexity to what really matters. Oncogene. 2005;24:5533–5542. doi: 10.1038/sj.onc.1208817. [DOI] [PubMed] [Google Scholar]
- Hossler P, Mulukutla BC, Hu WS. Systems analysis of N-glycan processing in mammalian cells. PLoS One. 2007;2 doi: 10.1371/journal.pone.0000713. e713. [DOI] [PMC free article] [PubMed] [Google Scholar]
- Hsu KL, Mahal LK. Sweet tasting chips: microarray-based analysis of glycans. Curr Opin Chem Biol. 2009;13:427–432. doi: 10.1016/j.cbpa.2009.07.013. [DOI] [PubMed] [Google Scholar]
- Hucka M, Finney A, Sauro HM, Bolouri H, Doyle JC, Kitano H, Arkin AP, Bornstein BJ, Bray D, Cornish-Bowden A, et al. The systems biology markup language (SBML): a medium for representation and exchange of biochemical network models. Bioinformatics. 2003;19:524–531. doi: 10.1093/bioinformatics/btg015. [DOI] [PubMed] [Google Scholar]
- Hwang JT, Dougherty EP, Rabitz S, Rabitz H. Greens Function Method of Sensitivity Analysis in Chemical-Kinetics. Journal of Chemical Physics. 1978;69:5180–5191. [Google Scholar]
- Ikeo K, Ishi-i J, Tamura T, Gojobori T, Tateno Y. CIBEX: center for information biology gene expression database. C R Biol. 2003;326:1079–1082. doi: 10.1016/j.crvi.2003.09.034. [DOI] [PubMed] [Google Scholar]
- Ito H, Kuno A, Sawaki H, Sogabe M, Ozaki H, Tanaka Y, Mizokami M, Shoda J, Angata T, Sato T, et al. Strategy for glycoproteomics: identification of glyco-alteration using multiple glycan profiling tools. J Proteome Res. 2009;8:1358–1367. doi: 10.1021/pr800735j. [DOI] [PubMed] [Google Scholar]
- Jaeken J, Matthijs G. Congenital disorders of glycosylation: a rapidly expanding disease family. Annu Rev Genomics Hum Genet. 2007;8:261–278. doi: 10.1146/annurev.genom.8.080706.092327. [DOI] [PubMed] [Google Scholar]
- Jafar-Nejad H, Leonardi J, Fernandez-Valdivia R. Role of glycans and glycosyltransferases in the regulation of Notch signaling. Glycobiology. 2010;20:931–949. doi: 10.1093/glycob/cwq053. [DOI] [PMC free article] [PubMed] [Google Scholar]
- Janes KA, Yaffe MB. Data-driven modelling of signal-transduction networks. Nat Rev Mol Cell Biol. 2006;7:820–828. doi: 10.1038/nrm2041. [DOI] [PubMed] [Google Scholar]
- Jayakumar D, Marathe DD, Neelamegham S. Detection of site-specific glycosylation in proteins using flow cytometry. Cytometry A. 2009;75:866–873. doi: 10.1002/cyto.a.20773. [DOI] [PMC free article] [PubMed] [Google Scholar]
- Kikuchi N, Kameyama A, Nakaya S, Ito H, Sato T, Shikanai T, Takahashi Y, Narimatsu H. The carbohydrate sequence markup language (CabosML): an XML description of carbohydrate structures. Bioinformatics. 2005;21:1717–1718. doi: 10.1093/bioinformatics/bti152. [DOI] [PubMed] [Google Scholar]
- Kim PJ, Lee DY, Jeong H. Centralized modularity of N-linked glycosylation pathways in mammalian cells. PLoS One. 2009;4 doi: 10.1371/journal.pone.0007317. e7317. [DOI] [PMC free article] [PubMed] [Google Scholar]
- Kitano H. Biological robustness. Nat Rev Genet. 2004;5:826–837. doi: 10.1038/nrg1471. [DOI] [PubMed] [Google Scholar]
- Kohn KW, Aladjem MI, Kim S, Weinstein JN, Pommier Y. Depicting combinatorial complexity with the molecular interaction map notation. Mol Syst Biol. 2006;2:51. doi: 10.1038/msb4100088. [DOI] [PMC free article] [PubMed] [Google Scholar]
- Krambeck FJ, Bennun SV, Narang S, Choi S, Yarema KJ, Betenbaugh MJ. A mathematical model to derive N-glycan structures and cellular enzyme activities from mass spectrometric data. Glycobiology. 2009;19:1163–1175. doi: 10.1093/glycob/cwp081. [DOI] [PMC free article] [PubMed] [Google Scholar]
- Krambeck FJ, Betenbaugh MJ. A mathematical model of N-linked glycosylation. Biotechnol Bioeng. 2005;92:711–728. doi: 10.1002/bit.20645. [DOI] [PubMed] [Google Scholar]
- Kuno A, Kato Y, Matsuda A, Kaneko MK, Ito H, Amano K, Chiba Y, Narimatsu H, Hirabayashi J. Focused differential glycan analysis with the platform antibody-assisted lectin profiling for glycan-related biomarker verification. Mol Cell Proteomics. 2009;8:99–108. doi: 10.1074/mcp.M800308-MCP200. [DOI] [PubMed] [Google Scholar]
- Lau KS, Partridge EA, Grigorian A, Silvescu CI, Reinhold VN, Demetriou M, Dennis JW. Complex N-glycan number and degree of branching cooperate to regulate cell proliferation and differentiation. Cell. 2007;129:123–134. doi: 10.1016/j.cell.2007.01.049. [DOI] [PubMed] [Google Scholar]
- Le Novere N, Hucka M, Mi H, Moodie S, Schreiber F, Sorokin A, Demir E, Wegner K, Aladjem MI, Wimalaratne SM, et al. The Systems Biology Graphical Notation. Nat Biotechnol. 2009;27:735–741. doi: 10.1038/nbt.1558. [DOI] [PubMed] [Google Scholar]
- Liu G, Marathe DD, Matta KL, Neelamegham S. Systems-level modeling of cellular glycosylation reaction networks: O-linked glycan formation on natural selectin ligands. Bioinformatics. 2008;24:2740–2747. doi: 10.1093/bioinformatics/btn515. [DOI] [PMC free article] [PubMed] [Google Scholar]
- Liu G, Neelamegham S. In silico Biochemical Reaction Network Analysis (IBRENA): a package for simulation and analysis of reaction networks. Bioinformatics. 2008;24:1109–1111. doi: 10.1093/bioinformatics/btn061. [DOI] [PubMed] [Google Scholar]
- Liu G, Swihart MT, Neelamegham S. Sensitivity, principal component and flux analysis applied to signal transduction: the case of epidermal growth factor mediated signaling. Bioinformatics. 2005;21:1194–1202. doi: 10.1093/bioinformatics/bti118. [DOI] [PubMed] [Google Scholar]
- Mamitsuka H. Informatic innovations in glycobiology: relevance to drug discovery. Drug Discov Today. 2008;13:118–123. doi: 10.1016/j.drudis.2007.10.013. [DOI] [PubMed] [Google Scholar]
- Marathe DD, Chandrasekaran EV, Lau JT, Matta KL, Neelamegham S. Systems-level studies of glycosyltransferase gene expression and enzyme activity that are associated with the selectin binding function of human leukocytes. Faseb J. 2008;22:4154–4167. doi: 10.1096/fj.07-104257. [DOI] [PMC free article] [PubMed] [Google Scholar]
- Markevich NI, Hoek JB, Kholodenko BN. Signaling switches and bistability arising from multisite phosphorylation in protein kinase cascades. J Cell Biol. 2004;164:353–359. doi: 10.1083/jcb.200308060. [DOI] [PMC free article] [PubMed] [Google Scholar]
- McEver RP, Cummings RD. Perspectives series: cell adhesion in vascular biology. Role of PSGL-1 binding to selectins in leukocyte recruitment. J Clin Invest. 1997;100:485–491. doi: 10.1172/JCI119556. [DOI] [PMC free article] [PubMed] [Google Scholar]
- Mechref Y, Novotny MV. Glycomic analysis by capillary electrophoresis-mass spectrometry. Mass Spectrom Rev. 2009;28:207–222. doi: 10.1002/mas.20196. [DOI] [PubMed] [Google Scholar]
- Moles CG, Mendes P, Banga JR. Parameter estimation in biochemical pathways: a comparison of global optimization methods. Genome Res. 2003;13:2467–2474. doi: 10.1101/gr.1262503. [DOI] [PMC free article] [PubMed] [Google Scholar]
- Monica TJ, Andersen DC, Goochee CF. A mathematical model of sialylation of N-linked oligosaccharides in the trans-Golgi network. Glycobiology. 1997;7:515–521. doi: 10.1093/glycob/7.4.515. [DOI] [PubMed] [Google Scholar]
- Morris MK, Saez-Rodriguez J, Sorger PK, Lauffenburger DA. Logic-based models for the analysis of cell signaling networks. Biochemistry. 2010;49:3216–3224. doi: 10.1021/bi902202q. [DOI] [PMC free article] [PubMed] [Google Scholar]
- Nairn AV, York WS, Harris K, Hall EM, Pierce JM, Moremen KW. Regulation of glycan structures in animal tissues: transcript profiling of glycan-related genes. J Biol Chem. 2008;283:17298–17313. doi: 10.1074/jbc.M801964200. [DOI] [PMC free article] [PubMed] [Google Scholar]
- Neelamegham S. Transport features, reaction kinetics and receptor biomechanics controlling selectin and integrin mediated cell adhesion. Cell Commun Adhes. 2004;11:35–50. doi: 10.1080/15419060490471793. [DOI] [PubMed] [Google Scholar]
- Ng A, Bursteinas B, Gao Q, Mollison E, Zvelebil M. Resources for integrative systems biology: from data through databases to networks and dynamic system models. Brief Bioinform. 2006;7:318–330. doi: 10.1093/bib/bbl036. [DOI] [PubMed] [Google Scholar]
- Nikolaev EV, Atlas JC, Shuler ML. Sensitivity and control analysis of periodically forced reaction networks using the Green's function method. J Theor Biol. 2007;247:442–461. doi: 10.1016/j.jtbi.2007.02.013. [DOI] [PubMed] [Google Scholar]
- North SJ, Hitchen PG, Haslam SM, Dell A. Mass spectrometry in the analysis of N-linked and O-linked glycans. Curr Opin Struct Biol. 2009;19:498–506. doi: 10.1016/j.sbi.2009.05.005. [DOI] [PMC free article] [PubMed] [Google Scholar]
- Orth JD, Thiele I, Palsson BO. What is flux balance analysis? Nat Biotechnol. 2010;28:245–248. doi: 10.1038/nbt.1614. [DOI] [PMC free article] [PubMed] [Google Scholar]
- Ozbudak EM, Thattai M, Lim HN, Shraiman BI, Van Oudenaarden A. Multistability in the lactose utilization network of Escherichia coli. Nature. 2004;427:737–740. doi: 10.1038/nature02298. [DOI] [PubMed] [Google Scholar]
- Parkinson H, Kapushesky M, Shojatalab M, Abeygunawardena N, Coulson R, Farne A, Holloway E, Kolesnykov N, Lilja P, Lukk M, et al. ArrayExpress–a public database of microarray experiments and gene expression profiles. Nucleic Acids Res. 2007;35:D747–750. doi: 10.1093/nar/gkl995. [DOI] [PMC free article] [PubMed] [Google Scholar]
- Patil KR, Rocha I, Forster J, Nielsen J. Evolutionary programming as a platform for in silico metabolic engineering. BMC Bioinformatics. 2005;6:308. doi: 10.1186/1471-2105-6-308. [DOI] [PMC free article] [PubMed] [Google Scholar]
- Paulson JC, Blixt O, Collins BE. Sweet spots in functional glycomics. Nat Chem Biol. 2006;2:238–248. doi: 10.1038/nchembio785. [DOI] [PubMed] [Google Scholar]
- Pigolotti S, Krishna S, Jensen MH. Oscillation patterns in negative feedback loops. Proc Natl Acad Sci U S A. 2007;104:6533–6537. doi: 10.1073/pnas.0610759104. [DOI] [PMC free article] [PubMed] [Google Scholar]
- Pilobello KT, Slawek DE, Mahal LK. A ratiometric lectin microarray approach to analysis of the dynamic mammalian glycome. Proc Natl Acad Sci U S A. 2007;104:11534–11539. doi: 10.1073/pnas.0704954104. [DOI] [PMC free article] [PubMed] [Google Scholar]
- Qiao L, Nachbar RB, Kevrekidis IG, Shvartsman SY. Bistability and oscillations in the Huang-Ferrell model of MAPK signaling. PLoS Comput Biol. 2007;3:1819–1826. doi: 10.1371/journal.pcbi.0030184. [DOI] [PMC free article] [PubMed] [Google Scholar]
- Rabitz H, Kramer M, Dacol D. Sensitivity Analysis in Chemical-Kinetics. Annual Review of Physical Chemistry. 1983;34:419–461. [Google Scholar]
- Raman R, Raguram S, Venkataraman G, Paulson JC, Sasisekharan R. Glycomics: an integrated systems approach to structure-function relationships of glycans. Nat Methods. 2005;2:817–824. doi: 10.1038/nmeth807. [DOI] [PubMed] [Google Scholar]
- Ranzinger R, Frank M, von der Lieth CW, Herget S. Glycome-DB.org: a portal for querying across the digital world of carbohydrate sequences. Glycobiology. 2009;19:1563–1567. doi: 10.1093/glycob/cwp137. [DOI] [PubMed] [Google Scholar]
- Reinke H, Gatfield D. Genome-wide oscillation of transcription in yeast. Trends Biochem Sci. 2006;31:189–191. doi: 10.1016/j.tibs.2006.02.001. [DOI] [PubMed] [Google Scholar]
- Rodriguez N, Donizelli M, Le Novere N. SBMLeditor: effective creation of models in the Systems Biology Markup language (SBML) BMC Bioinformatics. 2007;8:79. doi: 10.1186/1471-2105-8-79. [DOI] [PMC free article] [PubMed] [Google Scholar]
- Rojas I, Golebiewski M, Kania R, Krebs O, Mir S, Weidemann A, Wittig U. Storing and annotating of kinetic data. In Silico Biol. 2007;7:S37–44. [PubMed] [Google Scholar]
- Sackstein R. Glycosyltransferase-programmed stereosubstitution (GPS) to create HCELL: engineering a roadmap for cell migration. Immunol Rev. 2009;230:51–74. doi: 10.1111/j.1600-065X.2009.00792.x. [DOI] [PMC free article] [PubMed] [Google Scholar]
- Sahoo SS, Thomas C, Sheth A, Henson C, York WS. GLYDE-an expressive XML standard for the representation of glycan structure. Carbohydr Res. 2005;340:2802–2807. doi: 10.1016/j.carres.2005.09.019. [DOI] [PubMed] [Google Scholar]
- Sauro HM. Modularity defined. Mol Syst Biol. 2008;4:166. doi: 10.1038/msb.2008.3. [DOI] [PMC free article] [PubMed] [Google Scholar]
- Schaff J, Loew LM. The virtual cell. Pac Symp Biocomput. 1999;4:228–239. doi: 10.1142/9789814447300_0023. [DOI] [PubMed] [Google Scholar]
- Shelikoff M, Sinskey AJ, Stephanopoulos G. A modeling framework for the study of protein glycosylation. Biotechnology and Bioengineering. 1996;50:73–90. doi: 10.1002/(SICI)1097-0290(19960405)50:1<73::AID-BIT9>3.0.CO;2-Z. [DOI] [PubMed] [Google Scholar]
- Song SO, Chakrabarti A, Varner JD. Ensembles of signal transduction models using Pareto Optimal Ensemble Techniques (POETs) Biotechnol J. 2010;5:768–780. doi: 10.1002/biot.201000059. [DOI] [PMC free article] [PubMed] [Google Scholar]
- Stelling J, Sauer U, Szallasi Z, Doyle FJ, 3rd, Doyle J. Robustness of cellular functions. Cell. 2004;118:675–685. doi: 10.1016/j.cell.2004.09.008. [DOI] [PubMed] [Google Scholar]
- Taniguchi N, Honke K, Fukuda M. Handbook of glycosyltransferases and related genes. Springer-Verlag: Tokyo; 2002. [Google Scholar]
- Tomita M, Hashimoto K, Takahashi K, Shimizu TS, Matsuzaki Y, Miyoshi F, Saito K, Tanida S, Yugi K, Venter JC, et al. E-CELL: software environment for whole-cell simulation. Bioinformatics. 1999;15:72–84. doi: 10.1093/bioinformatics/15.1.72. [DOI] [PubMed] [Google Scholar]
- Tyson JJ, Chen KC, Novak B. Sniffers, buzzers, toggles and blinkers: dynamics of regulatory and signaling pathways in the cell. Curr Opin Cell Biol. 2003;15:221–231. doi: 10.1016/s0955-0674(03)00017-6. [DOI] [PubMed] [Google Scholar]
- Umana P, Bailey JE. A mathematical model of N-linked glycoform biosynthesis. Biotechnol Bioeng. 1997;55:890–908. doi: 10.1002/(SICI)1097-0290(19970920)55:6<890::AID-BIT7>3.0.CO;2-B. [DOI] [PubMed] [Google Scholar]
- Varki A, Cummings RD, Esko JD, Freeze HH, Stanley P, Bertozzi CR, Hart GW, Etzler ME. Essentials of glycobiology. Cold Spring Harbor: Cold Spring Harbor Laboratory Press; 2008. [PubMed] [Google Scholar]
- Wang ZH, Birch CM, Deisboeck TS. Cross-scale sensitivity analysis of a non-small cell lung cancer model: Linking molecular signaling properties to cellular behavior. Biosystems. 2008;92:249–258. doi: 10.1016/j.biosystems.2008.03.002. [DOI] [PMC free article] [PubMed] [Google Scholar]
- Wolkenhauer O. Defining systems biology: an engineering perspective. IET Syst Biol. 2007;1:204–206. doi: 10.1049/iet-syb:20079017. [DOI] [PubMed] [Google Scholar]
- Xia B, Kawar ZS, Ju T, Alvarez RA, Sachdev GP, Cummings RD. Versatile fluorescent derivatization of glycans for glycomic analysis. Nat Methods. 2005;2:845–850. doi: 10.1038/nmeth808. [DOI] [PubMed] [Google Scholar]
- Xiong W, Ferrell JE., Jr. A positive-feedback-based bistable ‘memory module’ that governs a cell fate decision. Nature. 2003;426:460–465. doi: 10.1038/nature02089. [DOI] [PubMed] [Google Scholar]
- Zaia J. On-line separations combined with MS for analysis of glycosaminoglycans. Mass Spectrom Rev. 2009;28:254–272. doi: 10.1002/mas.20200. [DOI] [PMC free article] [PubMed] [Google Scholar]
- Zi Z, Klipp E. SBML-PET: a Systems Biology Markup Language-based parameter estimation tool. Bioinformatics. 2006;22:2704–2705. doi: 10.1093/bioinformatics/btl443. [DOI] [PubMed] [Google Scholar]