

Abstract
The primary auditory cortex (A1) is involved in sound localization. A consistent observation in A1 is a clustered representation of binaural properties, but how spatial tuning varies within binaural clusters is unknown. Here, this issue was addressed in A1 of the pallid bat, a species that relies on passive hearing (as opposed to echolocation) to localize prey. Evidence is presented for systematic representations of sound azimuth within two binaural clusters in the pallid bat A1: the binaural inhibition (EI) and peaked (P) binaural interaction clusters. The representation is not a “point-to-point” space map as seen in the superior colliculus, but is in the form of a systematic increase in the area of activated cortex as azimuth changes from ipsilateral to contralateral locations. The underlying substrate in the EI cluster is a systematic representation of the medial boundary of azimuth receptive fields. The P cluster is activated mostly for sounds near the midline, providing a spatial acoustic fovea. Activity in the P cluster falls off systematically as the sound is moved to more lateral locations. Sensitivity to interaural intensity differences predicts azimuth tuning in the vast majority of neurons. Azimuth receptive field properties are relatively stable across intensity over a moderate range (20–40 dB above threshold) of intensities. This suggests that the maps will be similar across the intensities tested. These results challenge the current view that no systematic representation of azimuth is present in A1 and show that such representations are present locally within individual binaural clusters.
Introduction
Sound localization is a primary function of the auditory system. Given that auditory space is not directly represented in the cochlea, studies of sound localization mechanisms provide insights on how the brain constructs computational maps. Lesion studies show that the primary auditory cortex (A1) is involved in sound localization (Whitfield et al., 1972; Casseday and Diamond, 1977; Jenkins and Masterton, 1982; Jenkins and Merzenich, 1984; Heffner, 1997; Malhotra et al., 2004; King et al., 2007). However, knowledge of how A1 encodes space remains rudimentary. Based on the broad spatial tuning curves of neurons, it is accepted that A1 relies on population codes to represent azimuth (Middlebrooks et al., 1994; Furukawa et al., 2000; Nakamoto et al., 2004; Miller and Recanzone, 2009). Azimuth tuning is shaped by sensitivity to binaural differences, sound frequency, and ear directionality. A consistent finding in A1 is that neurons with similar binaural properties are clustered together (Imig and Adrián, 1977; Middlebrooks et al., 1980; Kelly and Judge, 1994; Liu and Suga, 1997; Recanzone et al., 1999). How these binaural clusters participate in population codes of azimuth remains unclear.
Hypotheses on the role of A1 in sound localization are based on studies that mapped azimuth or binaural representation across A1, encompassing multiple binaural clusters (Middlebrooks and Pettigrew, 1981; Rajan et al., 1990). Azimuth is not systematically represented in any obvious way across the sequence of binaural clusters. Based on these studies, the current view is that there is no systematic topographical representation of azimuth in A1, besides clustering of neurons with similar spatial tuning. However, how azimuth is represented within individual binaural clusters remains unclear in any species.
These issues were addressed in A1 of the pallid bat. The pallid bat listens to prey-generated noise (e.g., rustling or walking; energy between 5 and 30 kHz) to localize terrestrial prey such as crickets and scorpions (Bell, 1982). Echolocation is used for obstacle avoidance. Behavioral tests show that the pallid bat localizes prey-generated noise with an accuracy of ∼3° (Barber et al., 2003). In its A1, determined based on tonotopy and thalamic inputs (Razak and Fuzessery, 2002; Razak et al., 2007), the area tuned between 5 and 30 kHz is dominated by two binaural clusters distinguished by interaural intensity difference (IID) sensitivity (Razak and Fuzessery, 2002, 2010). One cluster contains binaurally inhibited (EI) neurons. These neurons respond to IIDs favoring the contralateral ear with declining responses as ipsilateral intensity is increased. The second cluster contains neurons with peaked (P) IID function. These neurons respond best to IIDs near 0 dB and show weak responses to IIDs favoring either ear (Kitzes et al., 1980; Semple and Kitzes, 1993).
The goal of this study was to determine how azimuth is represented within each of these two binaural clusters. To achieve this, a sequential dichotic/free-field stimulus paradigm was used to determine frequency tuning, and IID and azimuth sensitivity from the same neurons, and to map these responses across the EI and P clusters of A1. The results presented here show that systematic azimuth representations are present locally within individual binaural clusters of A1.
Materials and Methods
Pallid bats were netted in Arizona and California and held in a 11 × 14 foot room at the University of California, Riverside. The bats were able to fly in this room and were provided crickets/mealworms and water ad libitum. The room was maintained on a reversed 12 h light:12 h dark cycle. All procedures followed the animal welfare guidelines required by the National Institutes of Health and the Institutional Animal Care and Use Committee.
Surgical procedures.
Recordings were obtained from bats anesthetized with isoflurane inhalation, followed by an intraperitoneal injection of pentobarbital sodium (30 μg/g body weight) and acepromazine (2 μg/g body weight). Both male and female bats were used. To exposed the auditory cortex, the head was held in a bite bar, a midline incision was made in the scalp, and the muscles over the dorsal surface of the skull were reflected to the sides. The front of the skull was scraped clean and a layer of glass microbeads applied, followed by a layer of dental cement. The bat was then placed in a Plexiglas holder. A cylindrical aluminum head pin was inserted through a cross bar over the bat's head and cemented to the previously prepared region of the skull. This pin served to hold the bat's head secure during the recording session. The location of A1 was determined relative to the rostrocaudal extent of the midsagittal sinus, the distance laterally from the midsagittal sinus, and the location of a prominent lateral blood vessel that travels parallel to the midsagittal sinus. The size of the exposure was usually ∼2 mm2. Exposed muscle was covered with petroleum jelly (Vaseline), and exposed brain surface was covered with paraffin oil to prevent desiccation.
Recording procedures.
Experiments were conducted in a warm (80°F), sound-proofed chamber lined with anechoic foam (Gretch-Ken Industries). All recordings were obtained from the right hemisphere. Bats were kept anesthetized throughout the course of the experiments with additional pentobarbital sodium (one-third of the presurgical dose) injections. Acoustic stimulation and data acquisition were driven by custom-written software (Batlab, written by Dr. Don Gans, Kent State University, Kent, OH) and a Microstar digital signal processing board. Programmable attenuators (PA5, Tucker-Davis Technologies) allowed control of sound intensities before amplification by a stereo power amplifier (HCA1100, Parasound). Dichotic stimulation was achieved using two LCY-K100 ribbon tweeters (Madisound) fitted with funnels that were inserted into the pinnae. The amplifier–speaker–funnel frequency response curve measured with a 0.25 inch microphone (Bruel and Kjaer) was flat within ±3 dB for frequencies from 8 to 35 kHz, the range of characteristic frequencies encountered in this study. The two speakers used for dichotic studies did not differ significantly in their frequency response. Free-field stimulation was achieved with a third LCY-K100 speaker that was moved manually to different locations on a semicircular loop (40 cm radius with the bat's head as center). In the figures to follow, positive azimuth values denote contralateral space and negative azimuth values denote ipsilateral space. The loop was mounted on a vibration isolation table (TMC). The bat was placed on the edge of the table such that its head was at the center of the loop and in the same horizontal plane allowing azimuth receptive fields to be studied at an elevation of 0°. The cross-bar holding the head pin was secured behind the bat, leaving no interference between the free-field speaker and the bat's head.
Extracellular single-unit recordings were obtained using glass electrodes (1 m NaCl, 2–10 MΩ impedance) at depths between 200 and 600 μm. Penetrations were made orthogonal to the surface of the cortex. Action potentials were amplified by a Dagan extracellular preamplifier (model 2400A) and a spike signal enhancer (FHC), and were bandpass filtered (0.3–3 kHz; Krohn-Hite). Waveforms and peristimulus time histograms were stored using the Microstar DSP board and Batlab software.
Dichotic stimulation.
The goal of this study was to determine how azimuth locations were represented within the P and EI clusters. To achieve this, a sequential dichotic/free-field stimulation paradigm was used (Wenstrup et al., 1988; Fuzessery et al., 1990). At each recording location, dichotic stimuli were used to measure IID sensitivity and frequency tuning. Then the speaker funnels were removed from the ears and stimulation was switched to a free-field speaker on a semicircular loop to determine azimuth receptive fields (ARFs) from the same neuron. This sequence was followed for multiple sites in a cortex to generate maps of frequency tuning, IID sensitivity, and ARF.
Pure tones (5–40 kHz, 5–10 ms duration, 1 ms rise/fall times, 1 Hz repetition rate) were used to determine characteristic frequency (CF) and frequency tuning. CF was defined as the tone frequency that elicited action potentials to at least five successive stimulus repetitions at the lowest intensity. This intensity was noted as the minimum threshold (MT) of the neuron. The intensity was then increased in 5 or 10 dB steps to record tuning characteristics. For neurons that did not respond to monaural tones, CF was determined by presenting binaural tones. The IID at which peak response occurred with noise was used to determine CF with binaural tones.
The binaural response type was determined with broadband noise (bandwidth 5–40 kHz, 5–10 ms duration, 1 ms rise/fall times) as the stimulus. The threshold of the neuron to noise was determined by stepping up intensity in 5 dB steps. Noise was presented in the contralateral ear at an intensity between 10 and 15 dB above noise threshold, while the intensity at the ipsilateral ear was varied from 20 dB below to 20 dB above contralateral intensity, in 5 dB steps. This covers the behaviorally relevant range of IIDs for the pallid bat (Fuzessery, 1996). The speaker funnels were not sealed in the meatuses to facilitate sequential dichotic/free-field stimulation from the same neurons. The attenuation of speaker intensity at the opposite ear was at least 25 dB and permitted the presentation of ±20 dB IIDs. Negative IIDs denote more intense ipsilateral ear sound than at the contralateral ear. Positive IIDs favor the contralateral ear. Neurons were considered to be EI if the response declined at least 50% of the maximal response with increasingly negative IID. A neuron was considered to be peaked if the response to binaural stimulation was at least twice the response to monaural contralateral stimulation and the response subsequently decreased to at least 25% of maximum with increasing ipsilateral intensity. IID sensitivity is stable across intensities in the pallid bat A1 (Razak and Fuzessery, 2002, 2010). Therefore, IID curves were determined at multiple contralateral intensities only in a few neurons.
In the cat A1, neurons with peaked binaural responses have been described in A1 (Kitzes et al., 1980) and dorsal zone (Middlebrooks and Zook, 1983), but the predominant clusters are made up of EI and neurons excited by monaural stimuli of either ear (EE) type cells. In the pallid bat A1, EE, EI, and P cells are found (Razak and Fuzessery, 2002), but the EI and P neuron clusters dominate the cortical area tuned between 5 and 35 kHz. Therefore, this study focused on these two clusters. According to the classification in the literature (Kitzes et al., 1980; Phillips and Irvine, 1981; Wenstrup et al., 1988; Fuzessery et al., 1990), the peaked neuron cluster includes both OO/FI (neurons that do not respond to monaural stimulation of either ear, but are facilitated by binaural input and inhibited when ipsilateral intensity is increased further) and EO/FI neurons (those having a weak response to contralateral monaural stimulus, no response to monaural ipsilateral stimulus, facilitated by binaural stimulus, and inhibited by further increases in ipsilateral stimulus). The OO/FI neurons have also been called predominantly binaural (Kitzes et al., 1980). This dataset does not include any EE/F type cells (neurons that respond weakly to monaural stimuli of either ear and are facilitated by binaural stimuli). The EI cluster is homogeneous according to binaural type and includes only cells that respond to contralateral monaural stimuli and are inhibited by binaural stimuli with increasing ipsilateral intensities.
The pallid bat A1 consists of a tonotopic map with CFs between 6 and 70 kHz. Neurons tuned between 30 and 70 kHz are selective for the downward frequency-modulated sweeps used in echolocation (Razak and Fuzessery, 2002). Neurons tuned to <30 kHz, the focus of this study, are likely involved in prey localization. Thus, it is important to note that the maps shown in the Results section only cover approximately half of the pallid bat's A1. Even for neurons tuned between 5 and 30 kHz, the focus here was on the EI and P neuron clusters to determine how azimuth sensitivity changes within individual clusters. Thus, these data do not fully capture the diversity of binaural properties in the pallid bat A1.
Free-field stimulation.
After frequency tuning and IID sensitivity were determined with dichotic stimulation, the speaker funnels were removed from the ears and stimulation was switched to the free-field speaker to determine ARF. The speaker was positioned between −75° and +75° and moved at 15° increments to determine ARF. Locations behind the animal were not studied. Broadband noise was used as the stimulus. Because the speaker is further away from the bat in the free-field condition, the threshold intensity can be higher compared with the dichotic condition. The intensity of stimulation was matched between dichotic and free-field studies to be at the same value above threshold (Wenstrup et al., 1988). Azimuth receptive fields were determined at intensities between 10 and 15 dB above noise threshold in all neurons. In the majority of neurons, ARF was determined with at least one more intensity 20–40 dB above threshold to study intensity stability of spatial tuning.
Voronoi procedure.
When discussing cortical maps, it is useful to visualize how the parameter of interest varies across the cortical surface. Voronoi tessellation diagrams are a convenient method of doing this. Given a list of points, a 2-D Voronoi tessellation divides a plane into tiles, each of which contains a single point. In this case, the plane represents the cortex and the points are the locations of electrode penetrations. Each Voronoi tile is defined as the locus that satisfies the condition that the associated point is closer than any of the other points in the list; neuronal properties measured at the electrode penetration site are taken as representative of the entire tile.
Computing a Voronoi tessellation from a list of penetration points alone results in the outermost tiles being unbounded since the closest point condition holds to infinity. To overcome this, additional points were added around the perimeter of the tessellation. First, the convex hull of the existing points was computed, and the median area (Ã) of all bounded tiles was calculated. The characteristic radius (rA) associated with this mean area was calculated (rA = √ Ã/π), and a new perimeter was defined, offset a distance of 2rA from the convex hull. Points were then added on the outer perimeter at each vertex, and at intervals of 2rA along the edges.
All data shown are from single-unit recordings identified based on the consistency of action potential amplitude and waveform displayed on an oscilloscope. Responses were quantified as the total number of spikes elicited over 20 stimulus presentations.
Results
The main goal of this study was to determine how azimuth sensitivity is organized within individual binaural clusters. Basic properties of spatial tuning will be described first before a description of how they are organized within the peaked and EI binaural clusters.
Properties of azimuth receptive fields of P and EI neurons
ARFs were recorded from 146 EI neurons. In 96 of these neurons, IID selectivity function was also determined. In the remaining neurons, binaural interaction type was determined with a few binaural combinations, but the selectivity function was not fully determined. ARFs were also recorded in 72 P neurons. In 57 of these neurons, IID selectivity function was determined. These data were obtained from 21 bats.
The majority (113 of 146, 77%) of EI neurons exhibited sigmoid-shaped ARF with response preference in the contralateral hemisphere. The remaining neurons were either omnidirectional (8%) or had peaked ARF (15%). Figure 1A–D shows IID sensitivity and ARF of two EI neurons. The IID at which response declined to 50% of maximum (50% IID) was determined as a measure of the medial boundary of IID sensitivity in EI neurons (Fig. 1A,C, vertical arrows). The azimuth location at which response declined to 50% of maximum (50% azimuth) was a measure of the medial boundary of ARF (Fig. 1B,D, vertical arrows). For example, the neuron in Figure 1B had a 50% azimuth near midline. The neuron in Figure 1D exhibited a 50% azimuth in the contralateral hemifield.
Figure 1.
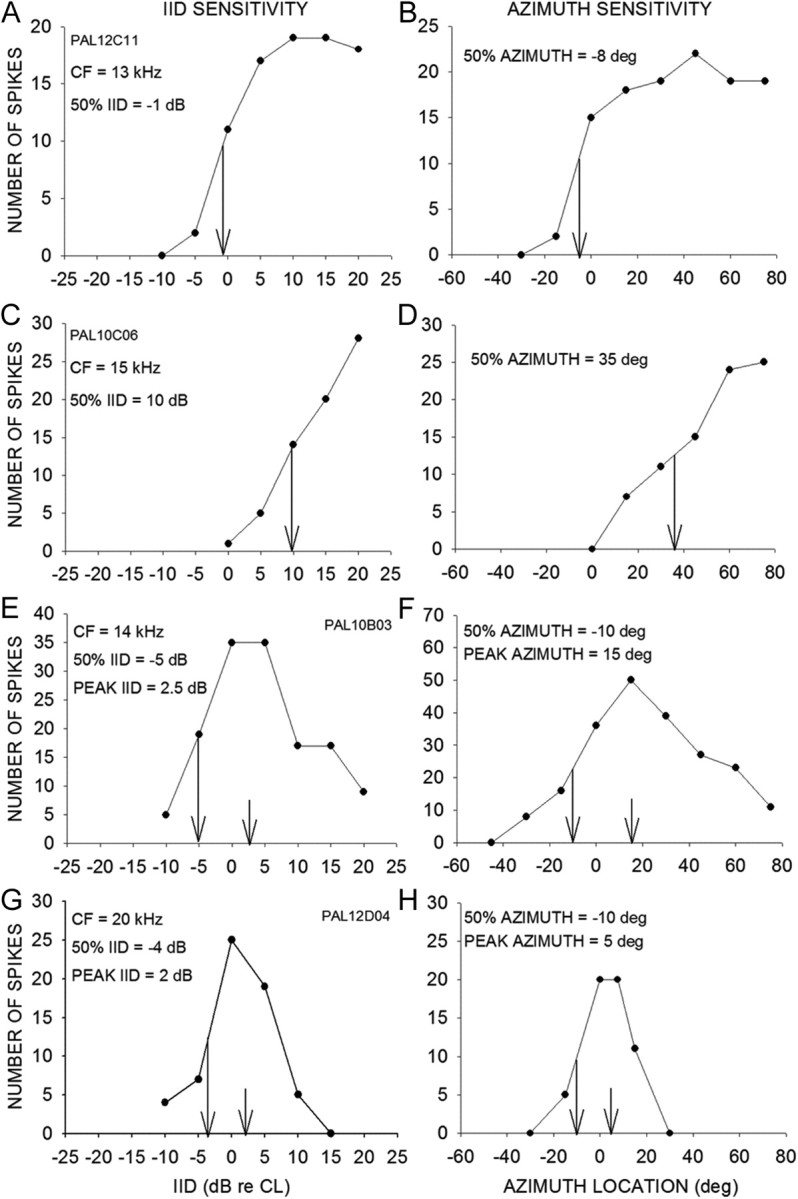
Example IID sensitivity and ARFs recorded in the pallid bat A1. Broadband noise was used as stimulus for both IID and ARF determination. A, C, IID sensitivity of neurons recorded in the EI cluster. B, D, ARFs of the same neurons as in A and C. These neurons exhibited sigmoid IID sensitivity and ARF. Negative (positive) IIDs denote a more intense sound in the ipsilateral (contralateral) ear. Negative (positive) azimuth locations indicate ipsilateral (contralateral) hemifield. The arrows in the IID plots denote the IID at which response decreases to 50% of maximum response (50% IID). The arrows in the ARF plots mark the 50% azimuth. E, G, IID functions of two neurons in the peaked neuron cluster. F, H, ARFs of the same neurons shown in E and G. These neurons exhibited peaked IID sensitivity and ARF. The long arrows denote 50% IID and 50% azimuth. In peaked neurons, response declines to 50% of maximum on both sides of the peak, but only the value toward the ipsilateral side is shown. The short arrows denote the peak IID and ARF.
Across the population of EI neurons, 50% azimuth was between −60° to 64°. The 50% azimuth was either near the midline or in the contralateral hemifield in the majority of neurons (Fig. 2A). Nearly 20% of EI neurons had 50% azimuths in the ipsilateral hemifield or were omnidirectional, indicating a broad ARF that includes the entire contralateral hemifield and some or all of the ipsilateral hemifield (Fig. 2A). IID sensitivity predicts spatial tuning in the EI cluster (Fig. 2B), suggesting that IID sensitivity mostly explains spatial tuning in these neurons. Inclusion of other factors such as CF/ear directionality and interaural time difference sensitivity is likely to enhance this prediction.
Figure 2.

Properties of azimuth receptive fields in the pallid bat A1. A, Distribution of 50% azimuths in EI neurons. B, Relationship between 50% IID and 50% azimuth in EI neurons. C, Distribution of peak azimuths in peaked neurons. D, Relationship between peak IID and peak azimuth of peaked neurons.
All peaked neurons (72 of 72) exhibited peaked ARFs. Figure 1E–H shows IID sensitivity and ARF of two peaked neurons. The geometric center of the range of IIDs producing >80% maximum response was noted as the peak IID (Fig. 1E,G, short vertical arrows). Likewise, the geometric center of the range of azimuths eliciting >80% of maximum response was the peak azimuth (Fig. 1F,H). Across the population, peak azimuth was between −15° and 35° with 83% (60 of 72) of neurons showing a peak between −15° and 15° (Fig. 2C). This indicates that the peaked cluster is a separate representation of azimuths near the midline in the pallid bat A1. There was a correlation between peak IID and peak azimuth (Fig. 2D), suggesting that IID sensitivity shapes ARFs of peaked neurons.
Azimuth receptive fields are stable across sound intensity
The ARFs of both EI and P neurons are relatively resistant to changes in sound intensity over a range of 20–40 dB above threshold. Figure 3A shows an EI neuron whose ARF was determined at three different intensities spanning 30 dB. The 50% azimuths at different intensities were within 7° of each other. Figure 3B shows a peaked neuron with similar intensity invariance. A stability index was determined as the ratio of changes in an ARF property relative to changes in intensity (method used by Irvine and Gago, 1990). The following formula was used: SI = (ARF propertyhighest intensity − ARF propertylowest intensity)/intensity range. The ARF properties tested were 50% azimuth and 50% bandwidth.
Figure 3.

Stability of ARF properties across intensity. A, The ARF of this EI neuron was determined at three different intensities spanning a range of 30 dB. MT of this neuron was 29 dB SPL. SI, Stability index. The 50% AZIMUTH SI measures how much the 50% azimuth varies for the intensity range tested. In this neuron, the 50% azimuth changed by 7° for sounds that differed 30 dB in intensity, giving rise to an SI of 0.23°/dB. B, The ARF of this peaked neuron was tested at three different intensities spanning 20 dB. The MT of this neuron was 33 dB SPL. The 50% BANDWIDTH SI measures the expansion of the ARF as sound intensities change. In this example, the 50% bandwidth changed by 2° over 20 dB change in intensity, giving rise to an SI of 0.1 deg/dB. C, Distribution of 50% azimuth stability index in EI and P neurons. D, Distribution of 50% bandwidth stability index in peaked neurons.
For example, the ARFs of the EI neuron shown is Figure 3A were determined at three different intensities spanning a range of 30 dB. The 50% azimuth at the highest intensity tested was 0°. The 50% azimuth at the lowest intensity tested was −7°. The 50% azimuth stability index was therefore, 0.23 (7°/30 dB). For peaked neurons, in addition to the 50% azimuth stability, the 50% bandwidth stability was also determined. The 50% bandwidth was defined as the range of azimuths eliciting >50% of maximum response. For the peaked neuron in Figure 3B, the 50% bandwidth stability index was 0.1 (2°/20 dB).
Across the population, most EI and P neurons show <0.5° change in 50% azimuth for every dB change in intensity (Fig. 3C). Thus, for a 40 dB change in sound intensity (which is likely more than the intensity range generated by walking prey, like crickets), most neurons will show <20° change in the 50% azimuth. Most peaked neurons show <1° change in 50% bandwidth for every dB change in intensity (Fig. 3D).Together, these data show that the azimuth tuning properties of EI and P neurons are relatively stable over a moderate range of intensities. IID sensitivity of EI and P neurons are also relatively stable over a similar intensity range (Razak and Fuzessery, 2002, 2010).
Azimuth locations are represented by systematic changes in the area of active cortex
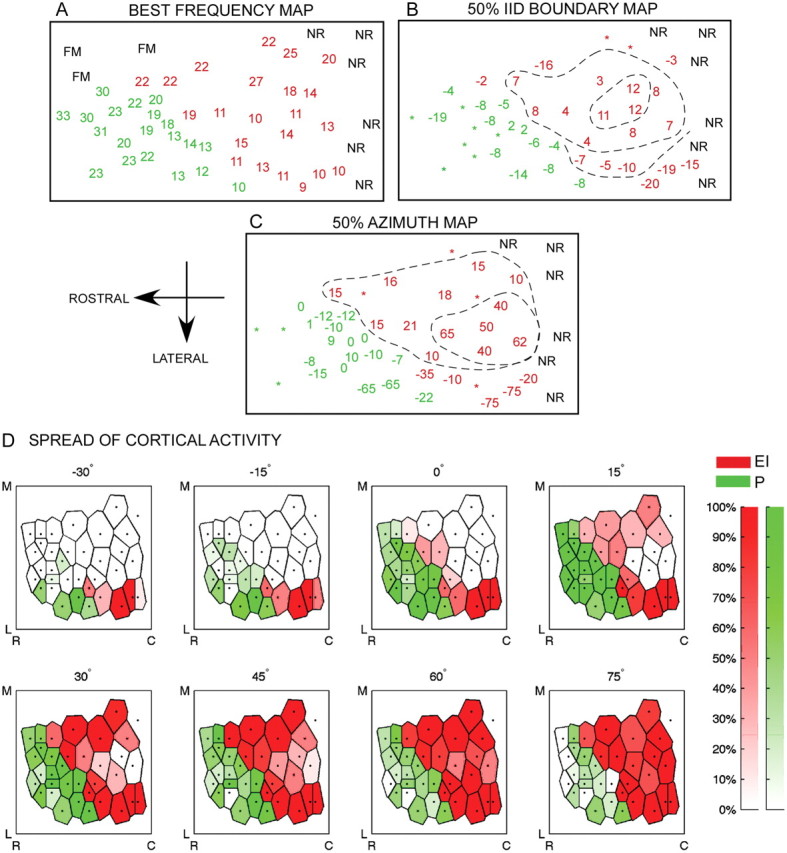
Maps of CF, IID sensitivity, and ARF were obtained from six bats. The EI cluster was mapped in all six bats. The peaked neuron cluster was mapped in four bats. Figure 4A–C shows these maps in one bat. There is a general increase in CF in a caudorostral direction (Fig. 4A). IID sensitivity is clustered according to type, with the EI and P neurons dominating this range of CF (Fig. 4A, red: EI neurons; green: peaked neurons). Figure 4B shows a map of the IID at which response decreased to 50% of maximum (50% IID; the dashed contour lines, shown to aid visualization, were not generated quantitatively). The peaked neurons have two such boundaries, but only the boundary toward the ipsilateral favoring IIDs is shown in Figure 4B. The 50% IID cutoff is arranged systematically in the EI cluster. This confirms previous data from the pallid bat (Razak and Fuzessery, 2002), and is similar to representations seen in the mustached bat inferior colliculus (IC) (Wenstrup et al., 1986) and the cat superior colliculus (SC) (Wise and Irvine, 1985). Figure 4C shows the map of 50% azimuth. Within the EI cluster, there is a systematic map of the 50% azimuth with a cluster of high positive values (50% azimuth in extreme contralateral locations) and values becoming progressively more negative in the rostrolateral direction. Example normalized ARFs from the map are shown for EI and P neurons, with their positions marked on the map with solid (EI neuron) and open (P neuron) boxes.
Figure 4.

Systematic representation of IID sensitivity and azimuth tuning in the pallid bat A1 (bat PAL09). A, Tonotopy and binaural representation. The numbers indicate CF recorded at each site. The colors indicate binaural type based on IID sensitivity, with red showing EI neurons and green showing peaked neurons. There is a general caudorostral increase in CF and a clustering of binaural type. FM, Neurons selective for frequency-modulated sweeps used in echolocation. This marks the medial boundary of the A1 region putatively involved in passive prey localization. These were not included for further analysis. NR, No response. B, Map of IID sensitivity. Each number shows the IID at which the response declined to 50% of maximum (50% IID). Positive IID cutoff indicates that the neuron was inhibited to 50% of maximum response even when the contralateral ear intensity was more than the ipsilateral ear intensity. Negative IID cutoff indicates that the ipsilateral ear intensity had to be more than the contralateral ear intensity for the neuron to be inhibited to 50% of maximum response. In the EI cluster (red), IID sensitivity is mapped systematically with a cluster of positive IID cutoffs located caudomedially. IID cutoff values become progressively more negative rostrolaterally. The dashed contour lines are to aid visualization and were not quantitatively generated. *, Corresponding response property was not determined at these sites. C, Map of azimuth sensitivity obtained from the same neurons shown in A and B. Each number indicates the azimuth at which response decreased to 50% of maximum (50% azimuth). For peaked neurons, only the 50% azimuth toward the ipsilateral side is shown. The graphs to the right of C show example ARFs from the EI cluster with the arrows marking 50% azimuth. The locations of these neurons in the EI cluster are marked by the gray boxes in C. The graphs to the left show example peaked neuron ARFs with their location shown by open boxes in C. D, Each panel shows the distribution of activity for a given azimuth location (indicated above each panel). The dots correspond to recording sites. The color saturation scales with activity level. See text for details. Scale bars, 1 mm. R, Rostral; C, caudal; M, medial; L, lateral.
Figure 4D shows the distribution of activity across the EI and P neuron clusters in response to free-field stimulation. Each panel in Figure 4D corresponds to a single azimuth location (indicated above the panel). These maps were constructed based on the ARFs obtained from the same neurons seen in Figure 4A–C. Each ARF was first normalized by the maximum response. The normalized response of each neuron at a given azimuth was marked on the map. Voronoi tessellation (MATLAB) was used to generate the distribution of activity.
In the EI cluster, activity is mostly limited to lateral cortical sites when the sound is at −30° azimuth. As the sound is moved to more contralateral locations, the area of activity systematically increases to include more caudal and medial neurons. The entire EI cluster is active for the most contralateral sound locations tested. In the peaked neuron cluster, lateral sites are active, albeit weakly, at −30° azimuth. As the sound is moved to −15°, 0° and +15° azimuth, activity increased to include more medial sites. Activity decreased for locations more contralateral than 15°. Maximum peaked neuron cluster activation was observed for sounds located between −15° and +15°.
Figure 5 shows cortical maps from another pallid bat. CF, IID sensitivity, and 50% azimuth maps were systematically mapped (Fig. 5A–C). The area of cortical activity increases systematically from lateral EI sites to include more medial and caudal sites as the sound is moved from −30° to 75° (Fig. 5D). In the peaked neuron clusters as well, activity starts at lateral sites for ipsilateral sound locations and expands to include more medial sites as the sound moves toward the midline and 15°, and then declines as the sound moves to more contralateral locations. Two additional maps of cortical activity distribution are shown in Figure 6A,B.
Figure 5.
Systematic representation of IID and azimuth sensitivity in the pallid bat (bat PAL10). A, Tonotopy and binaural clustering. B, Map of IID sensitivity. C, Map of 50% azimuth. D, Distribution of normalized activity across neurons shown in A–C. Conventions are as given in Figure 4D.
Figure 6.

A, B, Two additional examples of systematic changes in the distribution of cortical activity with azimuth location. Conventions are as given in Figure 4D.
These data show that in both EI and P neuron clusters there are systematic changes in the area of active cortex with sound azimuth. Quantification of these changes is shown in Figure 7. Activated area was calculated from the Voronoi tessellation plots, with a tile considered active when its cell's mean response was >50% of its peak value. The active area is the sum of the areas of active Voronoi tiles, given as a percentage of the total area of the cluster. The plot shows the average across all animals with SEM (EI cluster: n = 6; P neuron cluster: n = 4). In the EI cluster, the relative area of activity increases almost linearly from ipsilateral to contralateral loci. In the peaked neuron cluster, the relative area of activity is maximal at 0° and 15°, providing a separate representation of midline sound locations (a spatial acoustic fovea).
Figure 7.

Changes in the relative area of active cortex with azimuth location in the EI and P neuron clusters.
It must be noted that the maps shown in Figures 4–6 were obtained by sequentially sampling each cortical location. Each ARF was determined with intensities at least 10 dB above threshold for noise. Because noise thresholds are not the same across A1, the maps shown were constructed based on recordings made with different intensities. For the neurons in Figure 4, the MT varied between SPLs of 23 and 43 dB. Thus, the intensities used to generate the example maps shown were within 20 dB of each other. Likewise, the intensities used in maps shown in Figures 5 and 6 were also within 20 dB of each other. Within this range of intensities, ARFs show small changes (Fig. 3C,D). IID sensitivity is also relatively stable within this range of intensities (Razak and Fuzessery, 2002, 2010).
Although data in Figures 3–6 suggest that the azimuth-dependent distribution of cortical activity will be similar across a moderate range of intensities, a more direct test of this representation is to ask how activity is distributed for a single intensity noise stimulus. Two additional EI clusters were mapped by presenting noise at a single intensity (50 dB SPL). Figure 8A shows a map of how intense the sound was relative to noise threshold. It can be seen that the noise thresholds were distributed across the EI cluster without any apparent trend. Figure 8B shows the 50% azimuth map. Similar to examples shown in Figures 4 and 5, the 50% azimuth was systematically represented. Figure 8, C and D, presents a second example mapped with noise at the same intensity (50 dB SPL). These maps confirm that there is a systematic map of the medial boundary of azimuth locations within the EI cluster in the auditory cortex of the pallid bat. Such a map is not an artifact of mapping azimuth tuning at different absolute intensities.
Figure 8.

Two cortices in which azimuth tuning was mapped within the EI cluster with a single intensity noise stimulus (50 dB SPL). A, C, Maps of intensity of noise relative to noise threshold. The + symbol followed by a number indicate the intensity of stimulus above threshold. NR, No response; FM, neuron sensitive to frequency-modulated sweep, but not noise. Scale bars, 500 μm. B, D. Maps of the 50% azimuth in response to a 50 dB SPL noise stimulus. The dashed lines are used to aid visualization of the systematic nature of the 50% azimuth distribution.
Relationship between CF and azimuth tuning
Near threshold intensities, ear directionality and tonotopy can shape systematic changes in spatial tuning across an auditory area. Thus, the maps shown can be an artifact of tonotopy. However, the fact that intensities used were at least 10–15 dB above threshold and the invariance of azimuth tuning with intensities up to 40 dB above threshold argue against this explanation for the maps found in the pallid bat A1. As an additional test, the relationship between azimuth tuning properties and CF was plotted for both EI and P neurons (Fig. 9). The majority of EI neurons had CF between 10 and 22 kHz. Most P neurons had CF between 10 and 25 kHz. Neither 50% azimuth (Fig. 9A) nor peak azimuth (Fig. 9B) was correlated with CF. The azimuth tuning bandwidth (Fig. 9C) was correlated with CF such that neurons with higher CF were more narrowly tuned for azimuth. The IID tuning bandwidth of these neurons is not correlated with CF (Razak and Fuzessery, 2010). The lack of correlation between CF and IID bandwidth of peaked neurons was confirmed with the dataset from the present study as well (n = 57 neurons, R2 = 0.002, p = 0.75; graph not shown). Thus, the observed CF versus azimuth tuning bandwidth correlation is most likely due to the expected relationship between frequency and ear directionality (sharper directionality with increasing frequencies). Thus, the systematic maps shown here are not artifacts of tonotopy.
Figure 9.
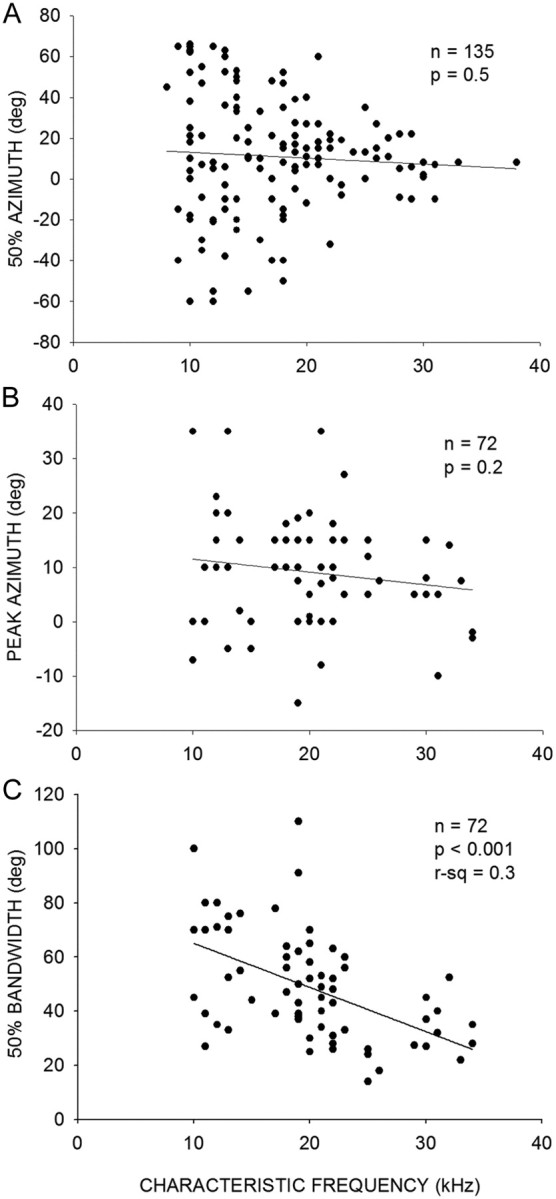
A, Relationship between CF and 50% azimuth in EI neurons. B, Relationship between CF and peak azimuth in P neurons. C, Relationship between CF and 50% bandwidth in P neurons.
Discussion
These data are consistent with the idea that population codes represent azimuth in A1, and provide two novel insights into such codes. First, azimuth is represented by predictable and systematic changes in extent of activated cortex. Second, the underlying substrate for such systematic changes is present locally within individual binaural clusters. Within the EI cluster, the substrate is a map of medial boundaries of IID sensitivity and, consequently, ARF. Thus, the EI cluster representation is consistent with spatial hearing models based on ARF slopes proposed for subcortical nuclei in mammals (McAlpine et al., 2001, Brand et al., 2002).
In the peaked neuron cluster, maximum activity occurs for sounds near the midline and falls off systematically for lateral locations. The substrate for this representation is peak IID sensitivity near 0 dB. The IID responses of peaked neurons change to EI type sensitivity when GABAA receptor antagonists are applied (Razak and Fuzessery, 2010). This suggests that at least part of this midline acoustic fovea is an emergent cortical property. The peaked neuron cluster may be a substrate of the separate midline channel proposed by Dingle et al. (2010) and underlie improved localization abilities of animals near midline azimuths.
Consistent with other species, there is no space map of peak activity in A1 of the pallid bat. In the SC, azimuth is represented by systematically changing foci of active neurons (a “point-to-point” map). This type of space map is not present in A1 (Middlebrooks and Pettigrew, 1981; Palmer and King, 1982; Middlebrooks and Knudsen, 1984; King and Hutchings, 1987; Imig et al., 1990; Rajan et al., 1990; Clarey et al., 1994). The advantage of a map that depends on the area of activity is that for any given sound location, a significant proportion of the cortex is active. This may facilitate processing of other attributes of the sound. In the SC, only a small focus of neurons will be active for any given sound location. This may be sufficient for reflexive orientation to sound locations.
Methodological considerations
The IID sensitivity of neurons was determined by fixing the contralateral intensity and changing the ipsilateral intensity. It has been argued that this is not how IIDs change in nature (Phillips and Irvine, 1981). Nevertheless, the IID properties determined here with this method predict azimuth properties with reasonable accuracy (Fig. 2). The accuracy will improve if frequency tuning of neurons and ear directionality are also taken into account (Wenstrup et al., 1988). It remains to be determined whether the constant average binaural intensity method provides additional improvement in prediction accuracy. The sequential dichotic/free-field stimulation method can be used to address this issue.
Data were obtained from pentobarbital-anesthetized bats. An individual neuron's response properties may be altered by anesthetic state, but the effect is expected to be similar across neurons. Therefore, the systematic azimuth maps are unlikely to be an artifact of the anesthetic. Another factor likely affected by anesthetic is the stability of spatial tuning with intensity. However, previous studies have shown that spatial tuning is in fact more stable with intensity in awake animals (Mickey and Middlebrooks, 2003), suggesting that the stability shown here is an underestimate.
The maps shown are based on normalized data. Given that neurons will differ in their firing rates across any type of map, the absolute firing rates may not be of significance. The azimuth locations around which each neuron provides maximum information (partly dependent on the azimuth of the steepest ARF slope) will be of significance (Harper and McAlpine, 2004; Jazayeri and Movshon, 2006; Tollin et al., 2008). This depends on the shape of the ARF, and not on the absolute firing rates. Therefore, maps based on normalized data and not absolute firing rates are shown. The maps were constructed based on recordings made at depths between 200 and 600 μm. This approximately covers cortical layers 2–5 in the pallid bat A1. In this depth range, there is not much variation in IID selectivity, frequency tuning (Razak and Fuzessery, 2002), and ARF properties (K. A. Razak, unpublished observations).
How the pallid bat may use the maps to localize prey
Primates and carnivores with unilateral cortical lesions exhibit localization deficits in the contralateral hemifield, but localize accurately in the ipsilateral hemifield (Jenkins and Merzenich, 1984; Kavanagh and Kelly, 1987; Heffner, 1997; Malhotra et al., 2004). Consistent with this notion, the majority of EI neurons in the pallid bat are maximally responsive to contralateral locations. The midline slopes of ARFs fall within different ranges of azimuth locations, with the majority around the midline and contralateral locations (Fig. 2). Different neurons within the EI cluster are thus positioned to generate maximum information for different ranges of azimuth across the contralateral hemifield (Harper and McAlpine, 2004). Because the slopes are distributed systematically, the cortical locations of maximum information will change systematically across the EI cluster as sound azimuth changes (a space map of maximum information).
This information will be enhanced when the activity of the peaked neuron cluster is also considered. For sounds in extreme lateral locations, most of the contralateral EI cluster will be active, but the P neuron cluster will be weakly activated. As the sound moves toward the midline, the activated area of EI neurons will decrease with a concomitant increase in the area of P neuron cluster activation. For the bat to be on target, it must adjust flight so that most of the peaked neurons remain active, suggesting a sensorimotor transformation principle. Thus, prey localization by the pallid bat may depend on the relative activity of the P neuron and EI clusters in each hemisphere. This notion is consistent with the relative firing rate hypothesis across subpopulations of neurons for sound localization (Stecker et al., 2005; Dingle et al., 2010). In addition to relative firing rate comparisons, temporal codes such as latency distributions and synchronous firing may contribute to sound localization (Eggermont and Mossop, 1998; Furukawa et al., 2000).
Is this a general mechanism of azimuth representation in the lemniscal pathway?
A systematic map of IID sensitivity is present in the IC of the mustached bat (Wenstrup et al., 1986). There is an expanded representation of the second harmonic of its echolocation call (60 kHz) in the mustached bat IC with a large cluster of EI cells. IID medial boundaries are represented systematically here, and an activity map similar to that reported here was suggested, but remains to be tested. The presence of IID maps in the lemniscal pathway of the mustached and pallid bats raises the question of whether this map is a specialization in bats, or whether these maps are present in non-chiropteran lemniscal pathway as well.
The answer is currently unclear. The notion that no systematic representation of azimuth is present in A1 is based on mapping within isofrequency contours that encompass multiple binaural clusters. The organization within each binaural cluster across multiple frequency contours has not been systematically studied in other species. In A1 of cats, for example, ARFs were mapped within individual isofrequency contours extending between 2 and 4 mm mediolaterally across A1 (Middlebrooks and Pettigrew, 1981; Rajan et al., 1990). Each binaural cluster extends between 0.5 and 1 mm mediolaterally in the cat A1 (Middlebrooks and Zook, 1983). This form of mapping limits sampling within each binaural cluster in both mediolateral and rostrocaudal directions, and would be insufficient to characterize maps within each cluster. A similar argument can be extended for studies on binaural cue representation in which most report the type of binaural interactions and clustering, but not how binaural sensitivity varies within a cluster (Reale and Kettner, 1986; Recanzone et al., 1999; Rutkowski et al., 2000). The studies that did focus on binaural sensitivity organization used isofrequency contours as reference (Kelly and Judge, 1994; Nakamoto et al., 2004). Systematic studies of the intrinsic organization of binaural clusters in other species are needed to test the generality of the representation seen in the pallid bat A1.
Conclusions
Binaural clusters are present in A1 of every species tested. It is also clear that auditory space is represented by distribution of activity across populations of neurons. The results of the present study bring these two observations together by suggesting that binaural clusters are substrates for separate and systematic distributions of activity for different, but overlapping, extents of space. The activity patterns seen in this study are snapshots of A1 with respect to azimuth locations. These patterns will change in a complex manner in the course of natural behavior with pinna movements and sound elevation (Sun and Jen, 1987), multiple or moving sound sources (Burger and Pollak, 2001; Hoffmann et al., 2010), and attention (Lee and Middlebrooks, 2011). How activity patterns across the EI and P neuron clusters are modulated by pinna position, sound elevation, and additional sound sources will be investigated in the future.
Footnotes
The study was funded by National Institute on Deafness and Other Communication Disorders Grant R03 DC009882-01A. I thank Dr. Zoltan Fuzessery, Dr. Daniel Tollin, and Dr. Len Kitzes for useful discussions of the data and comments on an earlier version of this manuscript. I also thank Stuart Yarrow, Dr. Peg Series, and Dr. Aaron Seitz for help with the tessellation analysis.
The author declares no competing financial interests.
References
- Barber JR, Razak KA, Fuzessery ZM. Can two streams of auditory information be processed simultaneously? Evidence from the gleaning bat Antrozous pallidus. J Comp Physiol A Neuroethol Sens Neural Behav Physiol. 2003;189:843–855. doi: 10.1007/s00359-003-0463-6. [DOI] [PubMed] [Google Scholar]
- Bell GP. Behavioral and ecological aspects of gleaning by the desert insectivorous bat, Antrozous pallidus (Chiroptera: Vespertilionidae) Behav Ecol Sociobiol. 1982;10:217–223. [Google Scholar]
- Brand A, Behrend O, Marquardt T, McAlpine D, Grothe B. Precise inhibition is essential for microsecond interaural time difference coding. Nature. 2002;417:543–547. doi: 10.1038/417543a. [DOI] [PubMed] [Google Scholar]
- Burger RM, Pollak GD. Reversible inactivation of the dorsal nucleus of the lateral lemniscus reveals its role in the processing of multiple sound sources in the inferior colliculus of bats. J Neurosci. 2001;21:4830–4843. doi: 10.1523/JNEUROSCI.21-13-04830.2001. [DOI] [PMC free article] [PubMed] [Google Scholar]
- Casseday JH, Diamond IT. Symmetrical lateralization of function in the auditory system of the cat: effects of unilateral ablation of cortex. Ann NY Acad Sci. 1977;299:255–263. doi: 10.1111/j.1749-6632.1977.tb41912.x. [DOI] [PubMed] [Google Scholar]
- Clarey JC, Barone P, Imig TJ. Functional organization of sound direction and sound pressure level in primary auditory cortex of the cat. J Neurophysiol. 1994;72:2383–2405. doi: 10.1152/jn.1994.72.5.2383. [DOI] [PubMed] [Google Scholar]
- Dingle RN, Hall SE, Phillips DP. A midline azimuthal channel in human spatial hearing. Hear Res. 2010;268:67–74. doi: 10.1016/j.heares.2010.04.017. [DOI] [PubMed] [Google Scholar]
- Eggermont JJ, Mossop JE. Azimuth coding in primary auditory cortex of the cat. I. Spike synchrony versus spike count representations. J Neurophysiol. 1998;80:2133–2150. doi: 10.1152/jn.1998.80.4.2133. [DOI] [PubMed] [Google Scholar]
- Furukawa S, Xu L, Middlebrooks JC. Coding of sound-source location by ensembles of cortical neurons. J Neurosci. 2000;20:1216–1228. doi: 10.1523/JNEUROSCI.20-03-01216.2000. [DOI] [PMC free article] [PubMed] [Google Scholar]
- Fuzessery ZM. Monaural and binaural spectral cues created by the external ears of the pallid bat. Hear Res. 1996;95:1–17. doi: 10.1016/0378-5955(95)00223-5. [DOI] [PubMed] [Google Scholar]
- Fuzessery ZM, Wenstrup JJ, Pollak GD. Determinants of horizontal sound location selectivity of binaurally excited neurons in an isofrequency region of the mustache bat inferior colliculus. J Neurophysiol. 1990;63:1128–1147. doi: 10.1152/jn.1990.63.5.1128. [DOI] [PubMed] [Google Scholar]
- Harper NS, McAlpine D. Optimal neural population coding of an auditory spatial cue. Nature. 2004;430:682–686. doi: 10.1038/nature02768. [DOI] [PubMed] [Google Scholar]
- Heffner HE. The role of macaque auditory cortex in sound localization. Acta Otolaryngol. 1997;117:22–27. doi: 10.3109/00016489709126140. [DOI] [PubMed] [Google Scholar]
- Hoffmann S, Schuller G, Firzlaff U. Dynamic stimulation evokes spatially focused receptive fields in bat auditory cortex. Eur J Neurosci. 2010;31:371–385. doi: 10.1111/j.1460-9568.2009.07051.x. [DOI] [PubMed] [Google Scholar]
- Imig TJ, Adrián HO. Binaural columns in the primary field (A1) of cat auditory cortex. Brain Res. 1977;138:241–257. doi: 10.1016/0006-8993(77)90743-0. [DOI] [PubMed] [Google Scholar]
- Imig TJ, Irons WA, Samson FR. Single-unit selectivity to azimuthal direction and sound pressure level of noise bursts in cat high-frequency primary auditory cortex. J Neurophysiol. 1990;63:1448–1466. doi: 10.1152/jn.1990.63.6.1448. [DOI] [PubMed] [Google Scholar]
- Irvine DR, Gago G. Binaural interaction in high-frequency neurons in inferior colliculus of the cat: effects of variations in sound pressure level on sensitivity to interaural intensity differences. J Neurophysiol. 1990;63:570–591. doi: 10.1152/jn.1990.63.3.570. [DOI] [PubMed] [Google Scholar]
- Jazayeri M, Movshon JA. Optimal representation of sensory information by neural populations. Nat Neurosci. 2006;9:690–696. doi: 10.1038/nn1691. [DOI] [PubMed] [Google Scholar]
- Jenkins WM, Masterton RB. Sound localization: effects of unilateral lesions in the central auditory system. J Neurophysiol. 1982;47:987–1016. doi: 10.1152/jn.1982.47.6.987. [DOI] [PubMed] [Google Scholar]
- Jenkins WM, Merzenich MM. Role of cat primary auditory cortex for soundlocalization behavior. J Neurophysiol. 1984;52:819–847. doi: 10.1152/jn.1984.52.5.819. [DOI] [PubMed] [Google Scholar]
- Kavanagh GL, Kelly JB. Contribution of auditory cortex to sound localization by the ferret (Mustela putorius) J Neurophysiol. 1987;57:1746–1766. doi: 10.1152/jn.1987.57.6.1746. [DOI] [PubMed] [Google Scholar]
- Kelly JB, Judge PW. Binaural organization of primary auditory cortex in the ferret (Mustela putorius) J Neurophysiol. 1994;71:904–913. doi: 10.1152/jn.1994.71.3.904. [DOI] [PubMed] [Google Scholar]
- King AJ, Hutchings ME. Spatial response properties of acoustically responsive neurons in the superior colliculus of the ferret: a map of auditory space. J Neurophysiol. 1987;57:596–624. doi: 10.1152/jn.1987.57.2.596. [DOI] [PubMed] [Google Scholar]
- King AJ, Bajo VM, Bizley JK, Campbell RA, Nodal FR, Schulz AL, Schnupp JW. Physiological and behavioral studies of spatial coding in the auditory cortex. Hear Res. 2007;229:106–115. doi: 10.1016/j.heares.2007.01.001. [DOI] [PMC free article] [PubMed] [Google Scholar]
- Kitzes LM, Wrege KS, Cassady JM. Patterns of responses of cortical cells to binaural stimulation. J Comp Neurol. 1980;192:455–472. doi: 10.1002/cne.901920306. [DOI] [PubMed] [Google Scholar]
- Lee CC, Middlebrooks JC. Auditory cortex spatial sensitivity sharpens during task performance. Nat Neurosci. 2011;14:108–114. doi: 10.1038/nn.2713. [DOI] [PMC free article] [PubMed] [Google Scholar]
- Liu W, Suga N. Binaural and commissural organization of the primary auditory cortex of the mustached bat. J Comp Physiol A. 1997;181:599–605. doi: 10.1007/s003590050143. [DOI] [PubMed] [Google Scholar]
- Malhotra S, Hall AJ, Lomber SG. Cortical control of sound localization in the cat: unilateral cooling deactivation of 19 cerebral areas. J Neurophysiol. 2004;92:1625–1643. doi: 10.1152/jn.01205.2003. [DOI] [PubMed] [Google Scholar]
- McAlpine D, Jiang D, Palmer AR. A neural code for low-frequency sound localization in mammals. Nat Neurosci. 2001;4:396–401. doi: 10.1038/86049. [DOI] [PubMed] [Google Scholar]
- Mickey BJ, Middlebrooks JC. Representation of auditory space by cortical neurons in awake cats. J Neurosci. 2003;23:8649–8663. doi: 10.1523/JNEUROSCI.23-25-08649.2003. [DOI] [PMC free article] [PubMed] [Google Scholar]
- Middlebrooks JC, Knudsen EI. A neural code for auditory space in the cat's superior colliculus. J Neurosci. 1984;4:2621–2634. doi: 10.1523/JNEUROSCI.04-10-02621.1984. [DOI] [PMC free article] [PubMed] [Google Scholar]
- Middlebrooks JC, Pettigrew JD. Functional classes of neurons in primary auditory cortex of the cat distinguished by sensitivity to sound location. J Neurosci. 1981;1:107–120. doi: 10.1523/JNEUROSCI.01-01-00107.1981. [DOI] [PMC free article] [PubMed] [Google Scholar]
- Middlebrooks JC, Zook JM. Intrinsic organization of the cat's medial geniculate body identified by projections to binaural response-specific bands in the primary auditory cortex. J Neurosci. 1983;3:203–224. doi: 10.1523/JNEUROSCI.03-01-00203.1983. [DOI] [PMC free article] [PubMed] [Google Scholar]
- Middlebrooks JC, Dykes RW, Merzenich MM. Binaural response-specific bands in primary auditory cortex (AI) of the cat: topographical organization orthogonal to isofrequency contours. Brain Res. 1980;181:31–48. doi: 10.1016/0006-8993(80)91257-3. [DOI] [PubMed] [Google Scholar]
- Middlebrooks JC, Clock AE, Xu L, Green DM. A panoramic code for sound location by cortical neurons. Science. 1994;264:842–844. doi: 10.1126/science.8171339. [DOI] [PubMed] [Google Scholar]
- Miller LM, Recanzone GH. Populations of auditory cortical neurons can accurately encode acoustic space across stimulus intensity. Proc Natl Acad Sci U S A. 2009;106:5931–5935. doi: 10.1073/pnas.0901023106. [DOI] [PMC free article] [PubMed] [Google Scholar]
- Nakamoto KT, Zhang J, Kitzes LM. Response patterns along an isofrequency contour in cat primary auditory cortex (AI) to stimuli varying in average and interaural levels. J Neurophysiol. 2004;91:118–135. doi: 10.1152/jn.00171.2003. [DOI] [PubMed] [Google Scholar]
- Palmer AR, King AJ. The representation of auditory space in the mammalian superior colliculus. Nature. 1982;299:248–249. doi: 10.1038/299248a0. [DOI] [PubMed] [Google Scholar]
- Phillips DP, Irvine DR. Responses of single neurons in physiologically defined area A1 of cat cerebral cortex: sensitivity to interaural intensity differences. Hear Res. 1981;4:299–307. doi: 10.1016/0378-5955(81)90014-9. [DOI] [PubMed] [Google Scholar]
- Rajan R, Aitkin LM, Irvine DR. Azimuthal sensitivity of neurons in primary auditory cortex of cats. II. Organization along frequency-band strips. J Neurophysiol. 1990;64:888–902. doi: 10.1152/jn.1990.64.3.888. [DOI] [PubMed] [Google Scholar]
- Razak KA, Fuzessery ZM. Functional organization of the pallid bat auditory cortex: emphasis on binaural organization. J Neurophysiol. 2002;87:72–86. doi: 10.1152/jn.00226.2001. [DOI] [PubMed] [Google Scholar]
- Razak KA, Fuzessery ZM. GABA shapes a systematic map of binaural sensitivity in the auditory cortex. J Neurophysiol. 2010;104:517–528. doi: 10.1152/jn.00294.2010. [DOI] [PMC free article] [PubMed] [Google Scholar]
- Razak KA, Shen W, Zumsteg T, Fuzessery ZM. Parallel thalamocortical pathways for echolocation and passive sound localization in a gleaning bat, Antrozous pallidus. J Comp Neurol. 2007;500:322–338. doi: 10.1002/cne.21178. [DOI] [PubMed] [Google Scholar]
- Reale RA, Kettner RE. Topography of binaural organization in primary auditory cortex of the cat: effects of changing interaural intensity. J Neurophysiol. 1986;56:663–682. doi: 10.1152/jn.1986.56.3.663. [DOI] [PubMed] [Google Scholar]
- Recanzone GH, Schreiner CE, Sutter ML, Beitel RE, Merzenich MM. Functional organization of spectral receptive fields in the primary auditory cortex of the owl monkey. J Comp Neurol. 1999;415:460–481. doi: 10.1002/(sici)1096-9861(19991227)415:4<460::aid-cne4>3.0.co;2-f. [DOI] [PubMed] [Google Scholar]
- Rutkowski RG, Wallace MN, Shackleton TM, Palmer AR. Organisation of binaural interactions in the primary and dorsocaudal fields of the guinea pig auditory cortex. Hear Res. 2000;145:177–189. doi: 10.1016/s0378-5955(00)00087-3. [DOI] [PubMed] [Google Scholar]
- Semple MN, Kitzes LM. Focal selectivity for binaural sound pressure level in cat primary auditory cortex: two-way intensity network tuning. J Neurophysiol. 1993;69:462–473. doi: 10.1152/jn.1993.69.2.462. [DOI] [PubMed] [Google Scholar]
- Stecker GC, Harrington IA, Middlebrooks JC. Location coding by opponent neural populations in the auditory cortex. PLoS Biol. 2005;3:e78. doi: 10.1371/journal.pbio.0030078. [DOI] [PMC free article] [PubMed] [Google Scholar]
- Sun XD, Jen PH. Pinna position affects the auditory space representation in the inferior colliculus of the FM bat, Eptesicus fuscus. Hear Res. 1987;27:207–219. doi: 10.1016/0378-5955(87)90002-5. [DOI] [PubMed] [Google Scholar]
- Tollin DJ, Koka K, Tsai JJ. Interaural level difference discrimination thresholds for single neurons in the lateral superior olive. J Neurosci. 2008;28:4848–4860. doi: 10.1523/JNEUROSCI.5421-07.2008. [DOI] [PMC free article] [PubMed] [Google Scholar]
- Wenstrup JJ, Ross LS, Pollak GD. Binaural response organization within a frequency-band representation of the inferior colliculus: implications for sound localization. J Neurosci. 1986;6:962–973. doi: 10.1523/JNEUROSCI.06-04-00962.1986. [DOI] [PMC free article] [PubMed] [Google Scholar]
- Wenstrup JJ, Fuzessery ZM, Pollak GD. Binaural neurons in the mustache bat's inferior colliculus. II. Determinants of spatial responses among 60-kHz EI units. J Neurophysiol. 1988;60:1384–1404. doi: 10.1152/jn.1988.60.4.1384. [DOI] [PubMed] [Google Scholar]
- Whitfield IC, Cranford J, Ravizza R, Diamond IT. Effects of unilateral ablation of auditory cortex in cat on complex sound localization. J Neurophysiol. 1972;35:718–731. doi: 10.1152/jn.1972.35.5.718. [DOI] [PubMed] [Google Scholar]
- Wise LZ, Irvine DR. Topographic organization of interaural intensity difference sensitivity in deep layers of cat superior colliculus: implications for auditory spatial representation. J Neurophysiol. 1985;54:185–211. doi: 10.1152/jn.1985.54.2.185. [DOI] [PubMed] [Google Scholar]