

Abstract
Objective
This study determined whether reductions in postprandial plasma FFA flux would lead to reductions in plasma acylcarnitine (AC) concentrations.
Materials/Methods
Plasma AC were measured by LC-MS/MS in the fasting state and over 6h after a high-fat (50% energy) meal was fed to 16 overweight and obese subjects with a wide range of insulin sensitivities. Body composition was measured by DEXA, insulin sensitivity by FSIVGTT, substrate oxidation by indirect calorimetry, blood metabolite and hormone concentrations biochemically, and fatty acid flux by using stable isotope tracers.
Results
Lean body mass (LBM) and fasting fat oxidation correlated positively (r > 0.522, P<0.05), while glucose oxidation correlated negatively (r < −0.551, P <0.04) with fasting AC. Postprandially, plasma glucose, insulin, and TG concentrations increased, and FFA concentrations decreased significantly. The responses of plasma AC species depended on chain length and saturation, with C14:0, C16:0, and C18:0 remaining unchanged, and unsaturated species (e.g., C14:1, C14:2) falling significantly (21–46%, P < 0.03). Post-meal nadir AC concentrations were positively associated with LBM, postprandial fatty acid flux and FFA concentrations (r > 0.515, P < 0.05). By contrast, nadir AC correlated negatively with insulin sensitivity and spillover of meal-derived fatty acids (r < −0.528, P < 0.04).
Conclusions
Conditions that impact fatty acid flux contribute to the control of postprandial plasma AC concentrations. These data underscore the need for a better understanding of postprandial fatty acid oxidation and dietary fat delivery in the setting of adipose insulin resistance to determine how postprandial lipemia contributes to chronic disease risk.
Keywords: postprandial lipemia, stable isotopes, mixed meal
INTRODUCTION
Acylcarnitines (AC) are carnitine esters of fatty acids that have entered the mitochondria [1], and their quantitation has been used for over 20 years to diagnose inborn errors of fatty acid metabolism [2]. Recently, plasma AC have been proposed as biomarkers of insulin resistance and metabolic inflexibility in adults [3–4]. Although the plasma FFA pool is the original precursor of intracellular tissue fatty acids, Kanaley et al determined that the intramyocellular (IMCL) triglyceride (TG) pool is the immediate fatty acid precursor of intramyocellular long-chain AC (LCAC) in fasted humans [5]. With respect to the role of dietary fatty acids, one report by Kien et al demonstrated that a dietary change as brief as 7 days can result in similarities between the dietary fatty acid composition and muscle TG and AC species, again assessed in the fasting state [6]. Thus, both endogenous and dietary fatty acids have the potential to impact the composition of AC species, varying in chain length and saturation.
Fasting plasma AC concentrations have been shown to be elevated in obese individuals with either impaired glucose tolerance or diabetes [3, 7] and these findings support incomplete fat oxidation in these subjects. However, AC concentrations increase in the plasma of lean, insulin-sensitive subjects during long-term fasting [8] and relatively healthy overweight subjects during caloric restriction [9]. These observations suggest that the AC increase in obesity may not only be due to an impairment of metabolism, but may also be a natural response to an excess supply of lipid. Thus, increased production of AC could result from excess fatty acid flux emanating from lipid stored either intracellularly or peripherally. Indeed, plasma AC concentrations are reduced during an oral glucose tolerance test and during a euglycemic hyperinsulinemic clamp, both procedures that reduce plasma FFA concentrations significantly [4, 10]. Yet, under these conditions, obese and diabetic subjects maintained higher AC concentrations than lean controls [4].
Metabolic dysfunction can be uncovered by the challenge of food consumption [11–12]. Given that elevations in postprandial lipemia pose an independent risk for the development of chronic disease [13–15], it is important to understand how the metabolic transitions from fasting to feeding can be reflected in changes in plasma AC. The present study was designed to determine whether AC concentrations would fall when subjects were fed a high-fat, mixed meal, which produced a physiologic pattern of postprandial elevations in glucose and insulin, reductions in FFA, concurrent with significant increases in plasma TG-rich lipoproteins. We sought to 1) compare the dynamic responses of different AC species and 2) identify subject characteristics associated with changes in post-meal concentrations of plasma AC. Our goal was to test the hypothesis that a fall in plasma AC after a standardized mixed meal would be positively related to measures of insulin sensitivity. We hypothesized that the concentrations of all plasma AC would fall after consumption of a meal that induces a significant reduction in adipose fatty acid release and plasma FFA concentration.
METHODS
Human subjects
Sixteen non-diabetic, non-smoking, sedentary overweight or obese subjects were recruited from health fairs and physician referral and gave their written informed consent. This study was a sub-project of a larger postprandial study in which our goal was to recruit Hispanic (H) or African-American (AA) men or women (age 20–70 yrs), with a wide range of insulin sensitivities, stable body weight, and maintenance of pre-enrollment physical activity. The study was approved by the Institutional Review Board at the University of Texas Southwestern Medical Center (IRB Number 062007-025) and was conducted according to the principles expressed in the Declaration of Helsinki.
Study timeline
Subjects were studied over a 3-wk period which included 2 in-patient admissions to the Clinical Translational Research Center (CTRC). The first admission included an insulin-modified, frequently-sampled, intravenous glucose tolerance test (FSIVGTT) performed after a 12-h overnight fast [16–17] and body composition measurements by DEXA (Hologic Discovery W, QDR series). Three days prior to this admission, the subject was placed on a weight-maintaining, out-patient diet formulated to resemble his/her food intake pattern as assessed by a food frequency questionnaire, and composed of foods they typically ate, as assessed by a 3-day dietary recall [18]. The ad libitum intake of the subjects (mean ± SD) was as follows: 2148 ± 478 kcal/d total energy; 33.5 ± 5.4% energy from fat (of this, 11.2 ± 9.7% from saturated fatty acids (SFA), 12.6 ± 10.2% from monounsaturated fatty acids (MUFA), 6.8 ± 1.4% from polyunsaturated fatty acids (PUFA), with the remaining ~2.9% trans and omega-3 fats); 48.0 ± 5.9% energy from carbohydrate; 18.5 ± 3.9% energy from protein; 128.5 ± 64.5 g/d total sugars; and cholesterol intake, 331 ± 114 mg/d. The outpatient diet was prepared by staff in the research kitchen at the UTSW CTRC and delivered to the subject for consumption at home. For 10d total (3d prior to admission #1 and 7d before admission #2), the subject consumed the prepared diet. Alcohol consumption was prohibited from 3d before admission #1 and throughout the period through admission #2. The average daily intake of caffeine at home was 76 mg and subjects abstained from caffeine use during the 30 h of admission #2. FSIVGTT values of glucose were analyzed immediately with a bedside analyzer from Yellow Springs Instruments and insulin was analyzed within 4d by ELISA (Millipore, #EZHI-14L). As shown in fig. 1, on day 1 of admission #2, at 1800, the subject consumed a standardized evening meal. The subject fasted for 18 h and consumed only water or non-caloric, non-caffeine containing beverages between the evening meal and lunch the next day. The reason for this extended fast was to bring the subject to a moderate rate of lipolysis, as we have observed previously that lipolysis remains relatively low after a 12-h fast compared to an 18-h fast (EJP observations between 12 and 18h during a 24-h fast [19]). At midnight, an IV infusion began containing potassium [1,2,3,4-13C4]-palmitate, complexed to albumin, in order to calculate the rate of appearance of plasma FFA (RaFFA). Indirect calorimetry was performed using a metabolic cart (VMax Encore, Viasys Healthcare) in the hooded mode and data were obtained for 30 min while subjects were fasting (day 2, 0800–0830) and again 2.5h (1430) after the initiation of the meal (1200). From 0600 to 1800 on day 2, the subject rested, read, or watched television. Blood was drawn intermittently from an IV-line between 0600 and 1750. Isotopes were purchased from Isotec (Miamisburg, Ohio, USA), were sterile and pyrogen free, and were prepared using sterile techniques.
Figure 1. Study Timeline.

During the 7-days prior to the study, the subject consumed a standardized diet. The X on the figure denotes the timing of blood draws and RQ denotes the timing of indirect calorimetry.
Meal composition and analysis of blood metabolites
The noon meal on day 2 consisted of a cocoa-flavored drink (cocoa, corn oil, heavy cream, sucrose, and skim milk), cereal, banana, and skim milk. This meal was formulated to provide 38% of total daily energy needs (Table 1). To prepare the drink, 1 gram of a uniformly-labeled stable isotope tracer (either d31 or 13C16 palmitate potassium salt) was warmed to homogenize it into the liquid, based on the methodology of Beysen et al [20]. This label was sufficient to quantify the spillover of dietary fatty acids into the plasma FFA pool, and the tracer 13C4 IV palmitate delivered at a rate of 7 µg/kg/min was sufficient to measure fatty acid turnover, but both doses were so low so as to not be detectable in the plasma AC pool (see below). The fatty acid compositions of the shake-TG, of plasma-TG, and FFA were analyzed by gas chromatography (GC) and the labeling pattern analyzed by GC/MS as previously described [21]. All the fat in the meal was found in the liquid drink and the balance of energy in the meal was made up by the cereal, banana, and milk. The subjects were given 15 min to consume the meal. All blood samples were drawn into iced tubes containing EDTA. Plasma was separated immediately by centrifugation (3000 rpm, 1500 × g, 10 min) at 4°C and the samples were kept on ice while preservatives and antioxidants were added. TRL were isolated as described previously [22]. For plasma metabolite concentrations, enzymatic kits were used for plasma-TG in TRL (WAKO, #461-09092, #461-08992, Richmond, VA), glucose (WAKO, #439-90901), and FFA (WAKO, #999-34691, #991-34891). Insulin was measured by ELISA (Millipore, #EZHI-14L). Results were read on a Power wave XS micro-titer plate reader (Biotek, Inc).
Table 1.
The composition of the test meal
| Mean ± SD | |
|---|---|
| Test Meal Composition a | |
| Energy (kcal) | 790.4 ± 118.7 |
| Fat (g) | 44.4 ± 9.5 |
| Protein (g) | 15.8 ± 8.2 |
| Carbohydrate (g) | 90.1 ± 22.7 |
| Total sugars (g) | 63.4 ± 12.5 |
| Fiber (g) | 4.22 ± 2.11 |
| Cholesterol (mg) | 83.3 ± 11.9 |
| Meal-TG fatty acid composition b | |
| Saturated fatty acids | |
| 12:0 (wt %) | 1.32 ± 0.03 |
| 14:0 (wt %) | 4.66 ± 1.02 |
| 16:0 (wt %) | 22.64 ± 2.00 |
| 18:0 (wt %) | 7.55 ± 1.07 |
| Monounsaturated fatty acids | |
| 16:1, n-7 (wt %) | 0.78 ± 0.21 |
| 18:1, n-7 (wt %) | 0.12 ± 0.13 |
| 18:1, n-9 (wt %) | 27.13 ± 0.62 |
| 20:1, n-9 (wt %) | 0.87 ± 0.05 |
| Polyunsaturated fatty acids | |
| 18:2, n-6 (wt %) | 31.89 ± 4.39 |
| 18:3, n-3 (wt %) | 0.03 ± 0.06 |
The macronutrient composition of the meal (n=16) was analyzed using The University of Minnesota Nutrition Data System for Research (NDSR, 2009). All the fat in the meal was carried in the liquid drink.
The fatty acid compositions of the TG from the drinks were analyzed individually by GC.
Analysis of plasma acylcarnitines (AC) by ESI-MS/MS
To determine whether the tracer isotopes given would appear in the AC pool, more sensitive multiple-reaction monitoring was carried out. This analysis did not identify, nor did altering the types of added internal standards uncover, labeled palmitate or its products (L. Sweetman, E. Parks, unpublished results). Thus, the analysis of AC in 15 µL of plasma was performed by flow injection analysis electrospray ionization targeted tandem mass spectrometry (FIA-ESI-MS/MS) as previously described [23]. The internal standards were deuterium-labeled free carnitine, C3, C5, and even number AC from C2 to C18 in 200 µL of methanol added to the plasma samples. After removal of protein by centrifugation and drying, butyl esters were formed by adding 100 µL of 3N HCl in butanol and heating at 55°C for 15 min, then dried and redissolved in 150 µL 80% acetonitrile:20% water for FIA-MS/MS. The mass spectra of the AC precursors of the common product ion at m/z 85 for all AC were obtained and concentrations of AC calculated from ratios of intensities to the internal standard closest in m/z. Total LCAC species were defined as all saturated, mono- and polyunsaturated species of 12–18 carbon chain length. The AC lower limits of quantitation are 10–20 nmol/L [2]. It should be pointed out that a few of the postprandial AC concentrations approached this lower level. The accuracy of these low concentrations is supported by the presence of these data within a post-meal fall in concentrations characteristic of classical biological production and decay kinetics.
Calculations and statistical analysis
Energy expenditure and substrate oxidation were calculated using the equations of Jequier [24]. Fasting protein oxidation was calculated from the known grams of protein present in the foods consumed during the previous 24h, while fed-state protein oxidation was calculated from total urea nitrogen measured in all urine collected from 1200 to 1800 on day 2. This calculation of protein oxidation is based on the assumption that meal protein disposal occurred continuously for 6h after the meal [25]. The presence of the dietary fatty acid label in the plasma FFA pool is evidence of meal-derived fatty acids [26]. The fatty acid infusate composition and enrichments were analyzed by GC and GC/MS, and the calculations of the rate of appearance of fatty acids (RaFFA) as described previously [21, 27] using Steele's equation for non-steady state kinetics [28]. The nadir RaFFA and nadir AC values were determined based on the lowest value achieved during the 6h after the meal. Both fatty acid species and AC species are presented and discussed herein. To distinguish the two in the text, AC notation will be preceded by a capital letter C (e.g., C18:1), while fatty acids will not (e.g., 18:1). Calculations were performed using Excel (version 2007; Microsoft, Seattle, WA) and statistical analyses using Statview for Windows (version 5.0.1; SAS Institute, Berkeley, CA). A P-value of < 0.05 was considered statistically significant. Data for SI were transformed using natural logarithm because of their non-normal distribution.
RESULTS
The gender/ethnic distribution was 12F (7 H and 5 AA) and 4M (3 H and 1 AA). As part of the project, each subject was screened on one occasion and then was admitted to the CTRC to study fatty acid metabolism (fig. 1). Clinical and laboratory values obtained during screening procedures revealed that the subjects were: overweight to obese (BMI 35.4 ± 7.4 kg/m2, mean ± SD), age 45.8 ± 8.5 y, total body weight 92.9 ± 22.7 kg, fat mass 38.6 ± 16.1 kg, lean body mass (LBM) 51.1 ± 9.8 kg, and waist:hip ratio 0.92 ± 0.07. Results from the FSIVGTT demonstrated variability in insulin sensitivity, with mean SI = 2.61 ± 1.47 10−4 min−1 ·µU−1 mL−1 (range 0.89–6.25) and a disposition index of 1318 ± 699 (unitless) (range 175–2510).
Concentrations of metabolites and hormones in the fasting and fed states
The subjects consumed a standardized lunch that was on average, 50% of energy from fat, 43% from carbohydrate, and 7% from protein (table 1). Of the major fatty acids in meal-TG, saturated fatty acids made up 36.2 wt% of the total TG-fatty acids, monounsaturates 28.9%, and polyunsaturates 31.9%. The subjects tolerated the meal well, aside from an occasional comment of feeling full. Presented in fig. 2 are the changes in metabolic parameters during the study. Glucose concentration (fig. 2A) assessed just before the meal was 5.5 ± 0.1 mmol/L and rose to 7.7 ± 0.4 mmol/L at peak, reflecting the moderate carbohydrate content of the meal (table 1). Pre-lunch insulin concentration was 15 ± 6 and post-lunch, rose 5-fold to 74 ± 14 µU/mL and peaked at 0.75h (fig. 2A). The concentration of TRL-TG represented 42.8 ± 20.0% and 63.7 ± 23.2% of the total plasma-TG concentration in the fasting and fed-states, respectively (fig. 2B). Whole body fat oxidation did not change after the meal, but glucose oxidation rose significantly (77.3 ± 19.9%, P = 0.005, fig. 2C), as did energy expenditure (10.5 ± 2.6%, P = 0.001, fig. 2D).
Figure 2. Concentrations of metabolites and insulin, substrate oxidation, energy expenditure and RaFFA (µmol/kg/min) in the fasted and fed states.
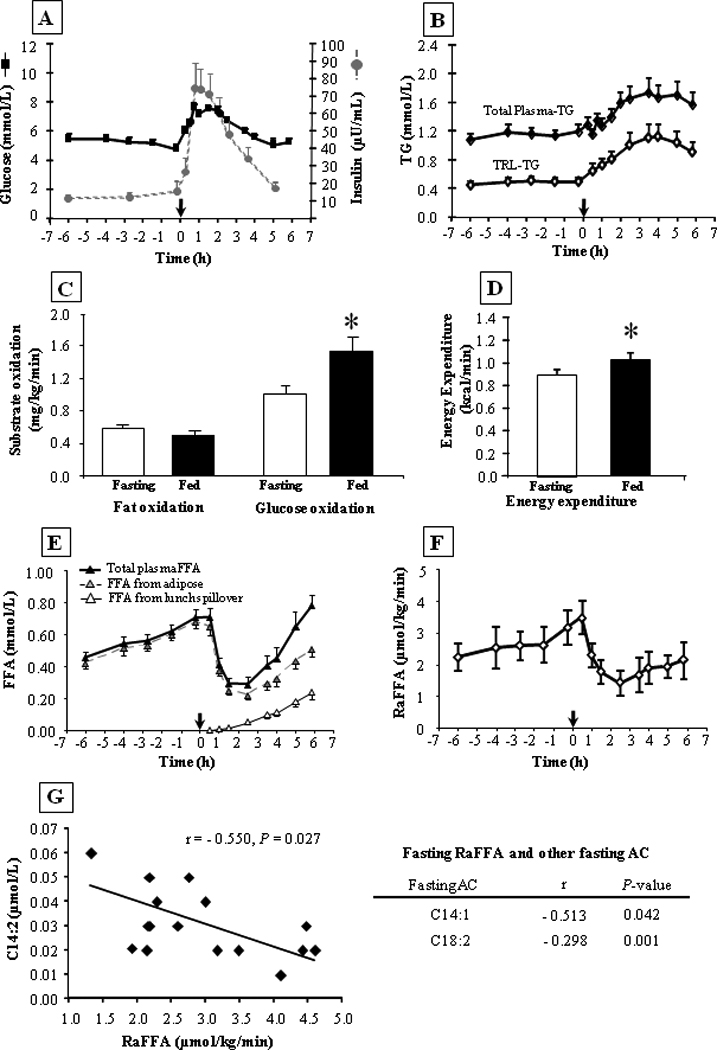
N=16, data are mean ± SEM. Subjects had remained fasted from the time of consumption of the previous evening meal at 1800 on day 1. Samples were collected from −6h (0600 h) and the noon meal is denoted by the arrow at time 0. For fig. 2C and 2D, fasted values represent data from −4h and fed data from +2.5h. Fasting and fed RaFFA (fig. 2F, units in µmol total fatty acids /kg total body weight /min) were determined using Steele's equation (see methods). For fig. 2G, presented on the left is a graph of the relationship between fasting C14:2 and the fasting RaFFA (taken at −2h). The table on the right presents the other fasting AC data that also correlated with fasting RaFFA. The symbol * indicates P ≤ 0.05.
Fasting FFA concentration (0.46 ± 0.05 mmol/L at 0600) rose significantly to 0.71 ± 0.05 mmol/L just before lunch (P=0.0001). The pre-lunch FFA concentration was suppressed by 60% at 2h to 0.28 ± 0.03 (P < 0.001, fig. 2E). The rate of appearance of plasma FFA (RaFFA) in the fasting state was 2.91 ± 0.25 µmol/kg/min just before lunch and fell 59.5 ± 3.8 %, to a nadir 1.15 ± 0.13 µmol/kg/min (P < 0.0001, fig. 2F). The fasting RaFFA was negatively associated with the fasting concentration of C14:2 (fig. 2G), and two other fasting AC (C14:1, C18:2) suggesting that those subjects with the greatest fatty acid turnover had either low levels of fatty acids entering beta-oxidation, or those fatty acids that entered were completely oxidized to CO2. It is likely that the former was true because fasting fatty acid turnover (RaFFA) was not related to fasting whole-body fat oxidation (data not shown). Koutsari and Jensen have shown that 20% of fatty acid flux in the fasting state goes to non-oxidative disposal [29].
Relationships between fasting AC concentrations and subject characteristics
Since previous studies have observed significant relationships between fasting AC and measures of insulin resistance, we tested the effects of insulin sensitivity, and other subject characteristics, on fasting AC concentrations in the present population. Surprisingly, neither fasting glucose concentration, HOMA-IR, insulin, LnSI, nor HbA1c were related to the fasting C2 concentrations (fig. 3A), potentially due to the smaller sample size in the present study compared to previous investigations [4]. However, both LBM (fig. 3B) and fasting fat oxidation (fig. 3C) were strongly and positively associated with multiple AC species. Specifically, the association between LBM and fasting plasma AC was significant for several short-chain AC (C3, C3-DC, C4, C5, C5:1) and C10:1, while fasting fat oxidation was related to the concentration of long-chain saturated and unsaturated species (C12:1, C14, C14:1, C14:2, C16:1). By contrast, whole body glucose oxidation was negatively associated with C2 concentration and several LCAC (fig. 3D). In other words, those subjects with the lowest fasting AC concentrations were those who had the lowest fat oxidation and the highest glucose oxidation in the fasting state. Fat mass was not significantly associated with any fasting AC concentrations (data not shown).
Figure 3. Correlations between selected variables and fasting acylcarnitine species.
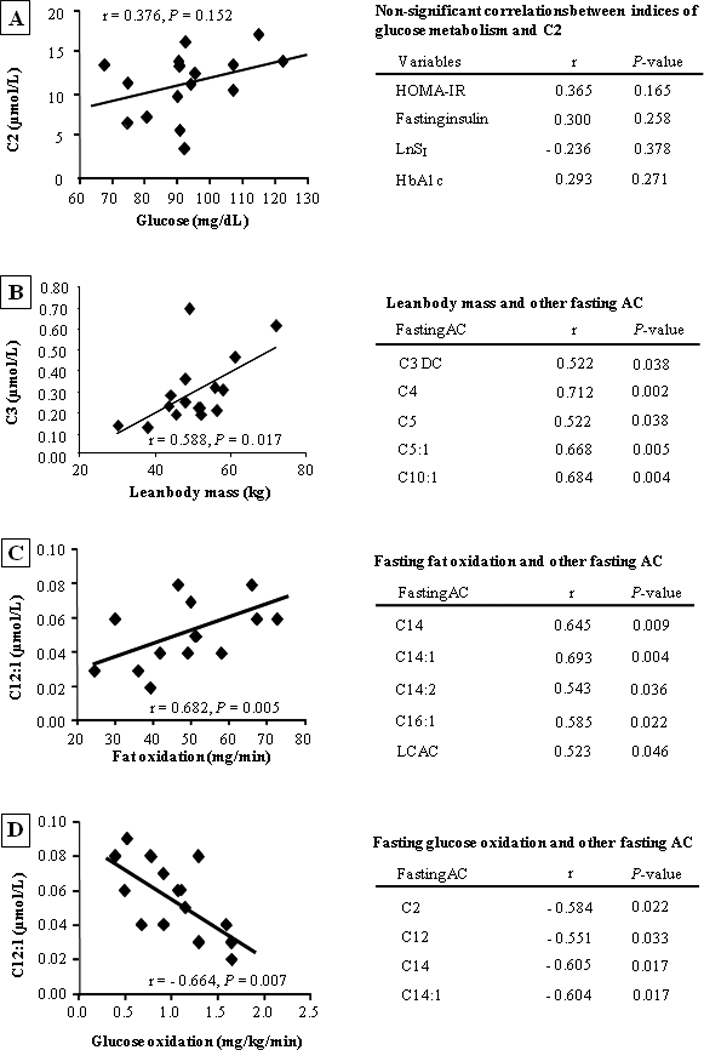
Fig. 3A, depicts the lack of association between variables relevant to carbohydrate metabolism (fasting glucose, HOMA-IR, fasting insulin, SI transformed as the natural logarithm, and HbA1c) and C2. For fig. 3B–3D, presented on the left is a representative graph of the relationship between independent variables (lean body mass, fat oxidation, and glucose oxidation) and AC species. The table on the right presents the other AC data that also correlated with each independent variable of interest.
Although studies have tested the impact of glucose utilization on AC concentrations, postprandial changes in plasma AC concentrations in adults have not been investigated in the physiological setting of eating, i.e., subjects consuming a mixed meal containing fat and carbohydrate. We hypothesized that if the plasma FFA pool was the original precursor for AC produced in tissues, then when plasma FFA fell postprandially, plasma AC would fall in concert. Comparison of the fasting and nadir concentrations (fig. 4) revealed that in the postprandial state, C2, C3-DC and C4-DC were reduced 20–30%, while C3 and C4 tended to increase 15% post-meal (P = 0.07). Only minor changes were observed in the concentrations of the other short- and medium-chain AC (fig. 4B). The saturates C14, C16, and C18 did not change postprandially (fig. 4C) but in each case, the unsaturates of these AC decreased significantly after the meal (↓21–46%, P < 0.03, fig. 4C). The postprandial changes in concentrations of all the individual AC can be found in supplemental figures 1 and 2. Although all plasma FFA, saturated and unsaturated species, were reduced after the meal (fig. 2E and suppl. fig. 1 and 2), the responses of the plasma AC depended on chain length and saturation.
Figure 4. Fasting and post-meal nadir concentrations of plasma acylcarnitine species.

Values are mean ± SEM. Fasting data (open bars), fed nadir concentration (solid bars). * P < 0.05, †P < 0.09.
Relationships between postprandial AC concentrations and fed state variables
Because different subjects suppressed their AC concentrations differently after the meal, we sought to determine whether any changes in AC could be predicted by subject characteristics. As shown in fig. 5A, greater peripheral insulin sensitivity was associated with lower LCAC species in the fed state (P < 0.03). Thus, those subjects with higher insulin-mediated glucose disposal rates exhibited lower nadir concentrations of three LCAC (C12:1,C14 and C14:1). Similar to the fasting state, LBM remained positively associated with short-chain AC species (C3, C4, C5, C6; r = 0.704 to 0.840; P < 0.05 for all, data not shown), while fed-state glucose oxidation again negatively correlated with nadir AC (C12:1, C14:1, C14:2, C16; r = −0.516 to −0.644; P < 0.05 for all, data not shown). In the fed state, nadir FFA concentration was significantly and positively associated with nadir RaFFA (r = 0.612, P=0.012, data not shown). Comparing both of these variables with nadir plasma AC revealed significant positive associations (fig. 5B and 5C). These data show that a lack of suppression of adipose fatty acid release postprandially leads to elevated AC concentrations. Lastly, dietary fatty acids can enter the plasma FFA pool through a process known as spillover [30], which is thought to occur mainly at adipose [31]. In the present study, the greater the quantity of dietary-derived fatty acids in the FFA pool, the lower the LCAC concentration after the meal (fig. 5D). These data support the concept that the spillover of chylomicron fatty acids is associated with a lower entry of fatty acids into the mitochondria.
Figure 5. Correlations between selected variables and post-meal nadir acylcarnitine species.
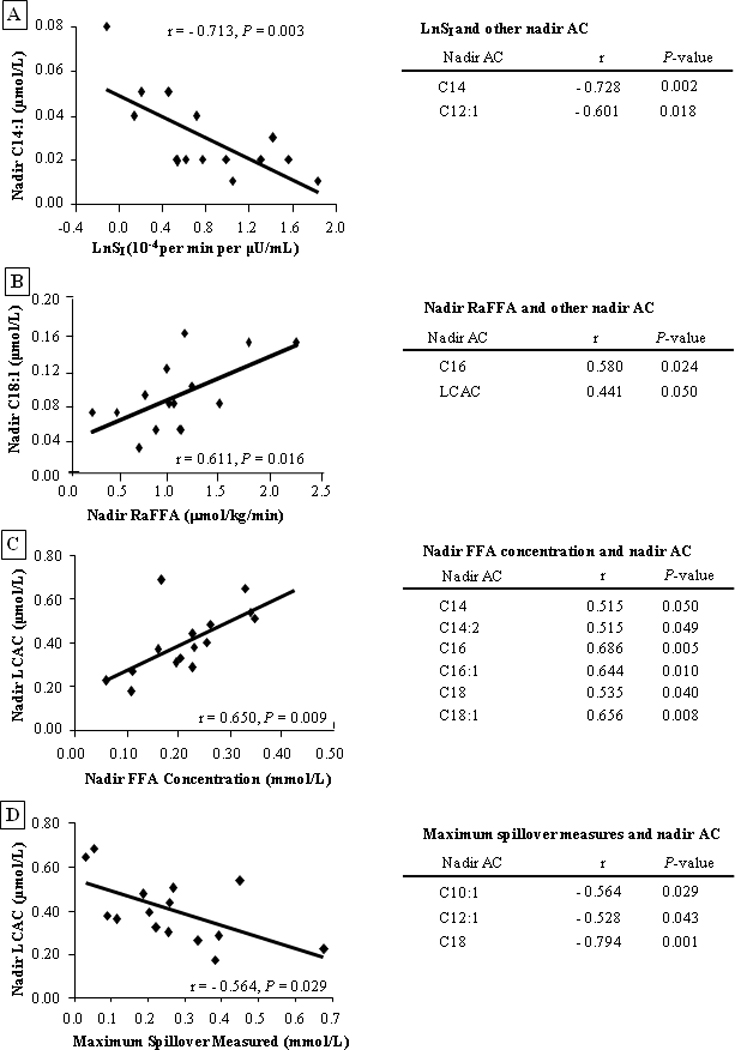
The left side of each figure has a representative graph of the relationship between independent variables (LnSI, nadir RaFFA, nadir FFA concentration, or maximum spillover measured) and nadir AC. The table at the right presents other AC species that also correlated with the variable of interest.
DISCUSSION
Acylcarnitines are carnitine esters derived from fatty acids or amino acids transferred into the mitochondria [1]. Elevated AC production can occur when β-oxidation rates are in excess of complete oxidation to CO2 through the TCA cycle [1, 23]. Previous studies have shown that AC concentrations increase with duration of fasting in humans [8, 32]. By contrast, glucose-stimulated insulin secretion during an OGTT [10] or hyperinsulinemia during a euglycemic clamp significantly reduce AC concentrations [4, 32]. The acute postprandial pattern of AC species was unknown - as past studies were designed to understand the impact of glucose/insulin challenge and not to mimic the physiology of a mixed meal.
As a result of a growing body of data in the literature, plasma AC levels are proposed as biomarkers in subjects with insulin resistance [3–4]. Indeed, AC concentrations are higher in the fasting state in insulin resistant populations and decrease less during glucose challenge tests [4, 10]. This latter observation may be due to a continued release of adipose FFA as a result of adipose insulin resistance, or could be due to use of IMCL [33]. With respect to the role of dietary fatty acids, very little is known. AC composition has been shown in one study to resemble longer-term, dietary fatty acid composition [6] and also in another study, to increase acutely after a a single oral bolus of oil [34]. Thus, both endogenous and dietary fatty acids could impact AC composition and concentration. Given the multiple sources of metabolic substrates that could serve as precursors of plasma AC, we sought to determine how AC concentration would change under physiologic conditions which would elicit an insulin response suppressing adipose fatty acid release, while at the same time leading to dietary fat absorption. Our key finding was that the responses of different AC species varied after the meal. The concentrations of the saturates C14:0, C16:0, and C18:0 remained steady, while the mono- and polyunsaturates fell significantly. This finding is in line with data supporting greater oxidation of long-chain unsaturated fatty acids (18:1, 18:2) compared to saturates in humans [35–36] and in rodents [37]. Using an isotopic dilution method in vivo, Kanaley et al measured a fatty acid label present in the same AC species [5]. In that study, as in the present project, isotope administration did not result in labeling of downstream AC products - most likely due to administration at tracer amounts used for turnover measurements. The seminal finding of Kanaley et al was that the plasma FFA is an original precursor of muscle AC, but that intramyocellular-TG serves as a key intermediate compartment between these two pools in fasted individuals [5]. The present results echo these findings, but in the fed state here, by demonstrating a postprandial pattern of reductions in plasma FFA, which precede reductions in long-chain and medium-chain AC concentrations.
The transition from the fasted to fed states is characterized by changes in the metabolism of long-chain fatty acids which is determined by a balance between adipose fatty acid release, availability of tissue lipid stores, mitochondrial fatty acid transfer, release of dietary-fatty acids by intravascular lipolysis, tissue fatty acid uptake, and mitochondrial fatty acid oxidation rates. As shown in the supplementary data, from 0 to 2h postprandially LCAC (C16, C18:1, C18:2) were constant against a background of significant plasma FFA reduction. One interpretation of this finding is that from 0–2h, the source of the AC was IMCL. Concurrently, the intermediate fatty acid beta-oxidation byproducts (C8, C10, C10:1, C12, C12:1, C14:1, C14:2, and C16:1) fell from the onset of eating (0–2h). This fall in by-products could have occurred due to their accelerated use, or a decline in their production. Our data are consistent with the latter, since whole-body fat oxidation remained unchanged. At 4h, C16, C18:1 and C18:2 finally reached a nadir and then began to rise in the late postprandial phase when dietary fatty acids were being liberated in the plasma compartment, and at the same time adipose fatty acid release resumed (fig 2E). Altogether, these data suggest that the use of IMCL serves as a ~3h buffer for the dramatic loss of plasma FFA after the onset of eating. If this interpretation of events is accurate, adipose insulin resistance in the fed state could result in significant overload of muscle beta-oxidation, leading to negative effects such as inflammation and defects in insulin signaling [38–39].
Our secondary findings include a strong influence of LBM to increase the production of short-chain AC in both the fasted and fed states. Mihalik and colleagues found significant positive correlations between BMI and multiple fasting AC species [4]. Our data suggest that for at least the short-chain AC, these relationships were due to a direct provision of substrate (branch-chain amino acids) mediated through elevated LBM. Many of the subjects described in the literature as having the highest fasting AC concentrations were overweight, obese and diabetic, and had a higher LBM either because of male gender [40], ethnicity (African American [3, 41]) or obesity [42]. The composite of increased FFA substrate and availability of muscle mass rich in mitochondria suggests that overweight and obese individuals have both the source and the means to form AC species.
We also observed that those individuals with the lowest LCAC concentrations in both the fasted and fed states were those whose glucose oxidation was the highest at those times. Conversely, positive and significant associations were found between fasting LCAC and fasting fat oxidation. In the fed state, the influence of fatty acid flux was evident by the positive relationships between adipose fatty acid release, post-meal FFA concentrations, and postprandial AC concentrations. Consistent with past observations of higher acetyl-carnitine in fasted insulin resistant subjects [3–5], during the fed state, a high insulin sensitivity index was associated with lower postprandial LCAC, specifically C14 and C14:1. Interestingly, these two AC, frequently used as biomarkers of inborn errors in metabolism [2], were repeatedly predictive of whole body substrate oxidation in the fasting and fed states. Lastly, dietary fatty acid spillover is found in individuals who have appropriately suppressed fatty acid turnover in the fed state. These are the same people who exhibited high insulin sensitivity, low postprandial nadir FFA concentrations, and a switch to glucose oxidation in the fed state. If this scenario is correct, then dietary fatty acid spillover is a natural result of active adipose liberation of dietary fatty acids through lipolysis but slow turnover of FFA in the blood.
The present study had a number of limitations, including the small sample size of postprandial studies compared to larger fasting metabolomic analyses, the restricted ethnicity of the subjects, and the assessment of AC after only one meal. We were surprised at the very low level of variability between the subjects in their patterns of postprandial AC change at each time point (suppl. fig. 1 and 2). The strong correlations found between fasting (or nadir) AC concentrations and various subject characteristics were present for multiple similar AC species (either long or short-chain AC), which provides support for these findings. The rigor of our standardization of the meal protocol, particularly amongst this group of subjects with a wide range of insulin sensitivities, likely facilitated the testing of our hypothesis. Given the present data, future study designs can now be devised to determine meal labeling parameters that will result in non-steady state tracking of fatty acids into the mitochondria.
In summary, the present study is the first to demonstrate the temporal pattern of change in plasma AC in overweight subjects consuming a mixed meal and we have demonstrated that conditions that impact fatty acid flux contribute to the control of AC concentrations. Elevated adipose fatty acid release postprandially led to increased FFA, which was associated with elevations in products of incomplete beta-oxidation. Insulin sensitivity at muscle and adipose can both lead to lower post-meal AC. Future studies investigating AC as biomarkers of metabolic function should include a focus on the precursor molecules used for AC production. In subjects with elevated body weights, precursors of short-chain AC could be derived from muscle stores of branch-chain amino acids and/or from plasma sources (e.g., diet). Moreover, medium- and long-chain AC can be derived from IMCL in the short term, and diet and peripheral stores over the long-term. A better definition of the role of AC during the transition from the fasted to fed states will aid in the understanding of how substrate overload contributes to metabolic dysfunction postprandially.
Supplementary Material
ACKNOWLEDGEMENTS
The authors would like to express their appreciation to the research subjects for their time and enthusiasm, to the staff of the Clinical Translational Research Center, and to Dora Bradford at UT Southwestern Medical Center for their excellent care of the research subjects; and to Dr. Robert Phair from Integrative Bioinformatics Inc. for helpful discussions of the data.
FUNDING
This study was funded with support from NIH grants 5RL1DK081187-04 (PI E.J. Parks), 5PL1DK081183-04 (PI E. Livingston), UL1DE019584-04 (PI J. Horton), and CTSA NIH Grant UL1-RR02498
Abbreviations
- AA
African American
- AC
acylcarnitines
- CTRC
clinical translational research center
- FFA
plasma non-esterified fatty acids
- FSIVGTT
insulin-modified, frequently-sampled intravenous glucose tolerance test
- H
Hispanic
- IMCL
intramyocellular lipid
- LBM
lean body mass
- RaFFA
rate of appearance of FFA
- SI
insulin sensitivity
- TG
triglycerides
- TRL
triglyceride-rich lipoproteins
Footnotes
Publisher's Disclaimer: This is a PDF file of an unedited manuscript that has been accepted for publication. As a service to our customers we are providing this early version of the manuscript. The manuscript will undergo copyediting, typesetting, and review of the resulting proof before it is published in its final citable form. Please note that during the production process errors may be discovered which could affect the content, and all legal disclaimers that apply to the journal pertain.
Disclosure Statement: No conflicts of interest exist for any of the four authors.
AUTHOR CONTRIBUTIONS
M.A.R.R. collected insulin sensitivity data, analyzed all results, performed statistical analysis, and wrote the manuscript; L.S. assisted with study design, performed sample analysis, and contributed essential interpretation of the data; M.J.V. contributed to the conduct of the study, collected and analyzed dietary data; and E.J.P. designed the study, analyzed the data and contributed to manuscript writing
REFERENCES
- 1.Stephens FB, Constantin-Teodosiu D, Greenhaff PL. New insights concerning the role of carnitine in the regulation of fuel metabolism in skeletal muscle. J Physiol (Lond) 2007;581(2):431–444. doi: 10.1113/jphysiol.2006.125799. [DOI] [PMC free article] [PubMed] [Google Scholar]
- 2.Millington DS, Kodo N, Norwood DL, et al. Tandem mass spectrometry: a new method for acylcarnitine profiling with potential for neonatal screening for inborn errors of metabolism. J Inherit Metab Dis. 1990;13(3):321–324. doi: 10.1007/BF01799385. [DOI] [PubMed] [Google Scholar]
- 3.Adams SH, Hoppel CL, Lok KH, et al. Plasma acylcarnitine profiles suggest incomplete long-chain fatty acid β-oxidation and altered tricarboxylic acid cycle activity in type 2 diabetic African American women. J Nutr. 2009;139:1073–1081. doi: 10.3945/jn.108.103754. [DOI] [PMC free article] [PubMed] [Google Scholar]
- 4.Mihalik SJ, Goodpaster BH, Kelley DE, et al. Increased levels of plasma acylcarnitines in obesity and type 2 diabetes and identification of a marker of glucolipotoxicity. Obesity. 2010;18(9):1695–1700. doi: 10.1038/oby.2009.510. [DOI] [PMC free article] [PubMed] [Google Scholar]
- 5.Kanaley JA, Shadid S, Sheehan MT, et al. Relationship between plasma free fatty acid, intrmyocellular triglycerides and long-chain acylcarnitines in resting humans. J Physiol (Lond) 2009;587(24):5939–5950. doi: 10.1113/jphysiol.2009.180695. [DOI] [PMC free article] [PubMed] [Google Scholar]
- 6.Kien CL, Everingham KI, Stevens RD, et al. Short-term effects of dietary fatty acids on muscle lipid composition and serum acylcarnitine profile in human subjects. Obesity. 2011;19(2):305–311. doi: 10.1038/oby.2010.135. [DOI] [PMC free article] [PubMed] [Google Scholar]
- 7.Newgard CB, An J, Bain JR, et al. A branched-chain amino acid-related metabolic signature that differentiates obese and lean humans and contributes to insulin resistance. Cell Metab. 2009;9(4):311–326. doi: 10.1016/j.cmet.2009.02.002. [DOI] [PMC free article] [PubMed] [Google Scholar]
- 8.Hoppel CL, Genuth SM. Carnitine metabolism in normal-weight and obese human subjects during fasting. Am J Physiol. 1980;238:E409–E415. doi: 10.1152/ajpendo.1980.238.5.E409. [DOI] [PubMed] [Google Scholar]
- 9.Redman LM, Huffman KM, Landerman LR, et al. Effect of caloric restriction with and without exercise on metabolic intermediates in nonobese men and women. J Clin Endocrinol Metab. 2011;96(2):E312–E321. doi: 10.1210/jc.2010-1971. [DOI] [PMC free article] [PubMed] [Google Scholar]
- 10.Zhao X, Peter A, Fritsche J, et al. Changes of the plasma metabolome during an oral glucose tolerance test: is there more than glucose to look at. Am J Physiol. 2009;296(2):E384–E393. doi: 10.1152/ajpendo.90748.2008. [DOI] [PubMed] [Google Scholar]
- 11.Donnelly KL, Smith CI, Schwarzenberg SJ, et al. Sources of fatty acids stored in liver and secreted via lipoproteins in patients with nonalcoholic fatty liver disease. J Clin Invest. 2005;115(5):1343–1351. doi: 10.1172/JCI23621. [DOI] [PMC free article] [PubMed] [Google Scholar]
- 12.Parks EJ. Dietary carbohydrate's effects on lipogenesis and the relationship of lipogenesis to blood insulin and glucose concentrations. Br J Nutr. 2002;87 Supple 2:S247–S253. doi: 10.1079/BJNBJN/2002544. [DOI] [PubMed] [Google Scholar]
- 13.Austin MA. Plasma triglyceride as a risk factor for cardiovascular disease. Can J Cardiology. 1998;13 Suppl B:14B–17B. [PubMed] [Google Scholar]
- 14.Hodis HN. Triglyceride-rich lipoprotein remnant particles and risk of atherosclerosis. Circulation. 1999;99(22):2852–2854. doi: 10.1161/01.cir.99.22.2852. [DOI] [PubMed] [Google Scholar]
- 15.Smith SC, Jr., Greenland P, Grundy SM. AHA Conference Proceedings. Prevention conference V: Beyond secondary prevention: Identifying the high-risk patient for primary prevention: executive summary. American Heart Association; Circulation; 2000. pp. 111–116. [DOI] [PubMed] [Google Scholar]
- 16.Bergman RN, Ider YZB, C R, Cobelli C. Quantitative estimation of insulin sensitivity. Am J Physiol. 1979;236(6):E667–E677. doi: 10.1152/ajpendo.1979.236.6.E667. [DOI] [PubMed] [Google Scholar]
- 17.Boston RC, Stefanovski D, Moate PJ, et al. MINMOD Millennium: a computer program to calculate glucose effectiveness and insulin sensitivity from the frequently sampled intravenous glucose tolerance test. Diabetes Technol Ther. 2003;5(6):1003–1015. doi: 10.1089/152091503322641060. [DOI] [PubMed] [Google Scholar]
- 18.Harris JA, Benedict FG. Biometric study of basal metabolism in man. Washington DC: Carnegie Institute; 1919. [Google Scholar]
- 19.Parks EJ, Krauss RM, Christiansen MP, et al. Effects of a low-fat, high-carbohydrate diet on VLDL-triglyceride assembly, production and clearance. J Clin Invest. 1999;104(8):1087–1096. doi: 10.1172/JCI6572. [DOI] [PMC free article] [PubMed] [Google Scholar]
- 20.Beysen C, Belcher AK, Karpe F, et al. Novel experimental protocol to increase specific plasma nonesterified fatty acids in humans. Am J Physiol. 2003;284(1):E18–E24. doi: 10.1152/ajpendo.00113.2002. [DOI] [PubMed] [Google Scholar]
- 21.Barrows BR, Parks EJ. Contributions of different fatty acid sources to VLDL-triacylglycerol in the fasted and fed-states. J Clin Endocinol Metab. 2006;91(4):1446–1452. doi: 10.1210/jc.2005-1709. [DOI] [PubMed] [Google Scholar]
- 22.Havel RJ, Eder HA, Bragdon JH. The distribution and chemical composition of ultracentrifugally separated lipoproteins in human serum. J Clin Invest. 1955;34:1345–1353. doi: 10.1172/JCI103182. [DOI] [PMC free article] [PubMed] [Google Scholar]
- 23.Rashed MS, Ozand PT, Bucknall MP, et al. Diagnosis of inborn errors of metabolism from blood spots by acylcarnitines and amino acids profiling using automated electrospray tandem mass spectrometry. Pediatr Res. 1995;38(3):324–331. doi: 10.1203/00006450-199509000-00009. [DOI] [PubMed] [Google Scholar]
- 24.Jequier E, Acheson K, Schutz Y. Assessment of energy expenditure and fuel utilization in man. Annu Rev Nutr. 1987;7:187–208. doi: 10.1146/annurev.nu.07.070187.001155. [DOI] [PubMed] [Google Scholar]
- 25.Hoffer LJ, Yang RD, Matthews DE, et al. Effects of meal consumption on whole body leucine and alanine kinetics in young adult men. Br J Nutr. 1985;53(1):31–38. doi: 10.1079/bjn19850007. [DOI] [PubMed] [Google Scholar]
- 26.Barrows BR, Timlin MT, Parks EJ. Spillover of dietary fatty acids and use of serum nonesterified fatty acids for the synthesis of VLDL-triacylglycerol under two different feeding regimens. Diabetes. 2005;54:2668–2673. doi: 10.2337/diabetes.54.9.2668. [DOI] [PubMed] [Google Scholar]
- 27.Mittendorfer B, Liem O, Patterson BW, et al. What does the measurement of whole-body fatty acid rate of appearance in plasma by using a fatty acid tracer really mean? Diabetes. 2003;52(7):1641–1648. doi: 10.2337/diabetes.52.7.1641. [DOI] [PubMed] [Google Scholar]
- 28.Steele R. Influences of glucose loading and of injected insulin on hepatic glucose output. Ann New York Acad Sci. 1959;82:420–430. doi: 10.1111/j.1749-6632.1959.tb44923.x. [DOI] [PubMed] [Google Scholar]
- 29.Koutsari C, Jensen MD. Fatty acid metabolism in human obesity. J Lipid Res. 2006;47:1643–1650. doi: 10.1194/jlr.R600011-JLR200. [DOI] [PubMed] [Google Scholar]
- 30.Timlin MT, Barrows BR, Parks EJ. Increased dietary substrate delivery alters hepatic fatty acid recycling in healthy men. Diabetes. 2005;54:2694–2701. doi: 10.2337/diabetes.54.9.2694. [DOI] [PubMed] [Google Scholar]
- 31.Bickerton AST, Roberts R, Fielding BA, et al. Preferential uptake of dietary fatty acids in adipose tissue and muscle in the postprandial period. Diabetes. 2007;56(1):168–176. doi: 10.2337/db06-0822. [DOI] [PubMed] [Google Scholar]
- 32.Soeters MR, Sauerwein HP, Duran M, et al. Muscle acylcarnitines during short-term fasting in lean healthy men. Clin Sci (Colch) 2009;116(7):585–592. doi: 10.1042/CS20080433. [DOI] [PubMed] [Google Scholar]
- 33.Krssak MFPK, Dresner A, DiPietro L, Vogel SM, Rothman DL, Shulman GI, Roden M. Intramyocellular lipid concentrations are correlated with insulin sensitivity in humans: a 1H NMR spectroscopy study. Diabetologia. 1999;42(1):113–116. doi: 10.1007/s001250051123. [DOI] [PubMed] [Google Scholar]
- 34.Costa CCG, De Almeida IT, Jakobs C, et al. Dynamic changes of plasma acylcarnitine levels induced by fasting and sunflower oil challenge test in children. Pediatric res. 1999;46(4):440–444. doi: 10.1203/00006450-199910000-00013. [DOI] [PubMed] [Google Scholar]
- 35.DeLany JP, Windhauser MM, Champagne CM, et al. Differential oxidation of individual dietary fatty acids in humans. Am J Clin Nutr. 2000;72:905–911. doi: 10.1093/ajcn/72.4.905. [DOI] [PubMed] [Google Scholar]
- 36.Jones AE, Stolinski M, Smith RD, et al. Effect of fatty acid chain length and saturation on the gastrointestinal handling and metabolic disposal of dietary fatty acids in women. Br J Nutr. 1999;81:37–43. [PubMed] [Google Scholar]
- 37.Bessesen DH, Vensor SH, Jackman MR. Trafficking of dietary oleic, linolenic, and stearic acids in fasted or fed lean rats. Am J Physiol. 2000;278(6):E1124–E1132. doi: 10.1152/ajpendo.2000.278.6.E1124. [DOI] [PubMed] [Google Scholar]
- 38.Bell JA, Reed MA, Consitt LA, et al. Lipid partitioning, incomplete fatty acid oxidation, and insulin signal transduction in primary human muscle cells: effects of severe obesity, fatty acid incubation, and fatty acid translocase/CD36 overexpression. J Clin Endocrinol Metab. 2010;95(7):3400–3410. doi: 10.1210/jc.2009-1596. [DOI] [PMC free article] [PubMed] [Google Scholar]
- 39.Koves TR, Ussher JR, Noland RC, et al. Mitochondrial overload and incomplete fatty acid oxidation contribute to skeletal muscle insulin resistance. Cell Metab. 2008;7:45–56. doi: 10.1016/j.cmet.2007.10.013. [DOI] [PubMed] [Google Scholar]
- 40.Janssen I, Heymsfield SB, Wang ZM, et al. Skeletal muscle mass and distribution in 468 men and women aged 18–88 yr. J Appl Physiol. 2000;89(1):81–88. doi: 10.1152/jappl.2000.89.1.81. [DOI] [PubMed] [Google Scholar]
- 41.Schutte JE, Townsend EJ, Hugg J, et al. Density of lean body mass is greater in blacks than in whites. J Appl Physiol. 1984;56(6):1647–1649. doi: 10.1152/jappl.1984.56.6.1647. [DOI] [PubMed] [Google Scholar]
- 42.Forbes GB, Welle SL. Lean body mass in obesity. Int J Obes. 1983;7(2):99–107. [PubMed] [Google Scholar]
Associated Data
This section collects any data citations, data availability statements, or supplementary materials included in this article.