Human epidermal growth factor receptor 2–negative and hormone receptor–positive cancers and lesions manifesting as areas of nonmasslike enhancements are more likely to show residual disease as small foci or scattered cells after neoadjuvant chemotherapy, leading to underestimation of residual disease extent at MR imaging.
Abstract
Purpose:
To assess how the molecular biomarker status of a breast cancer, including human epidermal growth factor receptor 2 (HER2), hormone receptors, and the proliferation marker Ki-67 status, affects the diagnosis at 3.0-T magnetic resonance (MR) imaging.
Materials and Methods:
This study was approved by the institutional review board and was HIPAA compliant. Fifty patients (age range, 28–82 years; mean age, 49 years) receiving neoadjuvant chemotherapy were monitored with 3.0-T MR imaging. The longest dimension of the residual cancer was measured at MR imaging and correlated with pathologic findings. Patients were further divided into subgroups on the basis of HER2, hormone receptor, and Ki-67 status. Pathologic complete response (pCR) was defined as when there were no residual invasive cancer cells. The Pearson correlation was used to correlate MR imaging–determined and pathologic tumor size, and the unpaired t test was used to compare MR imaging–pathologic size discrepancies.
Results:
Of the 50 women, 14 achieved pCR. There were seven false-negative diagnoses at MR imaging. The overall sensitivity, specificity, and accuracy for diagnosing invasive residual disease at MR imaging were 81%, 93%, and 84%, respectively. The mean MR imaging–pathologic size discrepancy was 0.5 cm ± 0.9 (standard deviation) for HER2-positive cancer and 2.3 cm ± 3.5 for HER2-negative cancer (P = .009). In the HER2-negative group, the size discrepancy was smaller for hormone receptor–negative than for hormone receptor–positive cancers (1.0 cm ± 1.1 vs 3.0 cm ± 4.0, P = .04). The size discrepancy was smaller in patients with 40% or greater Ki-67 expression (0.8 cm ± 1.1) than in patients with 10% or less Ki-67 expression (3.9 cm ± 5.1, P = .06).
Conclusion:
The diagnostic accuracy of breast MR imaging is better in more aggressive than in less aggressive cancers. When MR imaging is used for surgical planning, caution should be taken with HER2-negative hormone receptor–positive cancers.
© RSNA, 2011
Supplemental material: http://radiology.rsna.org/lookup/suppl/doi:10.1148/radiol.11110814/-/DC1
Introduction
Neoadjuvant chemotherapy (NAC) is the standard-of-care treatment for locally advanced inoperable breast cancer, but it is increasingly being used for patients with operable cancer (1,2). It has been established that when patients can achieve pathologic complete response (pCR) or have a minimal residual tumor burden after NAC, they will have a favorable prognosis (3–5). With the availability of more effective chemotherapy regimens and targeted therapies, the current goal of NAC is to achieve pCR. For patients undergoing NAC, imaging assessment of response may aid in the selection of drug regimens, and information about the residual tumor may help in surgical planning.
Of all breast imaging modalities, magnetic resonance (MR) imaging is considered to be the best tool for evaluating the extent of residual tumor after NAC. The performance of MR imaging has been shown to be better than that of clinical examination, mammography, and ultrasonography (6–12). Results of evaluation of NAC response at 1.5 T have been reported before (13,14) and showed a high false-negative diagnosis rate when the residual tumor manifested as a scattered pattern with multiple small foci of invasive cancer cells distributed in a large area. On the basis of this finding, one question that arises is whether improving spatial resolution can enhance diagnostic accuracy for these scattered residual diseases.
There is increasing clinical use of 3.0-T MR imaging systems. The higher field strength provides a higher signal-to-noise ratio and spatial resolution (15), and these may help improve diagnostic accuracy for small lesions compared with 1.5 T (16). However, the higher field strength also comes with greater field inhomogeneity, stronger susceptibility effects, longer T1 relaxation times, larger chemical shift, and higher radiofrequency deposition (17,18), which may cause lower signal in some parts of the image and show less contrast enhancement, which in turn may lead to false-negative diagnoses (19–21). With all these concerns, clinical breast MR imaging is recommended to be performed at 1.5 T. The purpose of our study was to investigate the performance of 3.0-T MR imaging for assessing NAC response in patients with breast cancer and to assess how the molecular biomarker status of the breast cancer, including human epidermal growth factor receptor 2 (HER2), hormone receptor, and the proliferation marker Ki-67 status, affects the MR diagnosis.
Materials and Methods
Patients
This study was approved by the institutional review board of the University of California at Irvine and complied with the Health Insurance Portability and Accountability Act. Between November 2006 and October 2010, 70 patients with biopsy-proven breast cancer gave written informed consent to participate in the NAC treatment study and undergo MR imaging for response monitoring. We included patients who underwent the last MR imaging study after completing NAC treatment and who underwent definitive surgery after MR imaging. Twenty patients were excluded from the analysis for the following reasons: 12 patients did not undergo the last MR imaging examination after completing NAC, seven did not undergo surgery, and one did not have complete information regarding the pathologic evaluation of the extent of the residual disease. Of the remaining 50 patients (age range, 28–82 years; mean age, 49 years), the histologic tumor types were as follows: 44 invasive ductal carcinomas, five invasive lobular carcinomas, and one invasive ductal carcinoma with squamous differentiation (Table). Thirty-five patients had mass lesions, and 15 had lesions that manifested as areas of nonmasslike enhancement. The pretreatment tumor size ranged from 1.7 to 11.8 cm (mean, 4.5 cm; median, 3.7 cm).
Clinical and Pathologic Information in 50 Study Patients
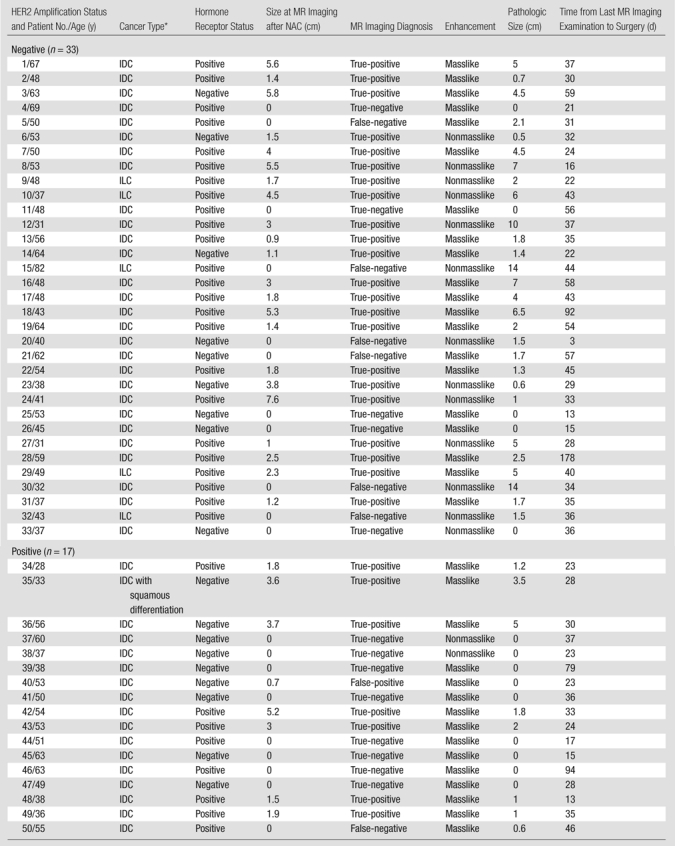
IDC = invasive ductal carcinoma, ILC = invasive lobular carcinoma.
NAC Regimen and MR Imaging Monitoring Schedule
Sixteen patients received two cycles of doxorubicin (Adriamycin) with cyclophosphamide (Cytoxan) given biweekly, followed by 12 weeks of a taxane-based regimen, and 34 patients received only the taxane-based regimen. The taxane-based regimen included weekly paclitaxel (Taxol) and carboplatin (Paraplatin), in combination with weekly trastuzumab (Herceptin; Genentech-Roche, South San Francisco, Calif) for patients with HER2-positive disease or biweekly bevacizumab (Avastin; Genentech-Roche) for patients with HER2-negative disease.
All patients underwent pretreatment baseline MR imaging, several follow-up studies during the course of therapy, and a final MR imaging examination after completing the NAC protocol. After NAC, definitive surgery was performed. The time interval between the last MR imaging examination and the surgery ranged from 3 to 178 days, with a mean of 38.5 days (Table).
MR Imaging
All MR imaging examinations were performed by using a dedicated sensitivity-encoding–enabled bilateral four-channel breast coil with a 3.0-T system (Achieva; Philips Medical Systems, Best, the Netherlands). Dynamic contrast material–enhanced MR imaging was performed by using a three-dimensional gradient-echo fat-suppressed sequence in an axial view to cover both breasts. The parameters were as follows: field of view, 31–36 cm; section thickness, 1 mm; image matrix, 480 × 480; repetition time msec/echo time msec, 6.2/1.26; flip angle, 12°; number of signals acquired, one; and sensitivity-encoding factor, two. For dynamic imaging, two precontrast and five postcontrast frames were acquired. The temporal resolution was 1 minute 38 seconds for each frame. The contrast agent (gadodiamide [Omniscan; GE Healthcare, Princeton, NJ], 0.1 mmol per kilogram of body weight) was manually injected at the beginning of the third acquisition, and the injection was timed to finish in 12 seconds to make the bolus length consistent for all patients. Immediately after contrast medium administration, 10 mL of saline was injected to flush the contrast medium.
MR Image Interpretation
Tumor response was evaluated at the final MR imaging examination after the completion of NAC. Subtraction images were generated by subtracting the precontrast images from the postcontrast images, and maximum intensity projections were generated for reference. The subtraction images were also color coded to allow comparison of the degree of enhancement between tissues within the previous tumor bed and the surrounding normal tissues. When the enhancement was too low to be visible on maximum intensity projections, the corresponding color-enhanced subtraction images were used to determine the existence of residual tumor and the tumor size (Figs 1 and 2; Figs E1 and E2 [online]). One radiologist (S. B., with 6 years of experience in interpreting breast MR images) performed the size measurement without knowledge of the pathologic results. The longest dimensions of the residual disease measured at MR imaging and at pathologic examination were correlated. Complete clinical response was diagnosed when no enhancement or faint enhancement in the previous lesion site equal to that of the background normal breast tissue was noted.
Figure 1a:
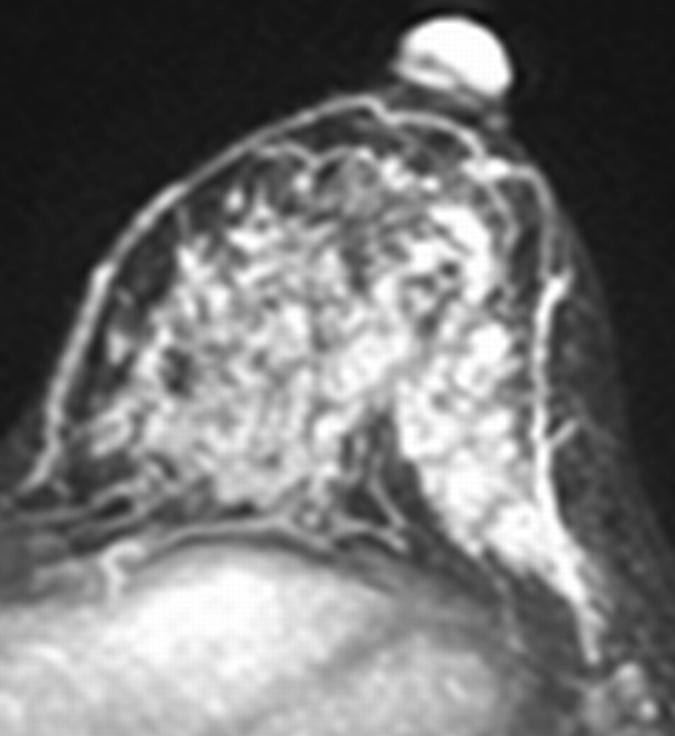
Axial (a–c) maximal intensity projection and (d–f) original subtraction MR images in 37-year-old woman with HER2-positive hormone receptor–negative cancer in left breast. (a, d) Baseline images obtained before NAC show approximately 8-cm lesion with diffuse, nonmasslike enhancement. On (b, e) images obtained during NAC, the tumor is reduced to a small area of faint enhancement, and on (c, f) images obtained after NAC, the tumor is barely visible. Clinical complete response was diagnosed on the basis of MR imaging findings. Final pathologic examination showed pCR.
Figure 2a:
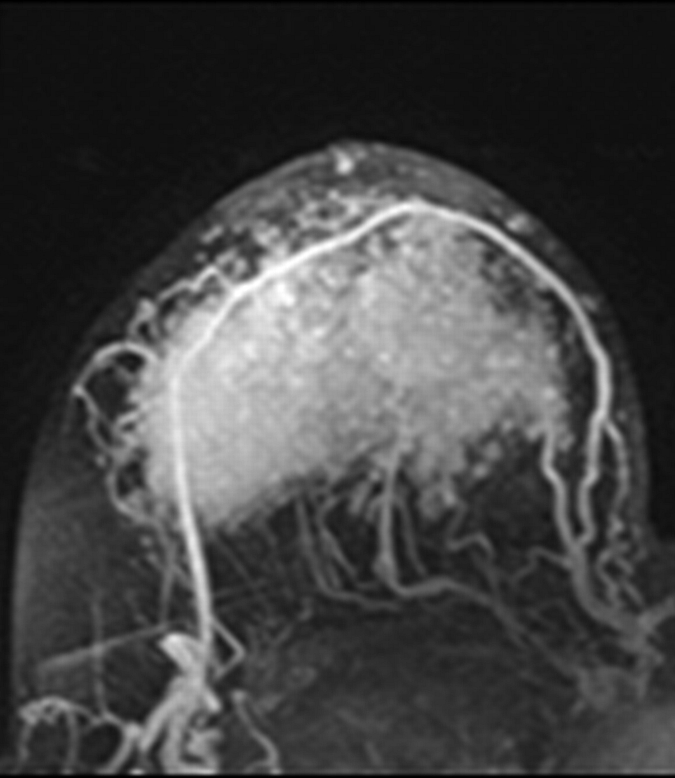
Axial (a–c) maximal intensity projection and (d–f) original subtraction MR images in 32-year-old woman with HER2-negative hormone receptor–positive Ki-67 20% breast cancer in right breast. On (a, d) baseline images obtained before NAC, the tumor appears as a 9.8-cm lesion with diffuse, nonmasslike enhancement. On (b, e) images obtained during NAC, the tumor is reduced to 5.6 cm, and on (c, f) images obtained after NAC, the tumor is reduced to 3 cm. Pathologic examination showed scattered cancer nests in a 10-cm area.
Figure 1b:
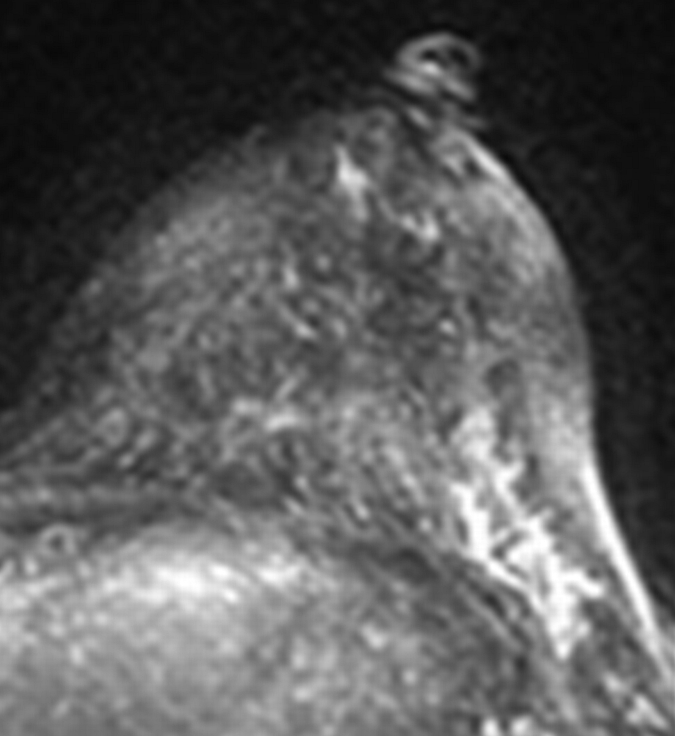
Axial (a–c) maximal intensity projection and (d–f) original subtraction MR images in 37-year-old woman with HER2-positive hormone receptor–negative cancer in left breast. (a, d) Baseline images obtained before NAC show approximately 8-cm lesion with diffuse, nonmasslike enhancement. On (b, e) images obtained during NAC, the tumor is reduced to a small area of faint enhancement, and on (c, f) images obtained after NAC, the tumor is barely visible. Clinical complete response was diagnosed on the basis of MR imaging findings. Final pathologic examination showed pCR.
Figure 1c:
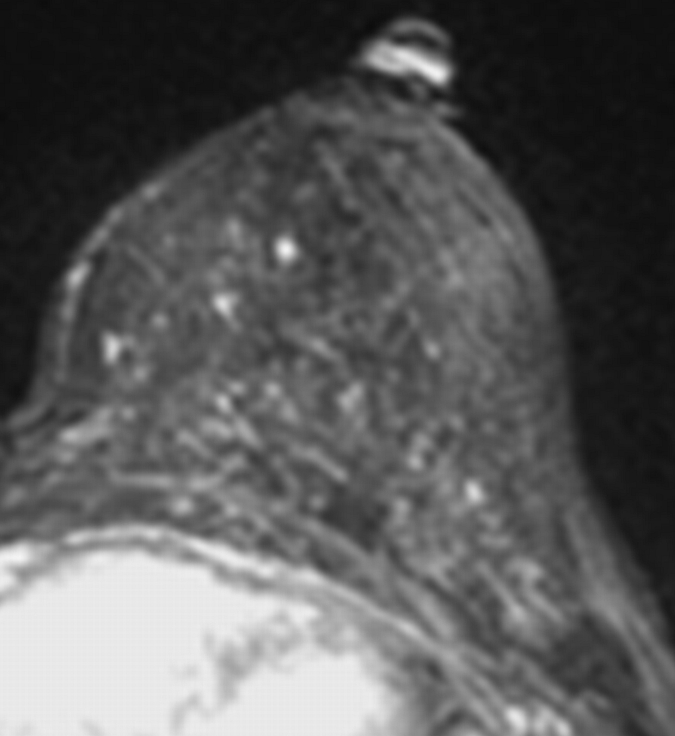
Axial (a–c) maximal intensity projection and (d–f) original subtraction MR images in 37-year-old woman with HER2-positive hormone receptor–negative cancer in left breast. (a, d) Baseline images obtained before NAC show approximately 8-cm lesion with diffuse, nonmasslike enhancement. On (b, e) images obtained during NAC, the tumor is reduced to a small area of faint enhancement, and on (c, f) images obtained after NAC, the tumor is barely visible. Clinical complete response was diagnosed on the basis of MR imaging findings. Final pathologic examination showed pCR.
Figure 1d:
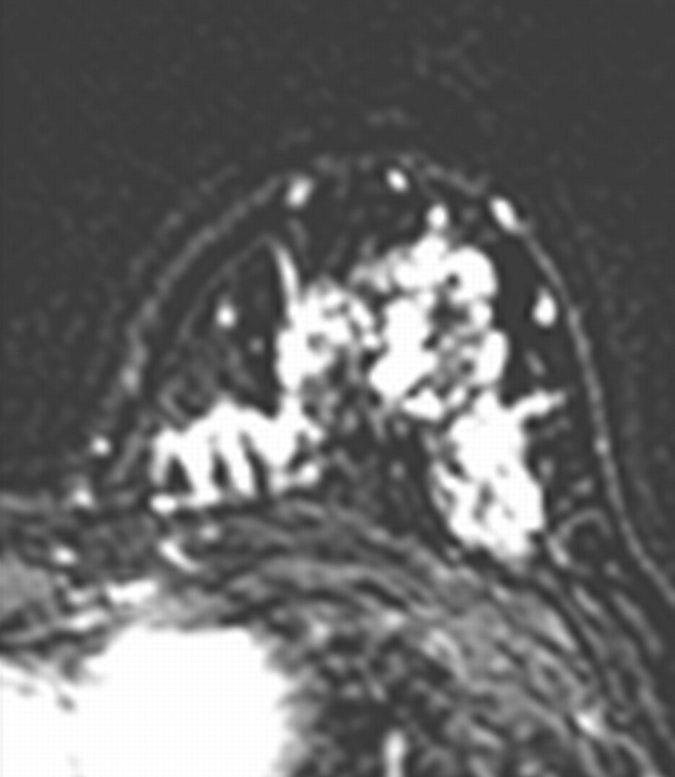
Axial (a–c) maximal intensity projection and (d–f) original subtraction MR images in 37-year-old woman with HER2-positive hormone receptor–negative cancer in left breast. (a, d) Baseline images obtained before NAC show approximately 8-cm lesion with diffuse, nonmasslike enhancement. On (b, e) images obtained during NAC, the tumor is reduced to a small area of faint enhancement, and on (c, f) images obtained after NAC, the tumor is barely visible. Clinical complete response was diagnosed on the basis of MR imaging findings. Final pathologic examination showed pCR.
Figure 1e:
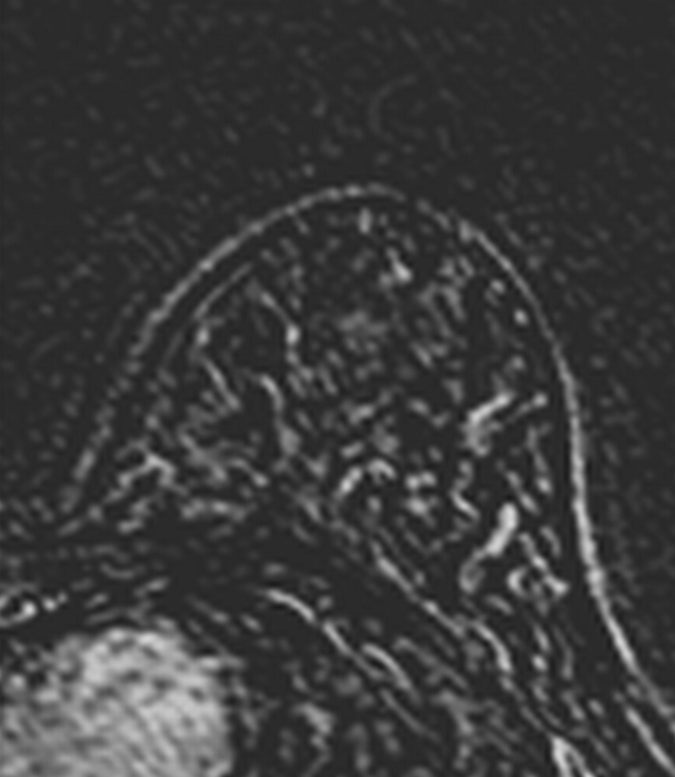
Axial (a–c) maximal intensity projection and (d–f) original subtraction MR images in 37-year-old woman with HER2-positive hormone receptor–negative cancer in left breast. (a, d) Baseline images obtained before NAC show approximately 8-cm lesion with diffuse, nonmasslike enhancement. On (b, e) images obtained during NAC, the tumor is reduced to a small area of faint enhancement, and on (c, f) images obtained after NAC, the tumor is barely visible. Clinical complete response was diagnosed on the basis of MR imaging findings. Final pathologic examination showed pCR.
Figure 1f:
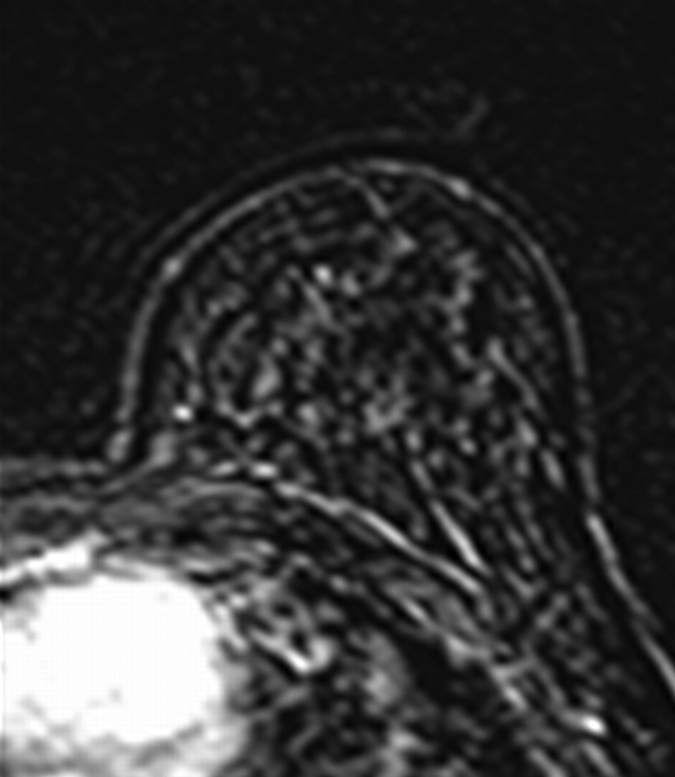
Axial (a–c) maximal intensity projection and (d–f) original subtraction MR images in 37-year-old woman with HER2-positive hormone receptor–negative cancer in left breast. (a, d) Baseline images obtained before NAC show approximately 8-cm lesion with diffuse, nonmasslike enhancement. On (b, e) images obtained during NAC, the tumor is reduced to a small area of faint enhancement, and on (c, f) images obtained after NAC, the tumor is barely visible. Clinical complete response was diagnosed on the basis of MR imaging findings. Final pathologic examination showed pCR.
Figure 2b:
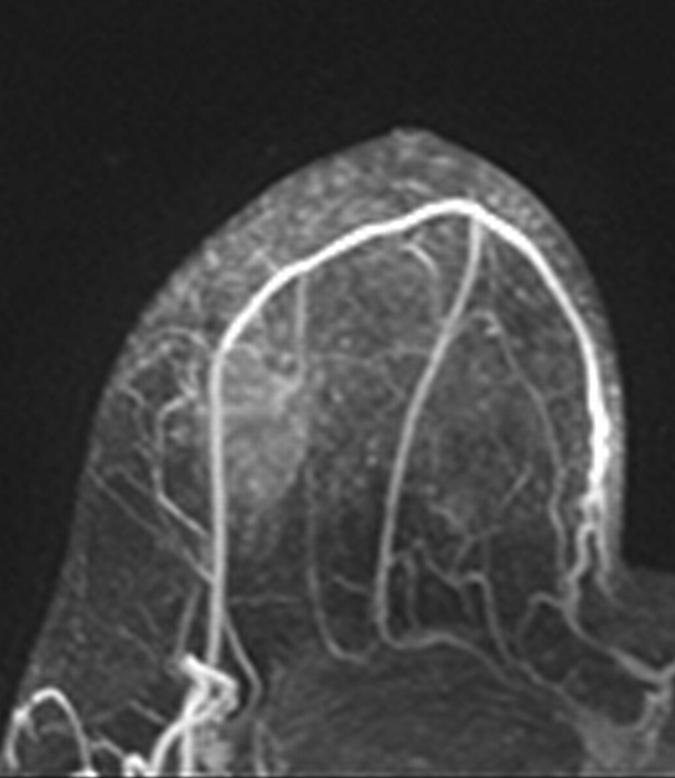
Axial (a–c) maximal intensity projection and (d–f) original subtraction MR images in 32-year-old woman with HER2-negative hormone receptor–positive Ki-67 20% breast cancer in right breast. On (a, d) baseline images obtained before NAC, the tumor appears as a 9.8-cm lesion with diffuse, nonmasslike enhancement. On (b, e) images obtained during NAC, the tumor is reduced to 5.6 cm, and on (c, f) images obtained after NAC, the tumor is reduced to 3 cm. Pathologic examination showed scattered cancer nests in a 10-cm area.
Figure 2c:
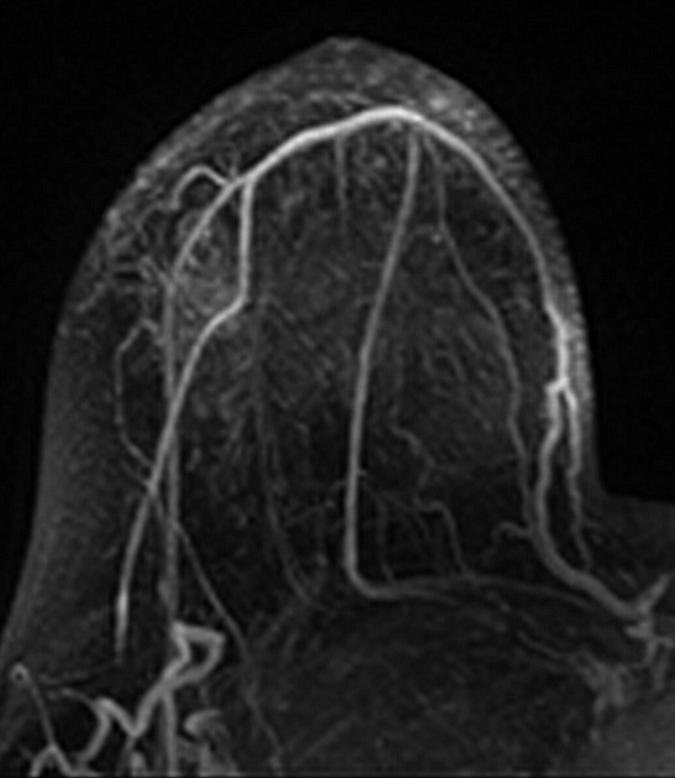
Axial (a–c) maximal intensity projection and (d–f) original subtraction MR images in 32-year-old woman with HER2-negative hormone receptor–positive Ki-67 20% breast cancer in right breast. On (a, d) baseline images obtained before NAC, the tumor appears as a 9.8-cm lesion with diffuse, nonmasslike enhancement. On (b, e) images obtained during NAC, the tumor is reduced to 5.6 cm, and on (c, f) images obtained after NAC, the tumor is reduced to 3 cm. Pathologic examination showed scattered cancer nests in a 10-cm area.
Figure 2d:
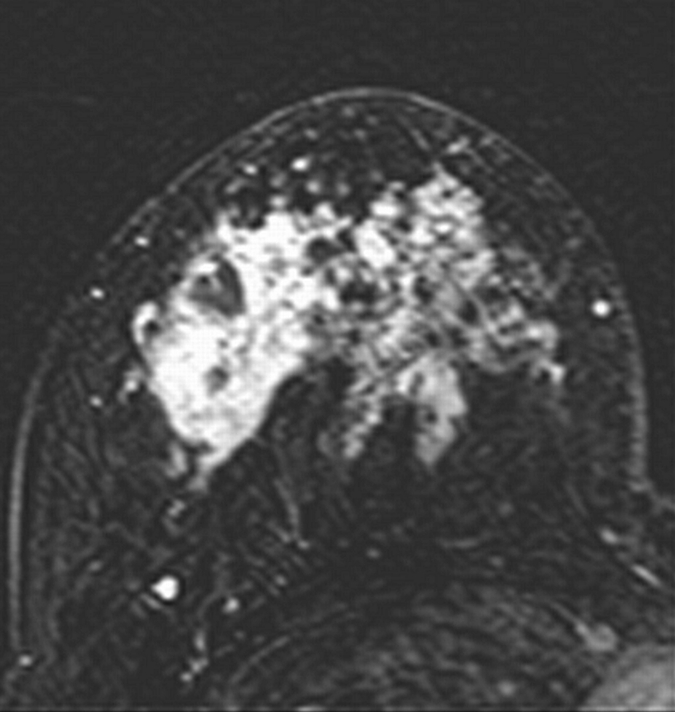
Axial (a–c) maximal intensity projection and (d–f) original subtraction MR images in 32-year-old woman with HER2-negative hormone receptor–positive Ki-67 20% breast cancer in right breast. On (a, d) baseline images obtained before NAC, the tumor appears as a 9.8-cm lesion with diffuse, nonmasslike enhancement. On (b, e) images obtained during NAC, the tumor is reduced to 5.6 cm, and on (c, f) images obtained after NAC, the tumor is reduced to 3 cm. Pathologic examination showed scattered cancer nests in a 10-cm area.
Figure 2e:
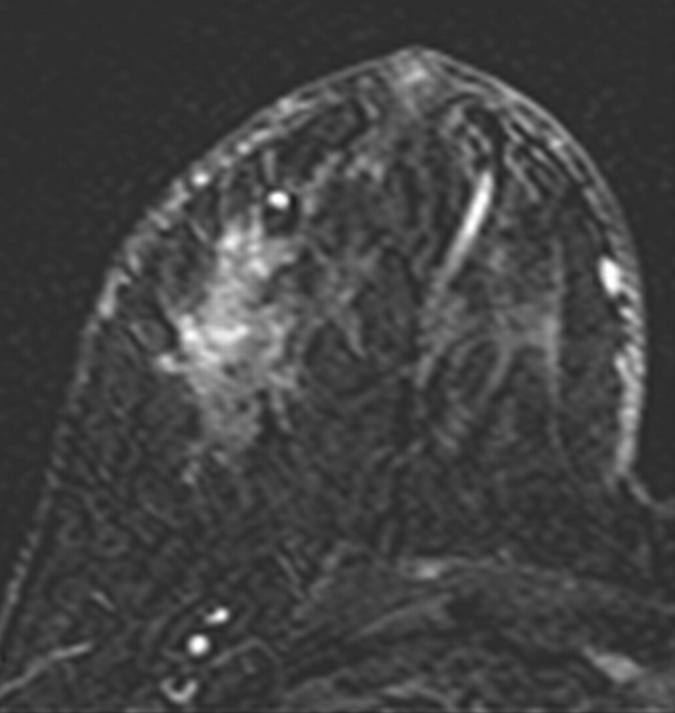
Axial (a–c) maximal intensity projection and (d–f) original subtraction MR images in 32-year-old woman with HER2-negative hormone receptor–positive Ki-67 20% breast cancer in right breast. On (a, d) baseline images obtained before NAC, the tumor appears as a 9.8-cm lesion with diffuse, nonmasslike enhancement. On (b, e) images obtained during NAC, the tumor is reduced to 5.6 cm, and on (c, f) images obtained after NAC, the tumor is reduced to 3 cm. Pathologic examination showed scattered cancer nests in a 10-cm area.
Figure 2f:
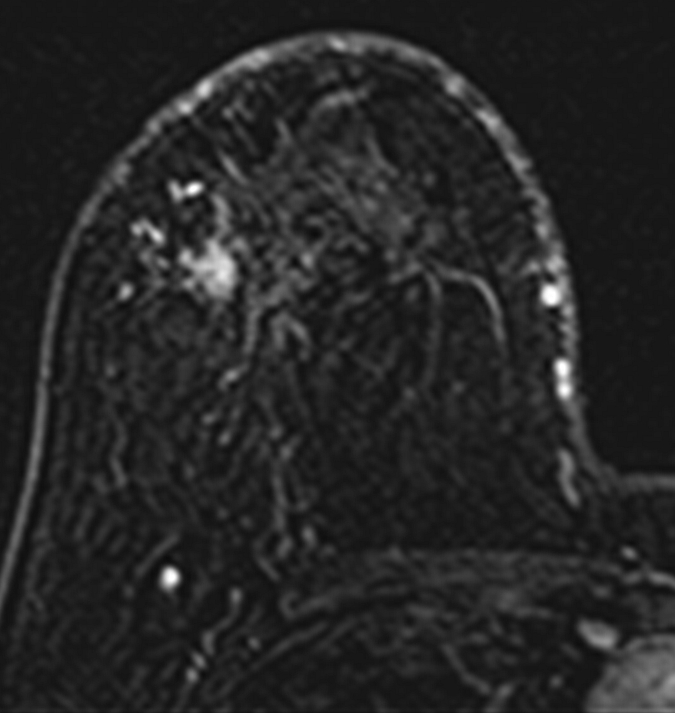
Axial (a–c) maximal intensity projection and (d–f) original subtraction MR images in 32-year-old woman with HER2-negative hormone receptor–positive Ki-67 20% breast cancer in right breast. On (a, d) baseline images obtained before NAC, the tumor appears as a 9.8-cm lesion with diffuse, nonmasslike enhancement. On (b, e) images obtained during NAC, the tumor is reduced to 5.6 cm, and on (c, f) images obtained after NAC, the tumor is reduced to 3 cm. Pathologic examination showed scattered cancer nests in a 10-cm area.
Pathologic Examination
Surgical specimens were fixed in 10% neutral-buffered formalin and were processed for histologic examination. A pathologist (P.M.C., with 20 years of experience) measured the residual tumor size at pathologic examination. In evaluating the residual lesion at pathologic examination, if no gross tumor was found, the original location of the tumor in the breast was identified, and slides from the block containing the tumor, as well from as adjacent blocks, were examined. For tumors that were smaller than 2 cm or not grossly visible, tumor size was determined on the basis of the microscopic measurement on the slides. For tumors that were 2 cm or larger and clearly visualized in the gross specimens, only gross measurement of the residual tumor size was made. Residual disease after NAC was categorized as (a) showing no residual cancer cells; (b) showing no residual invasive cancer but showing ductal carcinoma in situ, and (c) showing residual invasive cancer. pCR was defined as when there was no invasive cancer, thus including categories 1 and 2 (22).
Determination of Biomarker Expression
Biomarker status was determined by pathologists at our institution (including P.M.C.). The status of estrogen receptor and progesterone receptor was considered negative if immunoperoxidase staining of tumor cell nuclei in the biopsy specimen was less than 5%. Ki-67 staining was evaluated as percentage of nuclei showing a positive reaction. HER2 expression was evaluated by using fluorescence in situ hybridization. A tumor was designated as positive for gene amplification if the gene-to-chromosome ratio was greater than 2.0.
Statistical Analysis
Pearson correlation was used for comparing MR imaging–determined residual tumor size and pathologic size in the whole group. For each patient, the size discrepancy measured between MR imaging and pathologic examination was calculated. To eliminate the impact of outliers, the four patients with tumor size discrepancies greater than 5 cm were excluded, and another Pearson correlation comparing MR imaging versus pathologic size was performed. The unpaired t test with the Welch correction was used to compare the size discrepancy between patients with HER2-positive and those with HER2-negative disease, between patients with HER2-negative hormone receptor–positive disease and those with HER2-negative hormone receptor–negative disease, and between patients receiving doxorubicin with cyclophosphamide and taxane and those receiving taxane alone. The F-test was used to compare variance between the above groups. P < .05 was considered to indicate a significant difference. Statistical analysis was performed by using software (GraphPad Prism, version 5.0; GraphPad Software, La Jolla, Calif).
Results
Biomarker Status
Of the 50 patients, 17 had HER2-positive disease and 33 had HER2-negative disease. Of the 33 patients with HER2-negative disease, 24 had hormone receptor–positive cancer and nine had triple-negative cancer (ie, cancer with negative estrogen receptor, progesterone receptor, and HER2 status [Table]).
Diagnostic Accuracy of MR Imaging for Predicting pCR
Fourteen of the 50 patients achieved pCR after NAC, and 36 patients had residual tumor at pathologic examination. Of the 14 patients who achieved pCR, nine had HER2-positive cancer (nine [53%] of 17), three had triple-negative cancer (three [33%] of nine), and two had HER2-negative and hormone receptor–positive cancer (two [8%] of 24). MR imaging depicted residual tumors in 30 patients and helped diagnose clinical complete response in 20 patients. When we correlated MR imaging and pathologic findings, MR imaging findings were used to accurately diagnose pCR in 13 patients (true-negative [). One false-positive diagnosis was noted. In this case, pathologic examination showed only ductal carcinoma in situ without invasive cancer cells; the patient thus was categorized as showing pCR. There were seven false-negative diagnoses with no visible tumor at MR imaging but with residual invasive cancer at pathologic examination; all of these cases showed scattered small cancer foci at pathologic examination. Of these seven cases, six (18%) of 33 were HER2-negative and one (6%) of 17 was HER2-positive; three were mass lesions and four showed nonmasslike enhancement. MR imaging enabled 29 true-positive diagnoses, with residual tumor detected at both MR imaging and pathologic examination. Overall, the MR imaging diagnostic rates for post-NAC invasive residual disease were as follows: accuracy, 84%; sensitivity, 81%; specificity, 93%; positive prediction rate, 97%; and negative prediction rate, 65%. MR imaging accuracy was higher for HER2-positive cancer than for HER2-negative cancer (88% vs 82%).
Correlation of Residual Tumor Size at MR Imaging versus That at Pathologic Examination
Overall, tumor size determined at MR imaging and that determined at surgical pathologic examination had a weak correlation (Pearson r = 0.30, P = .03). There were four cases with a tumor size discrepancy larger than 5 cm (6.6, 7.0, 13.5, and 14.0 cm), and all were HER2-negative nonmasslike lesions (Fig 2). When these four cases were excluded, the size correlation increased remarkably (r = 0.76, P < .001). When we considered only the HER2-positive tumors (n = 17), the MR imaging and pathologic tumor size were highly correlated (r = 0.82 and P < .0001). The mean size discrepancy in HER2-positive tumors was 0.5 cm ± 0.9 (standard deviation), which was significantly smaller than the mean discrepancy of 2.3 ± 3.5 cm in HER2-negative tumors (t = 2.8, t-critical = 2.0, P = .009). In patients with HER2-negative disease, the MR imaging and pathologic size discrepancy was compared between hormone receptor–positive (n = 24) and hormone receptor–negative (triple-negative cancer, n = 9) tumors. The mean size discrepancy was 1.0 cm ± 1.1 in hormone receptor–negative tumor (Fig E1 [online]), which was significantly smaller than the 3.0 cm ± 4.0 in hormone receptor–positive tumors (Fig E2 [online]) (P = .04).
The tumor size discrepancy measured at MR imaging and pathologic examination was correlated with the Ki-67 value. The four cases showing greater than 5 cm discrepancy fell within the low Ki-67 range, one with 0%, two with 10%, and another with 20% staining. The average size discrepancy in the group of 12 cases with Ki-67 staining of 10% or less was 3.9 cm ± 5.1, which was greater than the 0.8 cm ± 1.1 in the group of 10 cases with Ki-67 staining of 40% or greater (P = .06).
The MR imaging diagnoses were compared between patients receiving adriamycin with cyclophosphamide and taxane and patients receiving taxane alone, and the mean tumor size discrepancy was 1.6 cm ± 3.5 versus 1.8 cm ± 2.8 (P = .72).
Discussion
NAC can induce tumor shrinkage, improve operability, and increase the rate of breast-conserving surgery (23). However, how to perform a successful breast-conservation surgery after NAC is challenging. It is difficult to determine how much tissue should be removed, especially in patients who responded well to the treatment. Of the 607 patients studied in the German Preoperative Adriamycin Docetaxel trial of the German Adjuvant Breast Cancer Group (24), more than 70% patients were treated with breast conservation, but 21.1% of these patients required reexcision. It was concluded that for surgical planning, tumor characteristics and response to NAC should be taken into account. Improved knowledge about the detection accuracy of residual disease after NAC at imaging may help the planning of an optimal surgery to achieve a tumor-free margin (24). This is important because cases requiring reexcision tend to have a higher local recurrence rate (25).
There is limited data reporting the clinical role of NAC response evaluation with 3.0-T MR imaging. In our study, we found seven false-negative cases (14%) among our 50 cases. In all of these seven cases, residual lesions appeared as scattered small tumor foci. In a previous study of 51 patients performed at 1.5 T (14), we used a much lower spatial resolution (1.4 × 2.8-mm in plane and 4-mm thickness compared with 0.8 × 0.8-mm in-plane and 2-mm thickness in this study) and found nine false-negative cases (18%) among 51 cases. Similarly, all of the nine false-negative cases in the current study manifested residual disease as scattered cancer cells or foci smaller than 2 mm. Therefore, the higher spatial resolution used at 3.0 T did not substantially decrease the percentage of false-negative cases, and the results suggest that scattered residual cells or foci smaller than 2 mm are beyond the capability of MR imaging to depict. Another possible reason to explain the comparable performance is the decreased contrast enhancement at 3.0-T compared with that at 1.5 T (19). The T1 relaxation time is known to increase with field strength, and the T1 of the breast glandular tissue is increased by 17% at 3.0-T compared with 1.5 T (15). This would reduce the signal intensity and the contrast enhancement (26,27) and diminish the signal-to-noise ratio gain at 3.0 T (28,29). In the present study, we used the same contrast medium (gadodiamide) with the same standard clinical dose and the same injection method compared with the previous 1.5 T studies (13,14), so the results could be directly compared.
The limitation of MR imaging in depicting scattered residual disease is the major reason for the false-negative diagnoses. Also, this limitation is the source of high discrepancy in the tumor size measured at MR imaging and that measured at pathologic examination. After excluding four outliers with MR imaging–pathologic size discrepancy greater than 5 cm, the correlation increased substantially (from r = 0.30 to r = 0.76). A previous study (13) has shown that size measured at MR imaging is highly accurate for mass lesions that shrink down to nodules but not as accurate for nonmass lesions that break into scattered cells and clusters. In our study, we also found that the large size discrepancies greater than 5 cm between MR imaging and pathologic examination all came from nonmass lesions. Another study (30) also indicated that the accuracy of MR imaging tumor size measurement is influenced by histologic regression induced by NAC. NAC results in specific morphologic changes in both the cellular and the stromal components of the tumor. The characteristic fibrous replacement, showing multifocal small tumor foci surrounded by abundant fibrosis, is an indicator of histologic regression (30–32). Since MR imaging relies on contrast enhancement to depict residual disease, it may not depict small foci or scattered cancer cells or clusters that need little vascular supply to survive.
The limitation of MR imaging in detecting the minimal residual disease may impact surgical management. Residual tumor with minimal cellularity (<5% of tumor area composed of invasive tumor cells) may be associated with an increased risk of positive surgical margins. In a study of 149 patients who underwent breast-conserving surgery (33), positive margins were found in 23% of specimens with minimal cellularity and in 13.8% of specimens with higher residual cellularity. Since a positive margin is associated with an increased risk of local recurrence, breast-conserving surgery in these patients might be inadvisable (34). As the combination of various chemotherapy regimens and targeted therapies become more effective, it is expected that more tumors will respond to NAC and manifest minimal residual cellularity. This type of disease is challenging for surgeons to resect residual tumors with clean margins. Despite the higher sensitivity of MR imaging compared with other conventional imaging modalities, mixed fibrosis and scattered cancer cells would limit its ability in measuring the tumor extent accurately (35). More research to investigate the accuracy of MR imaging in tumors of different phenotypes (eg, mass vs nonmass) and different biomarker statuses would help surgeons to use the information provided by MR imaging for guiding surgery.
Our results indicate that the diagnostic accuracy of MR imaging is better in HER2-positive than in HER2-negative cancers, with a size discrepancy of 0.5 cm ± 0.9 versus 2.3 cm ± 3.5 (P = .009). Since the targeted therapy trastuzumab is available for HER2-positive cancer, the treatment is very effective and more likely to eliminate the scattered residual cancer cells, leading to a higher negative predictive value of MR imaging (13). Although patients with HER2-negative disease receive bevacizumab, it is not directly targeting the cancer cells. In our previous study of 17 patients with HER2-negative disease who were receiving bevacizumab (13), the pCR rate was not better than that in another group of 20 patients with HER2-negative disease who were not receiving bevacizumab. In our study we found that in HER2-negative patients, the diagnostic accuracy of MR imaging is better in hormone receptor–negative (triple-negative) cancer than in hormone receptor–positive cancer, with size a discrepancy of 1.0 cm ± 1.1 versus 3.0 cm ± 4.0 (P = .04). These results suggest that patients with HER2-negative hormone receptor–positive disease are the poorest candidates for MR imaging evaluation. Triple-negative tumors are known to respond well to paclitaxel and carboplatin and are likely to achieve a high pCR rate (36). Similar to the comparison between HER2-positive and HER2-negative tumors, triple-negative tumors are more likely to achieve complete response than HER2-negative hormone receptor–positive tumors, and that makes the diagnostic accuracy of MR imaging better.
We also evaluated the impact of the proliferation marker Ki-67 on the diagnostic performance of MR imaging. Overall, there was a trend of smaller MR imaging size discrepancy with the increasing of Ki-67 values. However, owing to the small number of cases, the trend did not reach the significance level. All four cases with size discrepancies greater than 5 cm fell within the low Ki-67 range (≤20%).
In conclusion, breast MR imaging performed at 3.0 T still has the same limitation compared with 1.5 T for the detection of small tumor foci and scattered tumor cell clusters after NAC. This limitation is more likely due to the low contrast enhancement, because this type of residual disease does not need a strong vascular supply to survive, and the detection accuracy of MR imaging may not be improved by using a higher spatial resolution in the imaging protocol. The more aggressive tumors are known to have a better response to chemotherapy, and that would minimize the possibility of a false-negative diagnosis made at MR imaging. HER2-negative and hormone receptor–positive cancers and lesions showing nonmasslike enhancement are more likely to show residual disease as small foci or scattered cells after NAC, leading to underestimation of residual disease extent at MR imaging, and the diagnostic results of MR imaging should be used with caution in surgical planning.
Advances in Knowledge.
• More aggressive breast cancer tumors, such as human epidermal growth factor receptor 2 (HER2)-positive cancer (pathologic complete response [pCR] rate, 53% [nine of 17]) and triple-negative cancer (pCR, 33% [three of nine]), have a better response to neoadjuvant chemotherapy (NAC) than HER2-negative and hormone receptor–positive cancer (pCR, 8% [two of 24]).
• HER2-negative cancers are more likely to show residual disease as small foci or scattered cells after NAC (six [18%] of 33) than HER2-positive cancers (one [6%] of 17), leading to an underestimation of residual disease extent at MR imaging.
• The tumor size discrepancy measured at MR imaging compared with the pathologic size was correlated with Ki-67 proliferation, and there was a trend of smaller discrepancy in tumors with greater Ki-67 expression (mean size, 0.8 cm ± 1.1 for tumors with Ki-67 expression ≥ 40% vs 3.9 cm ± 5.1 for tumors with Ki-67 expression ≤ 10%; P = .06).
• Four lesions had MR imaging–pathologic size discrepancy greater than 5 cm (namely, 6.6, 7.0, 13.5, and 14.0 cm), and all four lesions showed nonmasslike enhancement.
Implication for Patient Care.
• The higher spatial resolution at 3.0-T MR imaging compared with that at 1.5 T did not improve the detection of residual disease manifesting as small tumor foci or scattered cell clusters; when post-NAC diagnostic results of MR imaging are used for surgical planning, caution should be taken with HER2-negative hormone receptor–positive cancers and lesions manifesting as areas of nonmasslike enhancement.
Disclosures of Potential Conflicts of Interest: J.H.C. No potential conflicts of interest to disclose. S.B. No potential conflicts of interest to disclose. R.S.M. No potential conflicts of interest to disclose. A.K. No potential conflicts of interest to disclose. H.J.Y. No potential conflicts of interest to disclose. P.M.C. No potential conflicts of interest to disclose. S.A.F. No potential conflicts of interest to disclose. M.L. No potential conflicts of interest to disclose. D.J.B.H. No potential conflicts of interest to disclose. K.T.L. No potential conflicts of interest to disclose. J.A.B. No potential conflicts of interest to disclose. O.N. No potential conflicts of interest to disclose. M.Y.S. No potential conflicts of interest to disclose.
Supplementary Material
Received April 26, 2011; revision requested June 3; revision received June 14; final version accepted June 22.
Supported in part by the California Breast Cancer Research Program grant #16GB-0056.
Funding: This research was supported by the National Institutes of Health (grant R01 CA127927).
Abbreviations:
- HER2
- human epidermal growth factor receptor 2
- NAC
- neoadjuvant chemotherapy
- pCR
- pathologic complete response
References
- 1.Mieog JS, van der Hage JA, van de Velde CJ. Neoadjuvant chemotherapy for operable breast cancer. Br J Surg 2007;94(10):1189–1200 [DOI] [PubMed] [Google Scholar]
- 2.Kaufmann M, von Minckwitz G, Bear HD, et al. Recommendations from an international expert panel on the use of neoadjuvant (primary) systemic treatment of operable breast cancer: new perspectives 2006. Ann Oncol 2007;18(12):1927–1934 [DOI] [PubMed] [Google Scholar]
- 3.Rastogi P, Anderson SJ, Bear HD, et al. Preoperative chemotherapy: updates of National Surgical Adjuvant Breast and Bowel Project Protocols B-18 and B-27. J Clin Oncol 2008;26(5):778–785 [DOI] [PubMed] [Google Scholar]
- 4.Jeruss JS, Mittendorf EA, Tucker SL, et al. Combined use of clinical and pathologic staging variables to define outcomes for breast cancer patients treated with neoadjuvant therapy. J Clin Oncol 2008;26(2):246–252 [DOI] [PubMed] [Google Scholar]
- 5.Symmans WF, Peintinger F, Hatzis C, et al. Measurement of residual breast cancer burden to predict survival after neoadjuvant chemotherapy. J Clin Oncol 2007;25(28):4414–4422 [DOI] [PubMed] [Google Scholar]
- 6.Balu-Maestro C, Chapellier C, Bleuse A, Chanalet I, Chauvel C, Largillier R. Imaging in evaluation of response to neoadjuvant breast cancer treatment benefits of MRI. Breast Cancer Res Treat 2002;72(2):145–152 [DOI] [PubMed] [Google Scholar]
- 7.Rosen EL, Blackwell KL, Baker JA, et al. Accuracy of MRI in the detection of residual breast cancer after neoadjuvant chemotherapy. AJR Am J Roentgenol 2003;181(5):1275–1282 [DOI] [PubMed] [Google Scholar]
- 8.Londero V, Bazzocchi M, Del Frate C, et al. Locally advanced breast cancer: comparison of mammography, sonography and MR imaging in evaluation of residual disease in women receiving neoadjuvant chemotherapy. Eur Radiol 2004;14(8):1371–1379 [DOI] [PubMed] [Google Scholar]
- 9.Yeh E, Slanetz P, Kopans DB, et al. Prospective comparison of mammography, sonography, and MRI in patients undergoing neoadjuvant chemotherapy for palpable breast cancer. AJR Am J Roentgenol 2005;184(3):868–877 [DOI] [PubMed] [Google Scholar]
- 10.Wasser K, Klein SK, Junkermann H, et al. Neoadjuvant chemotherapy of breast carcinomas: what post-therapeutic (preoperative) information is provided by quantitative dynamic MRI? [in German] Radiologe 2007;47(5):421–429 [DOI] [PubMed] [Google Scholar]
- 11.Bhattacharyya M, Ryan D, Carpenter R, Vinnicombe S, Gallagher CJ. Using MRI to plan breast-conserving surgery following neoadjuvant chemotherapy for early breast cancer. Br J Cancer 2008;98(2):289–293 [DOI] [PMC free article] [PubMed] [Google Scholar]
- 12.Akazawa K, Tamaki Y, Taguchi T, et al. Preoperative evaluation of residual tumor extent by three-dimensional magnetic resonance imaging in breast cancer patients treated with neoadjuvant chemotherapy. Breast J 2006;12(2):130–137 [DOI] [PubMed] [Google Scholar]
- 13.Bahri S, Chen JH, Mehta RS, et al. Residual breast cancer diagnosed by MRI in patients receiving neoadjuvant chemotherapy with and without bevacizumab. Ann Surg Oncol 2009;16(6):1619–1628 [DOI] [PMC free article] [PubMed] [Google Scholar]
- 14.Chen JH, Feig B, Agrawal G, et al. MRI evaluation of pathologically complete response and residual tumors in breast cancer after neoadjuvant chemotherapy. Cancer 2008;112(1):17–26 [DOI] [PubMed] [Google Scholar]
- 15.Rakow-Penner R, Daniel B, Yu H, Sawyer-Glover A, Glover GH. Relaxation times of breast tissue at 1.5T and 3T measured using IDEAL. J Magn Reson Imaging 2006;23(1):87–91 [DOI] [PubMed] [Google Scholar]
- 16.Kuhl CK, Jost P, Morakkabati N, Zivanovic O, Schild HH, Gieseke J. Contrast-enhanced MR imaging of the breast at 3.0 and 1.5 T in the same patients: initial experience. Radiology 2006;239(3):666–676 [DOI] [PubMed] [Google Scholar]
- 17.Norris DG. High field human imaging. J Magn Reson Imaging 2003;18(5):519–529 [DOI] [PubMed] [Google Scholar]
- 18.Morakkabati-Spitz N, Gieseke J, Kuhl C, et al. MRI of the pelvis at 3 T: very high spatial resolution with sensitivity encoding and flip-angle sweep technique in clinically acceptable scan time. Eur Radiol 2006;16(3):634–641 [DOI] [PubMed] [Google Scholar]
- 19.Kuhl CK, Kooijman H, Gieseke J, Schild HH. Effect of B1 inhomogeneity on breast MR imaging at 3.0 T. Radiology 2007;244(3):929–930 [DOI] [PubMed] [Google Scholar]
- 20.Mann RM, Kuhl CK, Kinkel K, Boetes C. Breast MRI: guidelines from the European Society of Breast Imaging. Eur Radiol 2008;18(7):1307–1318 [DOI] [PMC free article] [PubMed] [Google Scholar]
- 21.Azlan CA, Di Giovanni P, Ahearn TS, Semple SI, Gilbert FJ, Redpath TW. B1 transmission-field inhomogeneity and enhancement ratio errors in dynamic contrast-enhanced MRI (DCE-MRI) of the breast at 3T. J Magn Reson Imaging 2010;31(1):234–239 [DOI] [PubMed] [Google Scholar]
- 22.Jones RL, Lakhani SR, Ring AE, Ashley S, Walsh G, Smith IE. Pathological complete response and residual DCIS following neoadjuvant chemotherapy for breast carcinoma. Br J Cancer 2006;94(3):358–362 [DOI] [PMC free article] [PubMed] [Google Scholar]
- 23.van der Hage JA, van de Velde CJ, Julien JP, Tubiana-Hulin M, Vandervelden C, Duchateau L. Preoperative chemotherapy in primary operable breast cancer: results from the European Organization for Research and Treatment of Cancer trial 10902. J Clin Oncol 2001;19(22):4224–4237 [DOI] [PubMed] [Google Scholar]
- 24.Loibl S, von Minckwitz G, Raab G, et al. Surgical procedures after neoadjuvant chemotherapy in operable breast cancer: results of the GEPARDUO trial. Ann Surg Oncol 2006;13(11):1434–1442 [DOI] [PubMed] [Google Scholar]
- 25.Aziz D, Rawlinson E, Narod SA, et al. The role of reexcision for positive margins in optimizing local disease control after breast-conserving surgery for cancer. Breast J 2006;12(4):331–337 [DOI] [PubMed] [Google Scholar]
- 26.Haacke EM, Brown RW, Thompson MR, et al. Magnetic resonance imaging: physical principles and sequence design. New York, NY: Wiley, 1999;1–914 [Google Scholar]
- 27.Bottomley PA, Foster TH, Argersinger RE, Pfeifer LM. A review of normal tissue hydrogen NMR relaxation times and relaxation mechanisms from 1-100 MHz: dependence on tissue type, NMR frequency, temperature, species, excision, and age. Med Phys 1984;11(4):425–448 [DOI] [PubMed] [Google Scholar]
- 28.Jezzard P, Duewell S, Balaban RS. MR relaxation times in human brain: measurement at 4 T. Radiology 1996;199(3):773–779 [DOI] [PubMed] [Google Scholar]
- 29.Crooks LE, Arakawa M, Hoenninger J, McCarten B, Watts J, Kaufman L. Magnetic resonance imaging: effects of magnetic field strength. Radiology 1984;151(1):127–133 [DOI] [PubMed] [Google Scholar]
- 30.Wasser K, Sinn HP, Fink C, et al. Accuracy of tumor size measurement in breast cancer using MRI is influenced by histological regression induced by neoadjuvant chemotherapy. Eur Radiol 2003;13(6):1213–1223 [DOI] [PubMed] [Google Scholar]
- 31.Honkoop AH, Pinedo HM, De Jong JS, et al. Effects of chemotherapy on pathologic and biologic characteristics of locally advanced breast cancer. Am J Clin Pathol 1997;107(2):211–218 [DOI] [PubMed] [Google Scholar]
- 32.Fisher ER, Wang J, Bryant J, Fisher B, Mamounas E, Wolmark N. Pathobiology of preoperative chemotherapy: findings from the National Surgical Adjuvant Breast and Bowel (NSABP) protocol B-18. Cancer 2002;95(4):681–695 [DOI] [PubMed] [Google Scholar]
- 33.Peintinger F, Kuerer HM, McGuire SE, Bassett R, Pusztai L, Symmans WF. Residual specimen cellularity after neoadjuvant chemotherapy for breast cancer. Br J Surg 2008;95(4):433–437 [DOI] [PubMed] [Google Scholar]
- 34.Buchholz TA, Hunt KK, Whitman GJ, Sahin AA, Hortobagyi GN. Neoadjuvant chemotherapy for breast carcinoma: multidisciplinary considerations of benefits and risks. Cancer 2003;98(6):1150–1160 [DOI] [PubMed] [Google Scholar]
- 35.Tse GM, Chaiwun B, Wong KT, et al. Magnetic resonance imaging of breast lesions: a pathologic correlation. Breast Cancer Res Treat 2007;103(1):1–10 [DOI] [PubMed] [Google Scholar]
- 36.Rouzier R, Perou CM, Symmans WF, et al. Breast cancer molecular subtypes respond differently to preoperative chemotherapy. Clin Cancer Res 2005;11(16):5678–5685 [DOI] [PubMed] [Google Scholar]
Associated Data
This section collects any data citations, data availability statements, or supplementary materials included in this article.


