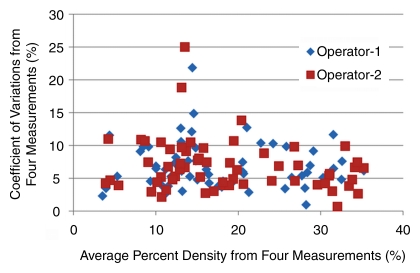
Figure 4:
Plot of CVs of the PD measured among the four MR imaging studies in one menstrual cycle with respect to the mean. The results from 60 breasts measured by two operators are shown. One subject has a high variation. The CV of both breasts analyzed by operator 2 and the right breast analyzed by operator 1 is around 20%. This case is illustrated in Figure 5.

