Our findings suggest that, at perfusion MR imaging, more consistent estimations of relative cerebral blood volume are provided with ferumoxytol than with gadolinium-based contrast agents regardless of the permeability of the tumor vasculature.
Abstract
Purpose:
To evaluate the consistency of tumor blood volume measurements and antiangiogenic therapy efficacy assessments with a low-molecular-weight gadolinium-based contrast agent (GBCA, gadodiamide) versus an iron oxide nanoparticle (ferumoxytol) in the presence or absence of a loading dose of contrast agent before perfusion magnetic resonance (MR) imaging (preload method).
Materials and Methods:
The protocol was approved by the institutional animal care and use committee. U87MG tumor cells were implanted intracerebrally in 13 rats. All 13 rats underwent 11.75-T MR imaging with gadodiamide (60 μL) 13 days after tumor implantation. The next day, nine rats underwent MR imaging with ferumoxytol (60 μL). Immediately after ferumoxytol imaging, six rats received bevacizumab (45 mg/kg). MR imaging was repeated 48 hours after bevacizumab treatment with gadodiamide and 72 hours after treatment with ferumoxytol. Each study included three consecutive dynamic susceptibility-weighted contrast material–enhanced (DSC) MR acquisitions, which were performed without preload, with single-dose preload, and with double-dose preload. Tumor relative cerebral blood volume (rCBV) was estimated from each DSC MR acquisition. Two-way repeated measures analysis of variance was performed to test for differences between groups with both contrast agents.
Results:
DSC MR imaging with gadodiamide and without preload showed low rCBV (≤1.75) in nine of the 13 tumors; estimated rCBV increased progressively with both single- and double-dose preloads (P < .001). Conversely, rCBVs obtained with ferumoxytol were high (>1.75) and remained constant with all three acquisitions. The magnitude of rCBV decrease after bevacizumab administration was dependent on the dose of gadodiamide preload, whereas the magnitude of rCBV decrease with ferumoxytol was constant regardless of whether contrast agent preload was used.
Conclusion:
With GBCA, tumor rCBV can be underestimated without preload and becomes dose dependent with preload correction. Conversely, ferumoxytol provides consistent assessment of tumor rCBV and antiangiogenic therapy efficacy.
© RSNA, 2011
Introduction
Angiogenesis as an essential feature of brain tumors has become a target for multiple novel therapies (1,2). Bevacizumab (Avastin; Genetech, South San Francisco, Calif), an antiangiogenic monoclonal antibody that targets vascular endothelial growth factor, has been shown to improve overall survival time in both animal models (3) and clinical studies of recurrent glioblastoma (4,5). Current criteria used in neurooncology to evaluate treatment response are based on conventional T2-weighted and contrast material–enhanced T1-weighted magnetic resonance (MR) imaging sequences and cannot be reliably used after chemo- and radiation therapy or antiangiogenic treatment. An alternative technique is measurement of relative cerebral blood volume (rCBV) with dynamic susceptibility-weighted contrast-enhanced (DSC) perfusion MR imaging. Perfusion MR imaging has shown utility for characterizing histopathologic features and differentiating brain abnormalities (6,7); grading gliomas (8–11); assessing the prognosis of patients with glioma (11–14); predicting early recurrence, progression, or malignant transformation (15); and differentiating recurrent tumor from chemotherapy- or radiation-induced injury (16–19). DSC MR imaging is gaining use as a noninvasive approach with which to assess tumor angiogenesis and monitor antiangiogenic therapy (20–22).
Any condition that causes disruption of the blood-brain barrier (BBB) and increases vasculature permeability may lead to leakage of low-molecular-weight gadolinium-based contrast agents (GBCAs) with a molecular diameter on the order of 1 nm from the vascular compartment to the interstitial space. Extravasation of GBCA results in interstitial signal intensity changes (T1, T2, and T2* weighted) that confound the intravascular susceptibility-induced signal intensity changes seen during passage of the contrast agent through the vasculature (23) and may lead to underestimation of rCBV, especially in lesions with highly permeable vasculature (17–19).
To improve the diagnostic accuracy of DSC MR imaging, several methods have been proposed for contrast material extravasation correction, including the use of small-flip-angle gradient-echo (6,9,24) or dual-echo (25,26) perfusion acquisitions, postprocessing with multiple mathematic correction algorithms (23,27,28), and the use of blood pool iron oxide contrast agents (19,21,22,29–31). One of the most common contrast material extravasation correction methods is administration of a loading dose of GBCA before perfusion image acquisition. This is referred to as the “preload method” (23,27). We hypothesized that blood volume estimation would be more reliable in lesions with a disrupted BBB when a blood pool contrast agent is used to minimize extravasation artifacts (19,22,29–31). The inability of the ultrasmall superparamagnetic iron oxide ferumoxytol to cross the disrupted BBB in the short term (minutes to hours) owing to the large size of the iron nanoparticles (∼30 nm) and long half-life (∼14 hours) provides an attractive alternative to GBCA for blood volume measurements (31).
Ferumoxytol is approved by the U.S. Food and Drug Administration for iron replacement therapy in adults with chronic kidney disease, and its off-label use has shown utility in brain imaging (19,29,31). Because ferumoxytol is not eliminated by the kidneys, it may also serve as a safe alternative to GBCA in patients who are at risk for nephrogenic systemic fibrosis (32).
The goal of this study was to evaluate the consistency of tumor blood volume measurements and antiangiogenic therapy efficacy assessments with a low-molecular-weight GBCA (gadodiamide) versus an iron oxide nanoparticle (ferumoxytol) in the presence or absence of a loading dose of contrast agent before perfusion MR imaging.
Materials and Methods
AMAG Pharmaceuticals provided the contrast agent ferumoxytol at no charge. The authors had control of the data and the information submitted for publication.
Animal Model
The protocol was approved by the institutional animal care and use committee. Thirteen female athymic nude rats (weight, 200–240 g; obtained from the in-house colony) were anesthetized with intraperitoneal injection of ketamine (60 mg/kg) and diazepam (7.5 mg/kg) for stereotactic inoculation of U87MG cells (∼1.5 × 10⁶ of >90% viable cells in 15 μL) into the right caudate nucleus. The U87 human glioma intracerebral xenograft model is a highly vascular and permeable tumor that overexpresses vascular endothelial growth factor (33) and has been previously used to study antiangiogenic treatments (22). All rats received intraperitoneal injection of cyclophosphamide (100 mg/kg) 24 hours before tumor implantation to increase tumor growth (34).
Study Design
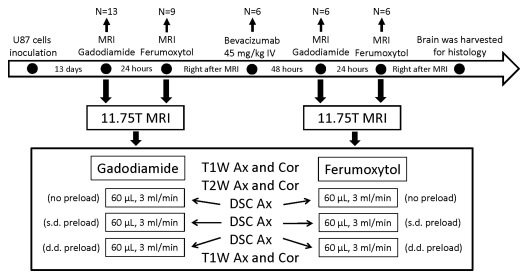
A flowchart for the experiment is shown in Figure 1. Thirteen rats underwent the initial MR imaging study, including anatomic MR imaging and three sequential DSC MR acquisitions with use of gadodiamide, 13 days after tumor implantation. In nine of the 13 rats, the MR imaging study was repeated with use of ferumoxytol on the next day so as to provide sufficient time for gadodiamide clearance. Immediately after ferumoxytol-enhanced imaging, six of the nine rats received intravenous injection of bevacizumab (45 mg/kg). All six rats underwent repeat MR imaging 48 hours after treatment with use of gadodiamide and 72 hours after treatment with use of ferumoxytol (Fig 1). Previous imaging studies performed 48 and 72 hours after bevacizumab treatment showed that the vascular changes seen at these two time points were similar (21,22). Immediately after the final MR imaging study, rat brains were excised, fixed in 10% buffered formalin, cut into 100-μm-thick coronal slices (Microm HM G50V; Thermo Scientific, Waltham, Mass), and stained with hematoxylin.
Figure 1:
Study schema. Time course, treatments, MR examinations performed, and number of rats studied at each point are shown. Ax = axial, Cor = coronal, d.d. = double dose, IV = intravenous, s.d. = single dose, T1W = T1-weighted, T2W = T2-weighted.
MR Imaging
Animals were anesthetized with intraperitoneal injection of ketamine (15 mg/kg) and medetomidine (0.6 mg/kg; Pfizer Animal Health, Exton, Pa), with atipamezole (1 mg, Pfizer) administered at the end of the study to reverse the effects of anesthesia. The tail vein was catheterized, and animals were placed in the 11.75-T MR unit (Bruker, Billerica, Mass). Throughout each imaging session, animals were wrapped in a warm water blanket and oxygen saturation and heart rate were monitored. A 7-cm quadrature birdcage coil was used to transmit radiofrequency, and a 2-cm surface coil, placed on the animal’s head, was used to receive radiofrequency. The coils were actively decoupled. First, unenhanced anatomic T2-weighted images (repetition time msec/echo time msec = 4020/24, 90° flip angle, 3.2 × 3.2-cm2 field of view, 256 × 256 matrix, and 25 contiguous 1-mm-thick sections) and T1-weighted images (160/1.6, 60° flip angle, 3.2 × 3.2-cm2 field of view, 256 × 256 matrix, and 25 contiguous 1-mm-thick sections) were obtained in both the coronal and axial planes. Then, T2*-weighted DSC MR images were acquired by using a gradient-echo pulse sequence with the following parameters: 31/5.0, 6° flip angle, 3.2 × 3.2-cm2 field of view, 128 × 128 matrix, and three contiguous 1-mm-thick sections. After an initial ∼30-second baseline acquisition of 15 volumes, rapid administration of a 60-μL bolus of contrast agent was performed via the tail vein catheter by using a power injector at a rate of 3 mL/min, followed immediately by a 240-μL saline flush at the same injection rate. DSC data collection continued for another 100 volumes (3 minutes 20 seconds). We performed three consecutive DSC MR acquisitions with ∼5 minutes between sequential contrast agent administrations. Either 60 μL of undiluted gadodiamide (Omniscan, GE Healthcare, Waukesha, Wis; 0.12–0.15 mmol/kg) or 60 μL of 15 mg/mL ferumoxytol (Feraheme, AMAG Pharmaceuticals, Cambridge, Mass; 3.75–4.5 mg/kg) was used as a contrast agent bolus. Each previous contrast agent injection served as a preload for the subsequent perfusion study. Thus, the first DSC MR acquisition had no contrast agent preload, the second DSC MR acquisition had a single-dose preload, and the third DSC MR acquisition had a double-dose preload. After the DSC MR acquisitions, contrast-enhanced T1-weighted images were obtained in both the coronal and axial planes to visualize tumor enhancement.
Two of the 13 rats underwent dynamic contrast-enhanced (DCE) MR imaging with gadodiamide to measure tumor vasculature permeability 12 days after tumor implantation. The parameters for three-section fast gradient-echo DCE MR imaging were as follows: 25/1.4, 20° flip angle, 1.0-mm-thick sections, 4.48 × 2.24-cm2 rectangular field of view, 128 × 64 matrix, and 1.6-second temporal resolution. On the next day, the same rats underwent three sequential DSC MR acquisitions with use of gadodiamide to assess tumor rCBV.
Image Processing
All data were acquired and processed by two authors (S.G. and X.L.), who at the time of analysis had 4 and 15 years of experience in this field, respectively. All data obtained at first-pass DSC MR imaging were processed by using Lupe (Lund University Perfusion Evaluation) perfusion image analysis software with a singular value decomposition–based calculation method as described by Ostergaard et al (35), uncorrected for contrast agent leakage. Color-coded rCBV maps were created on a voxel-wise basis. Within the enhancing lesion, a 1-mm2 (4 × 4-pixel) region of interest (ROI) with the highest rCBV on the ferumoxytol perfusion map and the same ROI on the gadodiamide perfusion map were analyzed by using National Institutes of Health ImageJ software. The same ROIs for a given rat applied across all three consecutive DSC MR acquisitions. The rCBV was calculated as the ratio of the blood volume in a tumor ROI to that in a normal-appearing, contralateral brain tissue ROI. Areas depicting major vessels were excluded. An rCBV of more than 1.75 was considered high, and an rCBV of 1.75 or less was considered low. These values have been widely used as threshold values in previous publications and in clinical practice (12,13,19).
In the six rats that received bevacizumab, rCBV values were calculated by using the same ROI before and after treatment. The percentage rCBV change after treatment was captured from each DSC MR acquisition (no preload and single- and double-dose preload) and for both contrast agents.
DCE pharmacokinetic modeling employs the Tofts model (36) with two model parameters, Ktrans (volume transfer constant) and ve (extravascular-extracellular space volume fraction). For this, the arterial input function for each animal was derived from selected pixels in the sagittal sinus as previously described (37). The tumor precontrast T1 value was determined from measurements by using the same fast gradient-echo sequence at nine different flip angles ranging from 5° to 75°.
Statistical Analysis
Two-way repeated measures analysis of variance was performed to test for differences between three sequential DSC MR acquisitions performed with each contrast agent before and after treatment as well as to assess differences in treatment response between sequential DSC MR acquisitions for each contrast agent. A Bonferroni posttest correction was applied. The dependency between contrast preload dose and rCBV value was assessed with repeated one-way analysis of variance with posttest for linear trend. The paired t test was used to compare rCBV values between contrast agents for paired perfusion studies. Statistical analysis was performed by using software (Prism; GraphPad Software, La Jolla, Calif). P < .05 was considered indicative of a statistically significant difference.
Results
Influence of Contrast Agent Preload on rCBV Estimation
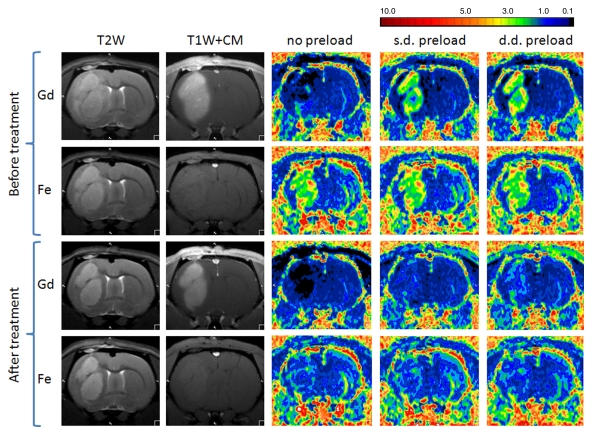
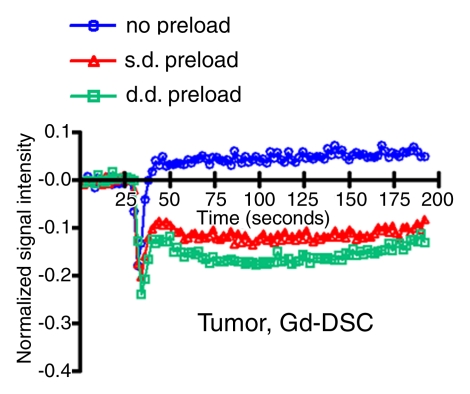
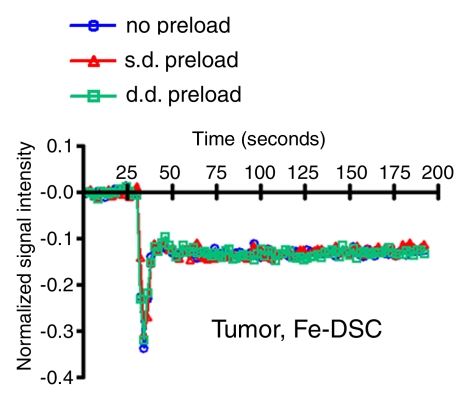
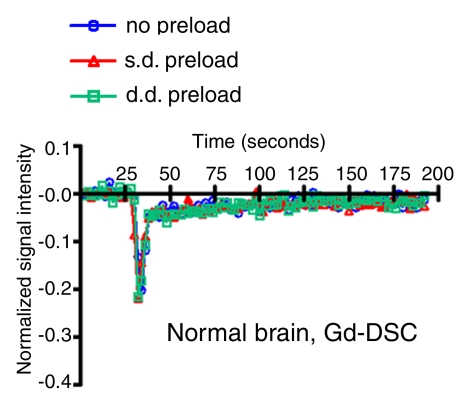
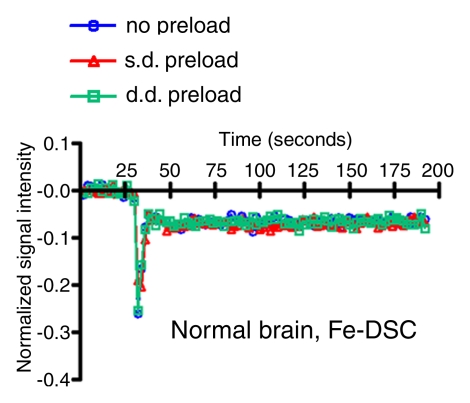
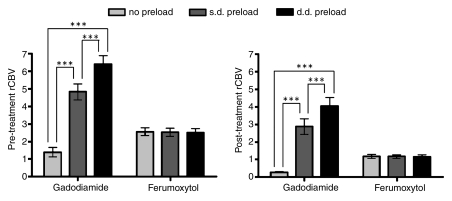
Figure 2 shows anatomic MR images and color-coded rCBV maps from a single rat with use of gadodiamide and ferumoxytol before and after bevacizumab treatment. DSC MR acquisitions with use of gadodiamide in highly vascular U87 tumor showed low blood volume (rCBV ≤1.75) without contrast agent preload and an apparent increase in rCBV after single- and double-dose gadodiamide preload. Conversely, the rCBVs obtained with ferumoxytol were high (>1.75) and constant on three consecutive DSC MR acquisitions. The signal intensity–time curves from ROIs in tumor (Fig 3a, 3b) and normal brain (Fig 3c, 3d) demonstrate the differences in contrast agent extravasation between gadodiamide and ferumoxytol. The T1 effect is apparent on the signal intensity–time curve derived from the DSC MR acquisitions with use of gadodiamide obtained without contrast agent preload (Fig 3a) as a postbolus increase in signal intensity above that at baseline. Following single- and double-dose gadodiamide preloads, a postbolus signal intensity decrease known as a residual T2* effect became apparent (Fig 3a); this can result in overestimation of the rCBV (23). Conversely, the signal intensity–time curves for each of the three consecutive DSC MR acquisitions with use of ferumoxytol were similar to each other, not only within the tumor but also in contralateral, normal-appearing parenchyma (Fig 3b, 3d). The mean rCBV (±standard deviation) in all 13 rats derived with use of gadodiamide without contrast agent preload was 1.39 ± 0.28; nine of the 13 rats (69%) had a low rCBV (mean, 0.83 ± 0.15) and four (31%) had a high rCBV (mean, 2.67 ± 0.28). After single-dose gadodiamide preload, the rCBV became elevated in all 13 rats (mean, 4.82 ± 0.45; P < .001) and was even higher after the double-dose preload (mean, 6.4 ± 0.49; P < .001) (Fig 4). With gadodiamide, the rCBV increased 3.5 times after single-dose preload and 4.6 times after double-dose preload compared with no contrast agent preload (P < .001). There was a significant monotonic relationship between gadodiamide preload dose and rCBV (P < .0001).
Figure 2:
Effect of antiangiogenic therapy on tumor rCBV assessed with gadodiamide (Gd) or ferumoxytol (Fe). Anatomic contrast-enhanced T1-weighted images (T1W+CM) show tumor enhancement with gadodiamide but not with ferumoxytol. Decrease of T2 signal and gadodiamide enhancement after treatment is apparent. Tumor rCBV is variable without preload, with single-dose (s.d.) preload, and with double-dose (d.d.) preload when gadodiamide is used, whereas rCBVs obtained with ferumoxytol are the same regardless of preload dose. Note that rCBV decreased after bevacizumab treatment for both contrast agents.
Figure 3a:
Signal intensity–time curves compare DSC perfusion with (a, c) gadodiamide (Gd) and (b, d) ferumoxytol (Fe) in (a, b) tumor and (c, d) normal brain. When gadodiamide is used without preload, contrast agent extravasation in the tumor results in an increase in signal intensity above that at baseline (a). With single-dose (s.d.) or double-dose (d.d.) contrast agent preload, residual T2* effect can be seen as a signal intensity decrease after the first pass of contrast agent bolus. All of the above confound accurate measurement of tumor blood volume. No difference is seen in signal intensity–time curves in the region of brain with intact BBB (c). With ferumoxytol, signal intensity–time curves are the same with and without preload in tumor (b) and normal brain (d), suggesting that there is no extravasation of contrast agent bolus in regions with either disrupted or intact BBB.
Figure 3b:
Signal intensity–time curves compare DSC perfusion with (a, c) gadodiamide (Gd) and (b, d) ferumoxytol (Fe) in (a, b) tumor and (c, d) normal brain. When gadodiamide is used without preload, contrast agent extravasation in the tumor results in an increase in signal intensity above that at baseline (a). With single-dose (s.d.) or double-dose (d.d.) contrast agent preload, residual T2* effect can be seen as a signal intensity decrease after the first pass of contrast agent bolus. All of the above confound accurate measurement of tumor blood volume. No difference is seen in signal intensity–time curves in the region of brain with intact BBB (c). With ferumoxytol, signal intensity–time curves are the same with and without preload in tumor (b) and normal brain (d), suggesting that there is no extravasation of contrast agent bolus in regions with either disrupted or intact BBB.
Figure 3c:
Signal intensity–time curves compare DSC perfusion with (a, c) gadodiamide (Gd) and (b, d) ferumoxytol (Fe) in (a, b) tumor and (c, d) normal brain. When gadodiamide is used without preload, contrast agent extravasation in the tumor results in an increase in signal intensity above that at baseline (a). With single-dose (s.d.) or double-dose (d.d.) contrast agent preload, residual T2* effect can be seen as a signal intensity decrease after the first pass of contrast agent bolus. All of the above confound accurate measurement of tumor blood volume. No difference is seen in signal intensity–time curves in the region of brain with intact BBB (c). With ferumoxytol, signal intensity–time curves are the same with and without preload in tumor (b) and normal brain (d), suggesting that there is no extravasation of contrast agent bolus in regions with either disrupted or intact BBB.
Figure 3d:
Signal intensity–time curves compare DSC perfusion with (a, c) gadodiamide (Gd) and (b, d) ferumoxytol (Fe) in (a, b) tumor and (c, d) normal brain. When gadodiamide is used without preload, contrast agent extravasation in the tumor results in an increase in signal intensity above that at baseline (a). With single-dose (s.d.) or double-dose (d.d.) contrast agent preload, residual T2* effect can be seen as a signal intensity decrease after the first pass of contrast agent bolus. All of the above confound accurate measurement of tumor blood volume. No difference is seen in signal intensity–time curves in the region of brain with intact BBB (c). With ferumoxytol, signal intensity–time curves are the same with and without preload in tumor (b) and normal brain (d), suggesting that there is no extravasation of contrast agent bolus in regions with either disrupted or intact BBB.
Figure 4:
Bar charts compare tumor rCBV measured with gadodiamide and ferumoxytol before and after antiangiogenic therapy. Data are means and standard errors. Before treatment, 13 rats were evaluated with gadodiamide and nine with ferumoxytol. After treatment, six rats were evaluated with each contrast agent. The difference in rCBV without preload and with single-dose (s.d.) or double-dose (d.d.) preload is significant when gadodiamide was used before and after therapy (*** indicates P < .001). When ferumoxytol was used, rCBVs are the same regardless of preload dose. Note that rCBVs decreased after treatment independent of contrast agent.
In all nine rats imaged with ferumoxytol, the mean rCBVs on three consecutive DSC MR acquisitions were high and values were similar (2.56 ± 0.22 without preload, 2.54 ± 0.23 with single-dose preload, and 2.49 ± 0.24 with double-dose preload; P > .05) (Figs 2, 4).
The differences between rCBVs with gadodiamide and ferumoxytol were significant for all three sequential measurements (P < .05 without preload, P < .005 with single-dose preload, and P < .0005 with double-dose preload) (Fig 4).
Monitoring Antiangiogenic Therapy Efficacy
Six rats underwent MR imaging with both contrast agents before and after bevacizumab treatment. At imaging with use of gadodiamide performed 48 hours after bevacizumab administration, the rCBV decreased compared with corresponding pretreatment values in all rats; however, apparent rCBV was highly dependent on the preload contrast agent dose, with mean values of 0.27 ± 0.05 without preload, 2.88 ± 0.44 with single-dose preload, and 4.03 ± 0.5 with double-dose preload (Figs 2, 4). Differences between rCBVs were significant (P < .001), with linear preload dose dependence (P < .0001). At imaging with use of ferumoxytol performed 72 hours after bevacizumab treatment, rCBV was diminished relative to pretreatment values in all rats and remained constant (P > .05) in three consecutive perfusions (mean, 1.18 ± 0.12, 1.16 ± 0.1, and 1.15 ± 0.1, respectively) (Figs 2, 4).
The differences between rCBVs obtained after treatment with use of gadodiamide and ferumoxytol were significant (P < .009) in all three sequential perfusions (Fig 4).
A large percentage decrease in rCBV was seen with gadodiamide after antiangiogenic therapy on all three sequential DSC MR acquisitions (mean, 68.79% ± 8.81 without preload, 42.83% ± 9.73 with single-dose preload, and 43.96% ± 5.3 with double-dose preload), with significant differences between values obtained without preload and with single- or double-dose preload (P < .001). However, the magnitude of changes varied unpredictably in three consecutive perfusions in individual rats (Fig 5). Ferumoxytol also revealed a large percentage decrease in rCBV (mean, 45.89% ± 6.37 without preload, 46.08% ± 6.64 with single-dose preload, and 45.01% ± 6.7 with double-dose preload), but the magnitude of decrease was the same at all three consecutive DSC MR acquisitions (Fig 5).
Figure 5:
Treatment response estimated with DSC perfusion imaging with gadodiamide (left) and ferumoxytol (right). With gadodiamide, the percentage decrease in tumor rCBV after antiangiogenic treatment varies among no preload, single-dose (s.d.) preload, and double-dose (d.d.) preload groups in each individual rat (n = 6). Conversely, with use of ferumoxytol, treatment response is the same regardless of preload dose.
Influence of Blood–Tumor Barrier Condition on rCBV Estimation
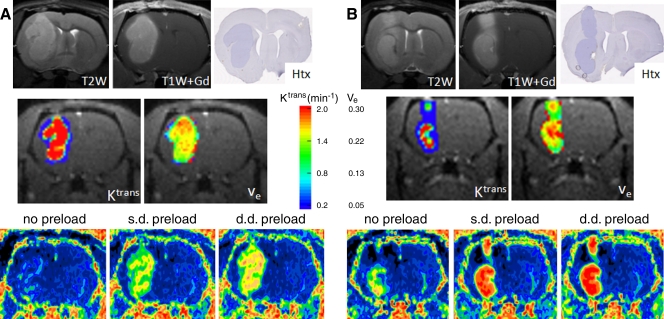
Figure 6 compares three sequential rCBVs obtained with gadodiamide in two tumors with different Ktrans and ve parameters. The tumor with the higher Ktrans (more permeable) and larger ve (larger extravascular-extracellular space) (Fig 6a) had a low rCBV, whereas the tumor with the lower Ktrans and smaller ve had a higher rCBV when there was no contrast agent preload (Fig 6b). Moreover, the relative difference between rCBVs with single- and double-dose preload was smaller in the tumor with the lower Ktrans and smaller ve than in the tumor with the higher Ktrans and larger ve.
Figure 6:
Relationship between accuracy of tumor rCBV obtained with gadodiamide and tumor vasculature permeability. Intracerebral U87 glioma has high signal intensity on T2-weighted MR images (T2W) and shows enhancement on gadodiamide-enhanced T1-weighted MR images (T1W+Gd). Hematoxylin (Htx)-stained histologic slices are also shown. A, Tumor with a high permeability coefficient (Ktrans) and distribution volume (ve) has low rCBV without preload. There is a large difference between rCBVs with single-dose (s.d.) and double-dose (d.d.) preload. B, Tumor with a lower permeability coefficient (Ktrans) and distribution volume (ve) (relative to the tumor in a) has high rCBV without preload; the difference between rCBVs obtained with single-dose (s.d.) and double-dose (d.d.) preload is small.
Discussion
We tested the contrast agent preload method, one of the most common extravasation correction techniques, comparing the GBCA gadodiamide versus the ultrasmall superparamagnetic iron oxide ferumoxytol before and after antiangiogenic therapy. We demonstrated that the rCBV of highly vascularized tumors with a disrupted BBB is significantly underestimated with GBCA without the use of preload and is dose dependent with the preload method. Conversely, ferumoxytol, as a true intravascular agent, provides consistent assessment of tumor rCBV and antiangiogenic therapy efficacy regardless of the permeability of the tumor vasculature and independent of contrast agent preload. As such, the magnitude of antiangiogenic therapy efficacy is better estimated with ferumoxytol rather than GBCA.
The results of this study are in agreement with those of our previous clinical imaging study (19), where five of 11 patients with viable glioblastoma multiforme who underwent DSC MR imaging showed low rCBV (≤1.75) with gadoteridol; all 11 patients showed high rCBV (>1.75) with ferumoxytol. Hu et al (27) had similar results, performing six consecutive perfusion MR image acquisitions with use of GBCA and correlating rCBVs with histopathologic findings in patients with high-grade glioma after chemoradiotherapy. They showed that rCBV was underestimated in biopsy-verified tumors and dependent on contrast agent preload dose. Our findings provide additional information to that provided by those previous studies because we assessed the preload method before and after antiangiogenic therapy by using standard GBCA in comparison to ferumoxytol.
In addition to blood volume measurements, we characterized brain tumor vasculature permeability and extravascular-extracellular volume modeled from DCE MR imaging to provide further insights into DSC MR imaging with GBCA in two animals. The dose of preload contrast reagent necessary to saturate interstitial T1 varies depending on both Ktrans and ve. Because bevacizumab treatment can cause variable effects on both Ktrans and ve in each tumor, the dose of preload contrast agent necessary to saturate interstitial T1 will not be the same before and after treatment. We suggest that the difference in Ktrans and ve was a major reason for the variability in apparent tumor treatment response assessment when gadodiamide was used for DSC MR imaging along with the preload method. Conversely, ferumoxytol showed the same magnitude of treatment response regardless of preload status in perfusion MR imaging, suggesting negligible influence of vascular permeability and extravascular-extracellular space on the rCBV measurement when the blood pool agent is used.
There are several potential limitations to this study. First, mathematical contrast agent extravasation correction was not applied during postprocessing. Because it is well know that rCBV is underestimated with GBCA, a number of mathematical algorithms have been proposed to minimize artifacts from contrast agent extravasation. However, these methods require sophisticated postprocessing and suffer from a lack of consistency. These problems were shown by Paulson and Schmainda (23), who compared five different mathematical correction algorithms in the same patients and demonstrated variability in tumor rCBV depending on choice of method of analysis. Perfusion MR imaging provides a measurement of tumor blood volume as a ratio compared with normal-appearing parenchyma rather than as an absolute measurement of tumor vasculature as a percentage of tumor volume. There is no reference standard for conversion of rCBV to actual vascular density. In our study, we compared the blood pool agent ferumoxytol with low-molecular-weight GBCA in tumors with leaky vasculature; future studies might evaluate blood pool high-molecular-weight GBCAs. Second, there are differences in the number of animals per group owing to tumor burden and anesthesia difficulties; however, all groups had a minimum of six rats, which was sufficient for statistical evaluation. The final limitation of the study is that the animal model does not adequately reflect the heterogeneity of human brain tumors; therefore, this study should be repeated in a clinical study.
Practical application: Underestimation of tumor rCBV may lead to incorrect diagnosis and treatment strategy, as in the case of differentiation of tumor progression from pseudoprogression. The preload method improves the estimation of tumor rCBV when GBCA is used; however, rCBVs are dependent on the dose of contrast agent preload. Our findings suggest that using ferumoxytol for DSC MR imaging provides more consistent rCBV estimation than GBCA regardless of the permeability of the tumor vasculature.
Advances in Knowledge.
• The results of this rodent study confirm that measurements of brain tumor relative cerebral blood volume (rCBV) obtained with low-molecular-weight gadolinium-based contrast agents (GBCAs) are underestimated owing to extravasation artifacts.
• The administration of a loading dose of GBCA before perfusion MR imaging (known as the “preload method”) improves the accuracy of rCBV estimations; however, rCBVs are dependent on the dose of contrast agent used for preload.
• More consistent estimations of rCBV are provided with ferumoxytol iron oxide nanoparticles than with GBCAs regardless of the permeability of the tumor vasculature and whether preload is used.
Implication for Patient Care.
• Perfusion MR imaging with ferumoxytol offers the promise of consistent and reliable measurement of tumor blood volume, which may improve the assessment of actively growing tumor as well as the response to antiangiogenic therapy in patients with brain tumors.
Disclosures of Potential Conflicts of Interest: S.G. No potential conflicts of interest to disclose. L.L.M. No potential conflicts of interest to disclose. X.L. No potential conflicts of interest to disclose. E.A.N. Financial activities related to the present article: ferumoxytol ultrasmall superparamagnetic iron oxide nanoparticles were donated by AMAG Pharmaceuticals. Financial activities not related to the present article: has a sponsored research agreement with AMAG Pharmaceuticals. Other relationships: none to disclose.
Acknowledgments
The ultrasmall superparamagnetic iron oxide particles were donated by AMAG Pharmaceuticals. We thank Mike Pagel, BA, Lisa Bennett, MPA, and Aliana Kim for their contributions.
Received December 21, 2010; revision requested February 2, 2011; revision received April 25; accepted May 20; final version accepted June 27.
Supported by a Veterans Administration Merit Review grant.
Funding: This study was supported by the National Institutes of Health (grants NS053468, CA137488, and NS044687).
Abbreviations:
- BBB
- blood-brain barrier
- DSC
- dynamic susceptibility-weighted contrast material–enhanced
- GBCA
- gadolinium-based contrast agent
- Ktrans
- volume transfer constant
- rCBV
- relative cerebral blood volume
- ROI
- region of interest
- ve
- extravascular-extracellular space volume fraction
References
- 1.Jain RK. Antiangiogenic therapy for cancer: current and emerging concepts. Oncology (Williston Park) 2005;19(4 Suppl 3):7–16 [PubMed] [Google Scholar]
- 2.Wong ET, Brem S. Taming glioblastoma: targeting angiogenesis. J Clin Oncol 2007;25(30):4705–4706 [DOI] [PubMed] [Google Scholar]
- 3.Jahnke K, Muldoon LL, Varallyay CG, Lewin SJ, Kraemer DF, Neuwelt EA. Bevacizumab and carboplatin increase survival and asymptomatic tumor volume in a glioma model. Neuro Oncol 2009;11(2):142–150 [DOI] [PMC free article] [PubMed] [Google Scholar]
- 4.Friedman HS, Prados MD, Wen PY, et al. Bevacizumab alone and in combination with irinotecan in recurrent glioblastoma. J Clin Oncol 2009;27(28):4733–4740 [DOI] [PubMed] [Google Scholar]
- 5.Pope WB, Kim HJ, Huo J, et al. Recurrent glioblastoma multiforme: ADC histogram analysis predicts response to bevacizumab treatment. Radiology 2009;252(1):182–189 [DOI] [PubMed] [Google Scholar]
- 6.Maeda M, Itoh S, Kimura H, et al. Tumor vascularity in the brain: evaluation with dynamic susceptibility-contrast MR imaging. Radiology 1993;189(1):233–238 [DOI] [PubMed] [Google Scholar]
- 7.Rollin N, Guyotat J, Streichenberger N, Honnorat J, Tran Minh VA, Cotton F. Clinical relevance of diffusion and perfusion magnetic resonance imaging in assessing intra-axial brain tumors. Neuroradiology 2006;48(3):150–159 [DOI] [PubMed] [Google Scholar]
- 8.Aronen HJ, Gazit IE, Louis DN, et al. Cerebral blood volume maps of gliomas: comparison with tumor grade and histologic findings. Radiology 1994;191(1):41–51 [DOI] [PubMed] [Google Scholar]
- 9.Knopp EA, Cha S, Johnson G, et al. Glial neoplasms: dynamic contrast-enhanced T2*-weighted MR imaging. Radiology 1999;211(3):791–798 [DOI] [PubMed] [Google Scholar]
- 10.Sugahara T, Korogi Y, Kochi M, et al. Correlation of MR imaging–determined cerebral blood volume maps with histologic and angiographic determination of vascularity of gliomas. AJR Am J Roentgenol 1998;171(6):1479–1486 [DOI] [PubMed] [Google Scholar]
- 11.Lev MH, Ozsunar Y, Henson JW, et al. Glial tumor grading and outcome prediction using dynamic spin-echo MR susceptibility mapping compared with conventional contrast-enhanced MR: confounding effect of elevated rCBV of oligodendrogliomas [corrected]. AJNR Am J Neuroradiol 2004;25(2):214–221 [PMC free article] [PubMed] [Google Scholar]
- 12.Cao Y, Tsien CI, Nagesh V, et al. Survival prediction in high-grade gliomas by MRI perfusion before and during early stage of RT [corrected]. Int J Radiat Oncol Biol Phys 2006;64(3):876–885 [DOI] [PubMed] [Google Scholar]
- 13.Law M, Young RJ, Babb JS, et al. Gliomas: predicting time to progression or survival with cerebral blood volume measurements at dynamic susceptibility-weighted contrast-enhanced perfusion MR imaging. Radiology 2008;247(2):490–498 [DOI] [PMC free article] [PubMed] [Google Scholar]
- 14.Oh J, Henry RG, Pirzkall A, et al. Survival analysis in patients with glioblastoma multiforme: predictive value of choline-to-N-acetylaspartate index, apparent diffusion coefficient, and relative cerebral blood volume. J Magn Reson Imaging 2004;19(5):546–554 [DOI] [PubMed] [Google Scholar]
- 15.Danchaivijitr N, Waldman AD, Tozer DJ, et al. Low-grade gliomas: do changes in rCBV measurements at longitudinal perfusion-weighted MR imaging predict malignant transformation? Radiology 2008;247(1):170–178 [DOI] [PubMed] [Google Scholar]
- 16.Barajas RF, Jr, Chang JS, Segal MR, et al. Differentiation of recurrent glioblastoma multiforme from radiation necrosis after external beam radiation therapy with dynamic susceptibility-weighted contrast-enhanced perfusion MR imaging. Radiology 2009;253(2):486–496 [DOI] [PMC free article] [PubMed] [Google Scholar]
- 17.Hoefnagels FW, Lagerwaard FJ, Sanchez E, et al. Radiological progression of cerebral metastases after radiosurgery: assessment of perfusion MRI for differentiating between necrosis and recurrence. J Neurol 2009;256(6):878–887 [DOI] [PMC free article] [PubMed] [Google Scholar]
- 18.Hu LS, Baxter LC, Smith KA, et al. Relative cerebral blood volume values to differentiate high-grade glioma recurrence from posttreatment radiation effect: direct correlation between image-guided tissue histopathology and localized dynamic susceptibility-weighted contrast-enhanced perfusion MR imaging measurements. AJNR Am J Neuroradiol 2009;30(3):552–558 [DOI] [PMC free article] [PubMed] [Google Scholar]
- 19.Gahramanov S, Raslan AM, Muldoon LL, et al. Potential for differentiation of pseudoprogression from true tumor progression with dynamic susceptibility-weighted contrast-enhanced magnetic resonance imaging using ferumoxytol vs. gadoteridol: a pilot study. Int J Radiat Oncol Biol Phys 2011;79(2):514–523 [DOI] [PMC free article] [PubMed] [Google Scholar]
- 20.Law M. Advanced imaging techniques in brain tumors. Cancer Imaging 2009;9(Spec No A):S4–S9 [DOI] [PMC free article] [PubMed] [Google Scholar]
- 21.Muldoon LL, Gahramanov S, Li X, Marshall DJ, Kraemer DF, Neuwelt EA. Dynamic magnetic resonance imaging assessment of vascular targeting agent effects in rat intracerebral tumor models. Neuro Oncol 2011;13(1):51–60 [DOI] [PMC free article] [PubMed] [Google Scholar]
- 22.Varallyay CG, Muldoon LL, Gahramanov S, et al. Dynamic MRI using iron oxide nanoparticles to assess early vascular effects of antiangiogenic versus corticosteroid treatment in a glioma model. J Cereb Blood Flow Metab 2009;29(4):853–860 [DOI] [PMC free article] [PubMed] [Google Scholar]
- 23.Paulson ES, Schmainda KM. Comparison of dynamic susceptibility-weighted contrast-enhanced MR methods: recommendations for measuring relative cerebral blood volume in brain tumors. Radiology 2008;249(2):601–613 [DOI] [PMC free article] [PubMed] [Google Scholar]
- 24.Cha S. Perfusion MR imaging of brain tumors. Top Magn Reson Imaging 2004;15(5):279–289 [DOI] [PubMed] [Google Scholar]
- 25.Heiland S, Benner T, Debus J, Rempp K, Reith W, Sartor K. Simultaneous assessment of cerebral hemodynamics and contrast agent uptake in lesions with disrupted blood-brain barrier. Magn Reson Imaging 1999;17(1):21–27 [DOI] [PubMed] [Google Scholar]
- 26.Uematsu H, Maeda M. Double-echo perfusion-weighted MR imaging: basic concepts and application in brain tumors for the assessment of tumor blood volume and vascular permeability. Eur Radiol 2006;16(1):180–186 [DOI] [PubMed] [Google Scholar]
- 27.Hu LS, Baxter LC, Pinnaduwage DS, et al. Optimized preload leakage-correction methods to improve the diagnostic accuracy of dynamic susceptibility-weighted contrast-enhanced perfusion MR imaging in posttreatment gliomas. AJNR Am J Neuroradiol 2010;31(1):40–48 [DOI] [PMC free article] [PubMed] [Google Scholar]
- 28.Boxerman JL, Schmainda KM, Weisskoff RM. Relative cerebral blood volume maps corrected for contrast agent extravasation significantly correlate with glioma tumor grade, whereas uncorrected maps do not. AJNR Am J Neuroradiol 2006;27(4):859–867 [PMC free article] [PubMed] [Google Scholar]
- 29.Weinstein JS, Varallyay CG, Dosa E, et al. Superparamagnetic iron oxide nanoparticles: diagnostic magnetic resonance imaging and potential therapeutic applications in neurooncology and central nervous system inflammatory pathologies—a review. J Cereb Blood Flow Metab 2010;30(1):15–35 [DOI] [PMC free article] [PubMed] [Google Scholar]
- 30.Amemiya S, Akahane M, Aoki S, et al. Dynamic contrast-enhanced perfusion MR imaging with SPIO: a pilot study. Invest Radiol 2009;44(9):503–508 [DOI] [PubMed] [Google Scholar]
- 31.Neuwelt EA, Várallyay CG, Manninger S, et al. The potential of ferumoxytol nanoparticle magnetic resonance imaging, perfusion, and angiography in central nervous system malignancy: a pilot study. Neurosurgery 2007;60(4):601–611, discussion 611–612 [DOI] [PubMed] [Google Scholar]
- 32.Neuwelt EA, Hamilton BE, Varallyay CG, et al. Ultrasmall superparamagnetic iron oxides (USPIOs): a future alternative magnetic resonance (MR) contrast agent for patients at risk for nephrogenic systemic fibrosis (NSF)? Kidney Int 2009;75(5):465–474 [DOI] [PMC free article] [PubMed] [Google Scholar]
- 33.Valter MM, Wiestler OD, Pietsche T. Differential control of VEGF synthesis and secretion in human glioma cells by IL-1 and EGF. Int J Dev Neurosci 1999;17(5-6):565–577 [DOI] [PubMed] [Google Scholar]
- 34.Wu YJ, Muldoon LL, Dickey DT, Lewin SJ, Varallyay CG, Neuwelt EA. Cyclophosphamide enhances human tumor growth in nude rat xenografted tumor models. Neoplasia 2009;11(2):187–195 [DOI] [PMC free article] [PubMed] [Google Scholar]
- 35.Ostergaard L, Sorensen AG, Kwong KK, Weisskoff RM, Gyldensted C, Rosen BR. High resolution measurement of cerebral blood flow using intravascular tracer bolus passages. II. Experimental comparison and preliminary results. Magn Reson Med 1996;36(5):726–736 [DOI] [PubMed] [Google Scholar]
- 36.Tofts PS, Brix G, Buckley DL, et al. Estimating kinetic parameters from dynamic contrast-enhanced T(1)-weighted MRI of a diffusable tracer: standardized quantities and symbols. J Magn Reson Imaging 1999;10(3):223–232 [DOI] [PubMed] [Google Scholar]
- 37.Li X, Rooney WD, Várallyay CG, et al. Dynamic contrast-enhanced MRI with extravasating contrast reagent: rat cerebral glioma blood volume determination. J Magn Reson 2010;206(2):190–199 [DOI] [PMC free article] [PubMed] [Google Scholar]


