Coronary MR angiography is a reproducible and repeatable method with which to noninvasively assess coronary distensibility during cardiac cycles and is able to depict significant differences in coronary stiffness between older patients with type 2 diabetic mellitus and healthy aging control subjects.
Abstract
Purpose:
To assess the feasibility of using magnetic resonance (MR) angiography to noninvasively measure the coronary distensibility index (CDI) in older adults.
Materials and Methods:
This study was approved by the institutional review board and was compliant with HIPAA. Informed consent was obtained from all participants. Three-dimensional MR angiography was performed in 23 patients with type 2 diabetes mellitus (DM) (mean age, 72.9 years ± 5.8 [standard deviation]; age range, 65–84 years; 12 men, 11 women) and 50 healthy aging control subjects (mean age, 73.1 years ± 5.6; age range, 64–84 years; 28 men, 22 women). Imaging data were acquired in the rest periods of cardiac motion identified during end systole and middiastole. For imaging data with different acquisition windows, cross-sectional coronary planes were reconstructed and matched for the same anatomy according to coronary landmarks. The CDI, defined as [(lumen area at systole − lumen area at diastole)/(lumen area at diastole × pulse pressure)] × 1000, was compared between patients with DM and control subjects by using the Student t test. With the same protocol, CDIs were calculated in 10 randomly selected subjects by two independent readers. In addition, MR angiography (in systole and diastole) was repeated in those 10 subjects after repositioning.
Results:
CDIs were measured in 43 coronary segments of patients with DM and in 124 coronary segments of control subjects. The mean CDI in patients with DM was significantly lower than that in control subjects (2.79 mm Hg−1 ± 2.12 vs 9.14 mm Hg−1 ± 5.87, respectively; P < .001). CDI measurements showed good intraobserver (r = 0.914), interobserver (r = 0.820), and imaging–repeat imaging agreements (r = 0.811).
Conclusion:
Coronary MR angiography is a reproducible and repeatable noninvasive method for detecting significant differences in coronary distensibility between patients with DM and healthy aging control subjects.
© RSNA, 2011
Introduction
Age is a remarkable risk factor for various cardiovascular diseases (1). For clinical and epidemiologic studies, age-associated changes in vascular structure and function (eg, an increase in arterial wall stiffness) have been regularly monitored as instant indicators of cardiovascular aging to predict future clinical events (2–4).
In general, vessel stiffness may be quantified with use of several parameters, such as vasodilation (5), distensibility index (6), and pulse wave velocity (7). Changes in lumen diameter or area during a cardiac cycle are usually used to test vascular distensibility. Unfortunately, most tests available for measuring the distensibility of a vessel are either invasive or necessitate exposure to x-rays. Therefore, magnetic resonance (MR) imaging has emerged as a promising method for the noninvasive assessment of vascular distensibility without radiation exposure. Currently, vascular distensibility in the aorta and carotid and brachial arteries can be noninvasively measured with MR imaging by quantifying variations in the transverse luminal areas during cardiac cycles (8).
The coronary artery may be one of the most important parts of the entire arterial system because its pathologic changes are directly related to cardiovascular events. However, some physiologic barriers must be overcome before MR imaging can be realistically applied to evaluate the distensibility of coronary arteries. It is difficult to directly measure the lumen area of a coronary artery in vivo in real time because the coronary tree keeps deforming in a three-dimensional (3D) space. This means that most of the two-dimensional (2D) MR techniques that have been widely used to observe cross-sectional planes of other arteries (eg, 2D cine [8]) cannot be directly applied to coronary arteries.
Three-dimensional whole-heart coronary MR angiography may provide a unique technical solution for this challenge because it covers the entire coronary tree. With its segmented acquisition mode, imaging data are acquired over multiple cardiac cycles. During each cardiac cycle, a certain number of k-space lines are acquired during the rest period of cardiac motion—usually in middiastole (9). Nevertheless, for many individuals, there is another rest period that exists at end systole of a cardiac cycle. This allows us to acquire optimal images of coronary arteries during cardiac cycles in both systole and diastole with use of disparate acquisition windows. Therefore, the coronary distensibility index (CDI) can be calculated. We performed the present study to assess the feasibility of using MR angiography to noninvasively measure the CDI in older adults.
Materials and Methods
One coauthor (X.B.) is an employee of Siemens Healthcare, Chicago, Ill. The authors who are not employees of Siemens had full control of all data and information in this work.
Patient Study
The study was compliant with the Health Insurance Portability and Accountability Act and was approved by the institutional review board. From August 2010 to March 2011, 23 asymptomatic patients with type 2 diabetes mellitus (DM) (mean age, 72.9 years ± 5.8 [standard deviation]; age range, 65–84 years), including 12 men (mean age, 71.5 years ± 7.1) and 11 women (mean age, 74.5 years ± 3.8), and 50 healthy subjects (mean age, 73.1 years ± 5.6; age range, 64–84 years), including 28 men (mean age, 73.4 years ± 5.7) and 22 women (mean age, 72.7 years ± 5.5), were recruited for research coronary MR imaging. Informed consent was obtained from all participants. In the patients with DM, DM had been clinically diagnosed 2–18 years earlier. Subjects in the healthy aging group were asymptomatic and without a documented history of cardiovascular diseases, kidney dysfunction, hypertension, or DM. For each participant, peripheral (brachial) blood pressure was obtained within 2 hours before or after MR imaging. Pulse pressure (in millimeters of mercury) was calculated by subtracting the diastolic blood pressure from the systolic blood pressure (Table 1).
Table 1.
Summary of Participant Characteristics

Note.—Except where indicated, data are means ± standard deviations.
Numbers in parentheses are percentages.
Imaging Protocols
MR imaging was performed with a commercially available 1.5-T MR unit (Magnetom Espree; Siemens Healthcare, Erlangen, Germany) with a six-channel cardiac phased-array coil. A three-plane fast localization sequence was used for anatomic orientation of all images. Four-chamber, two-chamber, and short-axis views were acquired with a black-blood half-Fourier rapid acquisition with relaxation enhancement sequence to identify anatomy for cardiac images. A segmented 2D steady-state free precession sequence was used to acquire four-chamber cardiac cine images of the heart. The spatial resolution was 2.1 × 2.1 × 10 mm3, repetition time 2.8 msec, and echo time 1.1 msec (repetition time/echo time = 2.8/1.1). With retrospective gating, a total of 22 reconstructive cardiac phases were used. An unenhanced, electrocardiographically triggered, fat-saturated, T2-prepared, segmented 3D steady-state free precession sequence was run for whole-heart coronary MR angiography. Imaging was performed with an in-plane spatial resolution of 0.7 × 0.7 mm2 (interpolated from 1.4 × 1.4 mm2), 0.7-mm-thick sections, a 320 × 320-mm2 field of view, 3.7/1.7, 90° flip angle, readout bandwidth of 870 Hz per pixel, and parallel acquisition factor of two. Whole-heart coronary MR angiography was run twice with the same parameters (but different acquisition windows) by a certified MR technologist with 10 years of experience in cardiovascular imaging. For the first image, the acquisition window was traditionally set at the middiastolic period. For the second image, imaging data were acquired in end systole with an acquisition window of the same length in each cardiac cycle. The rest periods of cardiac motion in cardiac cycles were determined on the basis of the four-chamber cine images. The number of k-space lines acquired per heartbeat was 15–35 (taking 52–126 msec, depending on the length of the rest periods in cardiac cycles). The approximate imaging time for a single MR angiographic examination was 8–10 minutes.
Image Evaluation and Data Processing
Images were analyzed by one experienced radiologist (K.L., with 5 years of experience in cardiac imaging) with use of an imaging workstation (Studio XPS 435T [Dell, Round Rock, Tex], installed with a Linux operation system [Ubuntu 9.0; Canonical, London, England]). The image quality of the 3D whole-heart coronary MR angiograms was graded by using a modified three-point system, as follows (10): 1 = vessel (lumen) not visible or not eligible for analysis; 2 = good image quality, eligible for analysis, although vessel (lumen) may have some signal loss or image artifacts; and 3 = excellent image quality, vessel (lumen) is observed continuously with minor signal loss. Coronary images with a score (grade) of 2 or 3 were considered eligible for the quantitative analysis.
Cross-sectional images of coronary arteries were reconstructed by using multiplanar reconstruction on the basis of raw data acquired at both end systole and middiastole. For the two sets of data and/or images, transverse views at 5 mm from the origin of the right coronary artery (RCA), left main (LM) artery, and left anterior descending (LAD) artery were carefully identified and matched for the same anatomy according to coronary landmarks (eg, ostia and/or bifurcations of coronary branches). The coronary lumina were magnified or “zoomed” to 10 times (1000%) and manually traced by using software (VesselMASS; Leiden University, Leiden, the Netherlands) (10). Lumen areas were automatically calculated according to contours. The CDI was calculated on the basis of differences between coronary lumen areas with different acquisition windows. CDI (in millimeters of mercury−1) was defined as [(lumen area at systole − lumen area at diastole)/(lumen area at diastole × pulse pressure)] × 1000 (8).
Cross-sectional areas of proximal coronary artery segments of 10 randomly chosen subjects (six control subjects and four diabetic patients) were generated and measured by two independent readers (reader 1, K.L.; reader 2, Y.L., with 8 years of experience in clinical cardiovascular imaging and who was blinded to the aim of this study) and by the first reader (K.L.) at two separate times with a 2-week gap. In addition, an extra MR angiographic examination was performed in these 10 subjects in both systole and diastole approximately 15–20 minutes after the regular imaging examination and after subject repositioning. The first reader (K.L.) measured CDIs on the two images with a 2-week gap to test the repeatability of CDI measurements at MR angiography.
Statistical Methods
Measurements are generally expressed as means ± 1 standard deviation. The characteristics of participants were compared with χ2 and Student t tests; the general image quality of the coronary MR angiograms was compared with a Wilcoxon rank sum test; and the CDIs were compared with a Student t test on both a per-segment and per-vessel basis. Pearson correlation coefficients and Bland-Altman plots were applied to test intraobserver, interobserver, and imaging–repeat imaging agreements and variations. A two-tailed P value of less than .05 was indicative of a statistically significant difference. All statistical processing was performed with software (SPSS, version 13.0; SPSS, Chicago, Ill).
Results
Characteristics of Study Populations
There was no significant difference in sex (P = .804, χ2 test), age (P = .909, Student t test), heart rate (P = .053, Student t test), and pulse pressure (P = .186, Student t test) between participants with and participants without type 2 DM. There was no significant difference in age between men and women in the DM group (P = .224, Student t test) and the healthy aging group (P = .667, Student t test).
Image Quality
Coronary MR angiography was completed in 20 of the 23 diabetic patients (87%) and 46 of the 50 control subjects (92%). Three diabetic patients were excluded owing to poor image quality because of unexpected body motion (n = 1), irregular breathing (n = 1), and a fast heart rate (88 beats per minute) (n = 1). Four control subjects were excluded because of unexpected body motion (n = 1), irregular breathing (n = 1), claustrophobia (n = 1), and imaging unit malfunction (n = 1). There was no significant difference in image quality between the two subject groups (P = .678, Wilcoxon rank sum test).
Findings at Coronary MR Angiography
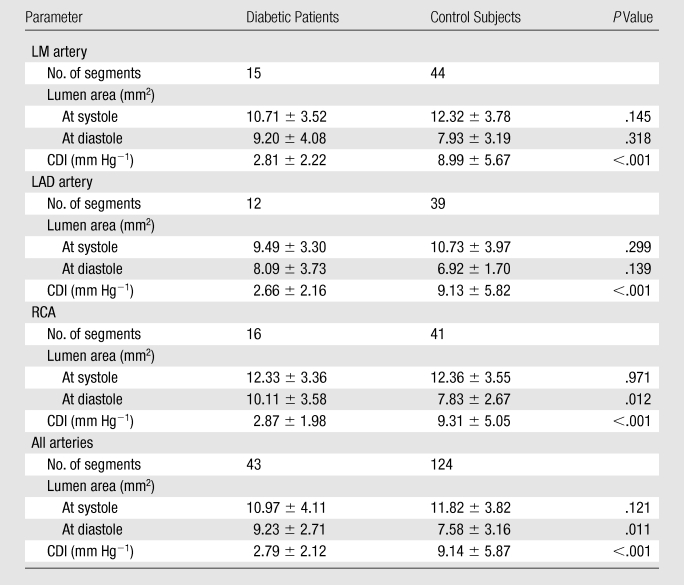
Luminal area and CDI were measured in 43 coronary segments (15 in the LM artery, 12 in the LAD artery, and 16 in the RCA) in diabetic patients and 124 coronary segments (44 in the LM artery, 39 in the LAD artery, and 41 in the RCA) in control subjects. On a per-segment basis, the luminal area of coronary segments at end systole was 10.97 mm2 ± 4.11 in diabetic patients and 11.82 mm2 ± 3.82 in control subjects (P = .121). The luminal area at middiastole was larger in patients with DM than in control subjects (9.23 mm2 ± 2.71 vs 7.58 mm2 ± 3.16, P = .011). Overall CDIs measured in diabetic patients were significantly lower than those in control subjects (2.79 mm Hg−1 ± 2.12 vs 9.14 mm Hg−1 ± 5.87, P < .001). On a per-vessel basis, the RCA lumen area at middiastole was larger in patients with DM than in control subjects (10.11 mm2 ± 3.58 vs 7.83 mm2 ± 2.67, P = .012). CDIs of diabetic patients were lower than those of control subjects in the LM artery (2.81 mm Hg−1 ± 2.22 vs 8.99 mm Hg−1 ± 5.67, respectively; P < .001), LAD artery (2.66 mm Hg−1 ± 2.16 vs 9.13 mm Hg−1 ± 5.82, P < .001), and RCA (2.87 mm Hg−1 ± 1.98 vs 9.31 mm Hg−1 ± 5.05, P < .001) (Table 2). Two typical examples of CDI measurement are shown in Figures 1 and 2.
Table 2.
Findings at Coronary MR Angiography
Note.—Except where indicated, data are means ± standard deviations.
Figure 1a:
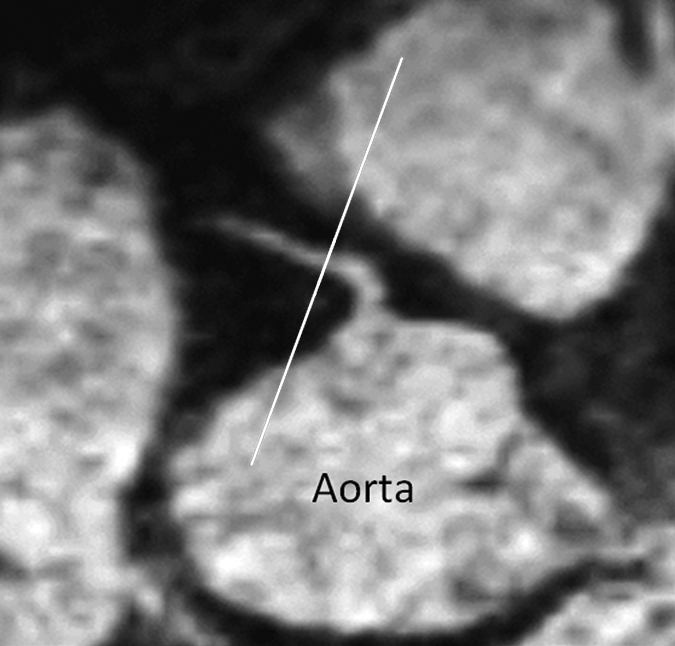
Images in a 73-year-old male control subject. Peripheral blood pressure was 130/70 mm Hg (pulse pressure = 60 mm Hg). (a) Longitudinal view of RCA in middiastole. (b) Longitudinal view of RCA in end systole. (c) Transverse view of lumen in middiastole. (d) Transverse view of lumen in end systole. (e) Zoomed view during diastole shows lumen contour (area, 7.61 mm2). (f) Zoomed view during systole shows lumen contour (area, 15.05 mm2). CDI = [(15.05 − 7.61)/(7.61/60)] × 1000 = 16.29 mm Hg−1. Lines in a and b represent locations of transverse views of vessel on its longitudinal view.
Figure 2a:
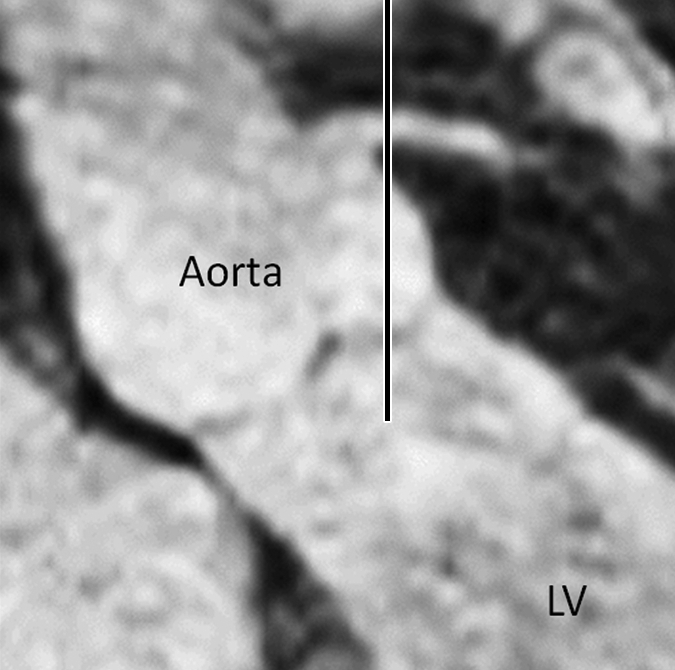
Images in an 84-year-old man with an 8-year history of type 2 DM. Peripheral blood pressure was 135/70 mm Hg (pulse pressure = 65 mm Hg). (a) Longitudinal view of LM artery in middiastole. (b) Longitudinal view of LM artery in end systole. (c) Transverse view of lumen in middiastole. (d) Transverse view of lumen in end systole. (e) Zoomed view during diastole shows lumen contour (area, 13.74 mm2). (f) Zoomed view during systole shows lumen contour (area, 16.35 mm2). CDI = [(16.35 − 13.74)/(13.74/65)] × 1000 = 2.92 mm Hg−1. LV = left ventricle. Lines in a and b represent locations of transverse views of vessel on its longitudinal view.
Figure 1b:
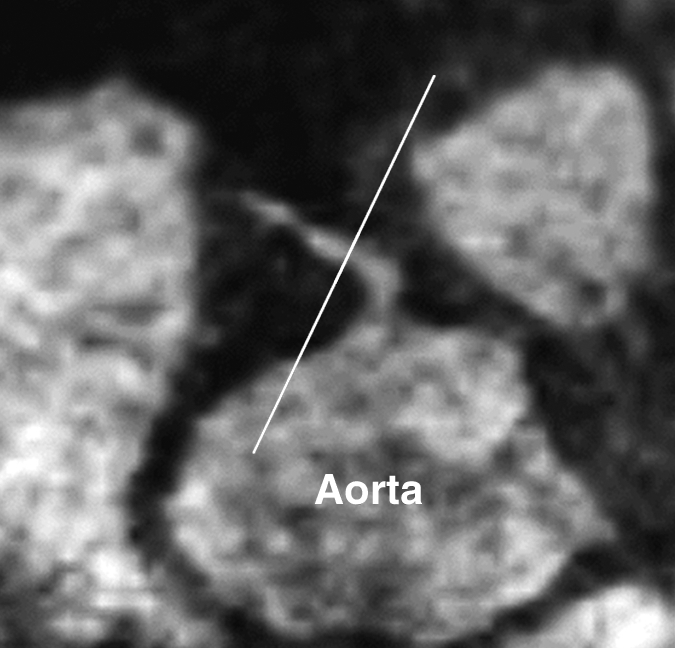
Images in a 73-year-old male control subject. Peripheral blood pressure was 130/70 mm Hg (pulse pressure = 60 mm Hg). (a) Longitudinal view of RCA in middiastole. (b) Longitudinal view of RCA in end systole. (c) Transverse view of lumen in middiastole. (d) Transverse view of lumen in end systole. (e) Zoomed view during diastole shows lumen contour (area, 7.61 mm2). (f) Zoomed view during systole shows lumen contour (area, 15.05 mm2). CDI = [(15.05 − 7.61)/(7.61/60)] × 1000 = 16.29 mm Hg−1. Lines in a and b represent locations of transverse views of vessel on its longitudinal view.
Figure 1c:
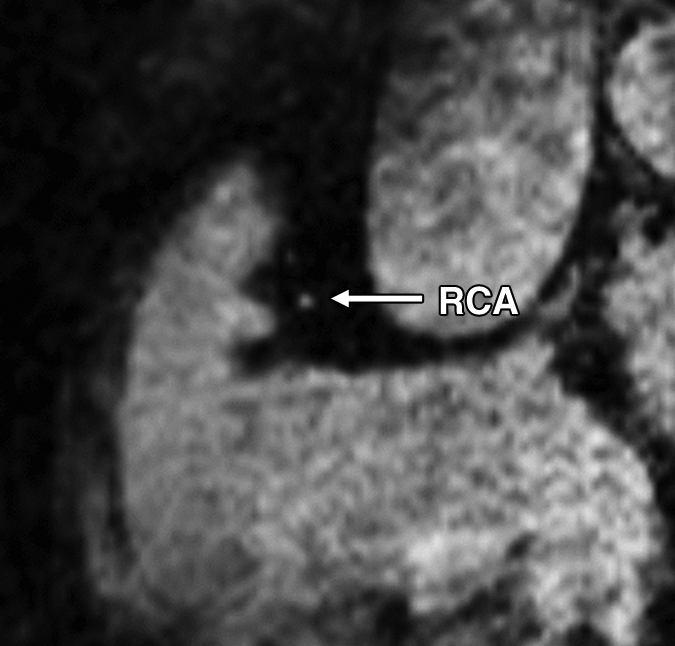
Images in a 73-year-old male control subject. Peripheral blood pressure was 130/70 mm Hg (pulse pressure = 60 mm Hg). (a) Longitudinal view of RCA in middiastole. (b) Longitudinal view of RCA in end systole. (c) Transverse view of lumen in middiastole. (d) Transverse view of lumen in end systole. (e) Zoomed view during diastole shows lumen contour (area, 7.61 mm2). (f) Zoomed view during systole shows lumen contour (area, 15.05 mm2). CDI = [(15.05 − 7.61)/(7.61/60)] × 1000 = 16.29 mm Hg−1. Lines in a and b represent locations of transverse views of vessel on its longitudinal view.
Figure 1d:
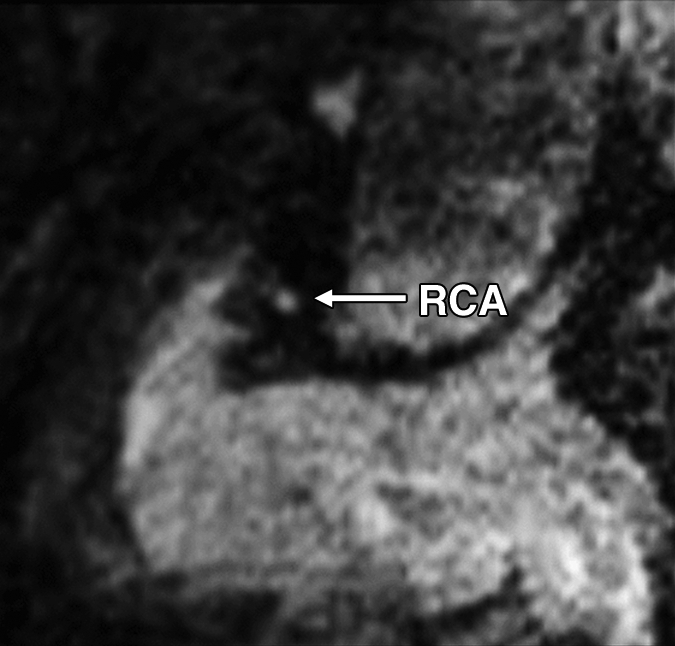
Images in a 73-year-old male control subject. Peripheral blood pressure was 130/70 mm Hg (pulse pressure = 60 mm Hg). (a) Longitudinal view of RCA in middiastole. (b) Longitudinal view of RCA in end systole. (c) Transverse view of lumen in middiastole. (d) Transverse view of lumen in end systole. (e) Zoomed view during diastole shows lumen contour (area, 7.61 mm2). (f) Zoomed view during systole shows lumen contour (area, 15.05 mm2). CDI = [(15.05 − 7.61)/(7.61/60)] × 1000 = 16.29 mm Hg−1. Lines in a and b represent locations of transverse views of vessel on its longitudinal view.
Figure 1e:
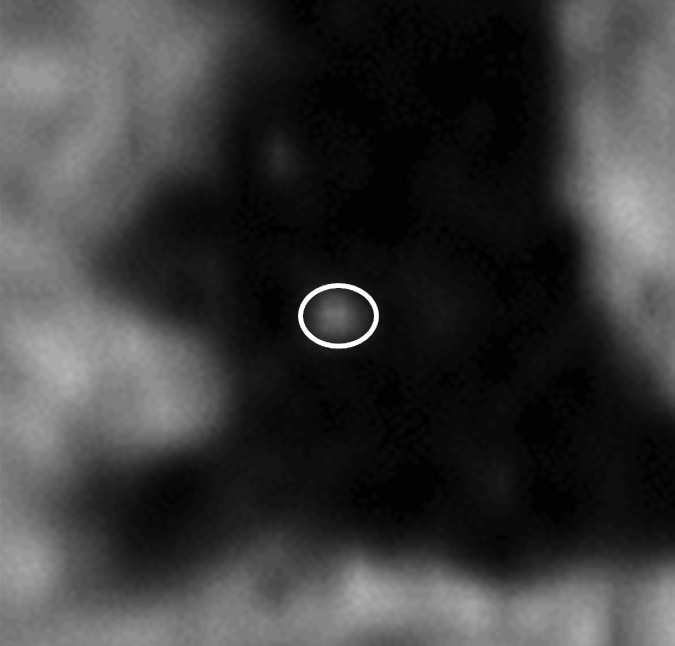
Images in a 73-year-old male control subject. Peripheral blood pressure was 130/70 mm Hg (pulse pressure = 60 mm Hg). (a) Longitudinal view of RCA in middiastole. (b) Longitudinal view of RCA in end systole. (c) Transverse view of lumen in middiastole. (d) Transverse view of lumen in end systole. (e) Zoomed view during diastole shows lumen contour (area, 7.61 mm2). (f) Zoomed view during systole shows lumen contour (area, 15.05 mm2). CDI = [(15.05 − 7.61)/(7.61/60)] × 1000 = 16.29 mm Hg−1. Lines in a and b represent locations of transverse views of vessel on its longitudinal view.
Figure 1f:
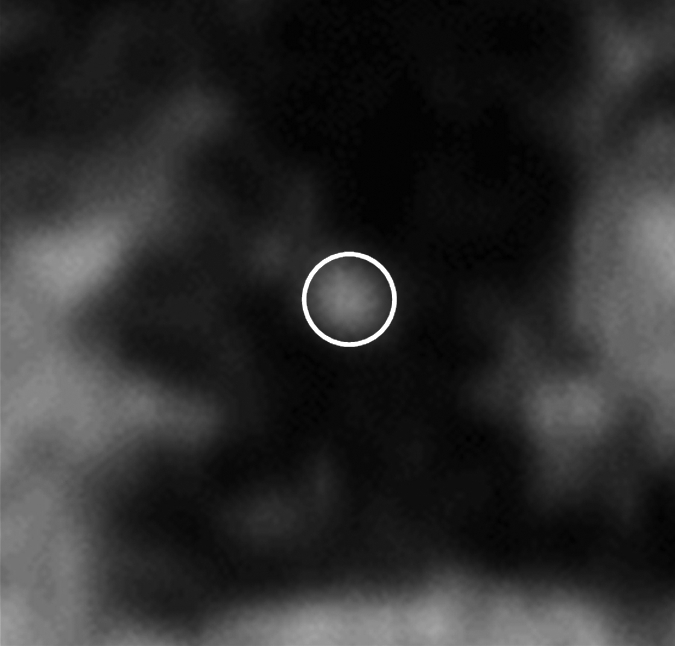
Images in a 73-year-old male control subject. Peripheral blood pressure was 130/70 mm Hg (pulse pressure = 60 mm Hg). (a) Longitudinal view of RCA in middiastole. (b) Longitudinal view of RCA in end systole. (c) Transverse view of lumen in middiastole. (d) Transverse view of lumen in end systole. (e) Zoomed view during diastole shows lumen contour (area, 7.61 mm2). (f) Zoomed view during systole shows lumen contour (area, 15.05 mm2). CDI = [(15.05 − 7.61)/(7.61/60)] × 1000 = 16.29 mm Hg−1. Lines in a and b represent locations of transverse views of vessel on its longitudinal view.
Figure 2b:
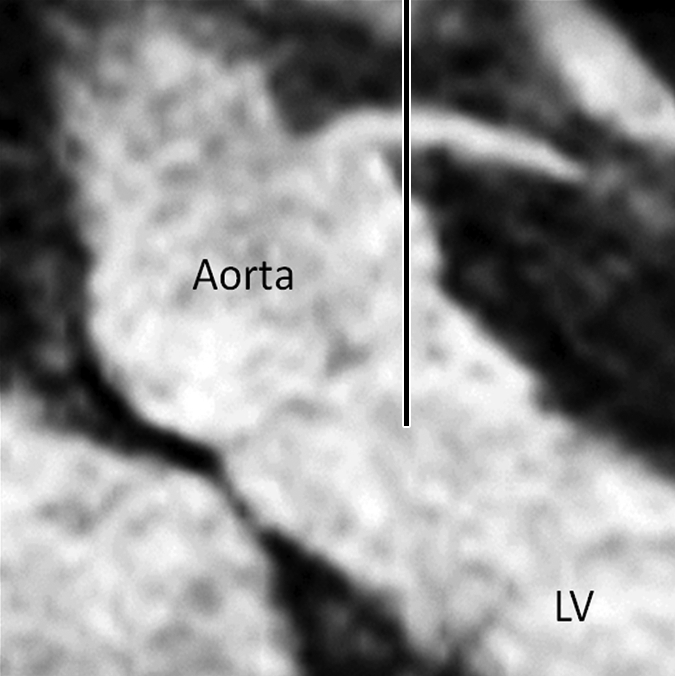
Images in an 84-year-old man with an 8-year history of type 2 DM. Peripheral blood pressure was 135/70 mm Hg (pulse pressure = 65 mm Hg). (a) Longitudinal view of LM artery in middiastole. (b) Longitudinal view of LM artery in end systole. (c) Transverse view of lumen in middiastole. (d) Transverse view of lumen in end systole. (e) Zoomed view during diastole shows lumen contour (area, 13.74 mm2). (f) Zoomed view during systole shows lumen contour (area, 16.35 mm2). CDI = [(16.35 − 13.74)/(13.74/65)] × 1000 = 2.92 mm Hg−1. LV = left ventricle. Lines in a and b represent locations of transverse views of vessel on its longitudinal view.
Figure 2c:
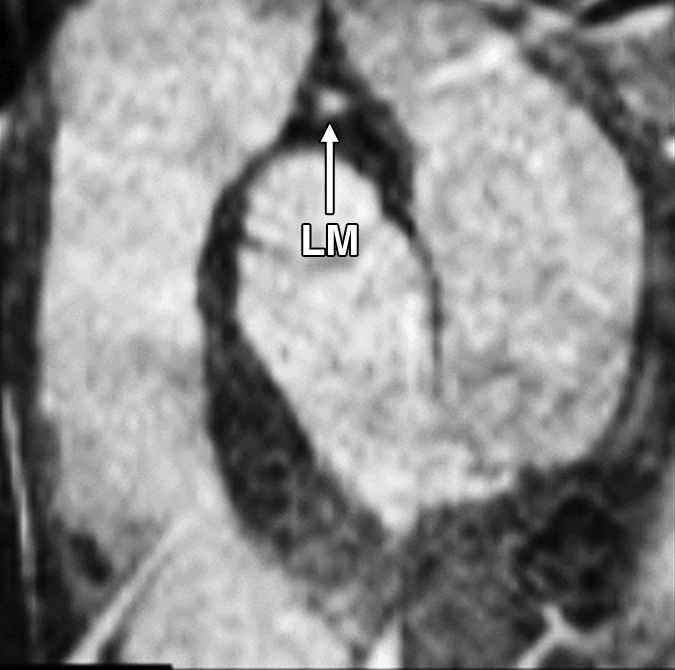
Images in an 84-year-old man with an 8-year history of type 2 DM. Peripheral blood pressure was 135/70 mm Hg (pulse pressure = 65 mm Hg). (a) Longitudinal view of LM artery in middiastole. (b) Longitudinal view of LM artery in end systole. (c) Transverse view of lumen in middiastole. (d) Transverse view of lumen in end systole. (e) Zoomed view during diastole shows lumen contour (area, 13.74 mm2). (f) Zoomed view during systole shows lumen contour (area, 16.35 mm2). CDI = [(16.35 − 13.74)/(13.74/65)] × 1000 = 2.92 mm Hg−1. LV = left ventricle. Lines in a and b represent locations of transverse views of vessel on its longitudinal view.
Figure 2d:
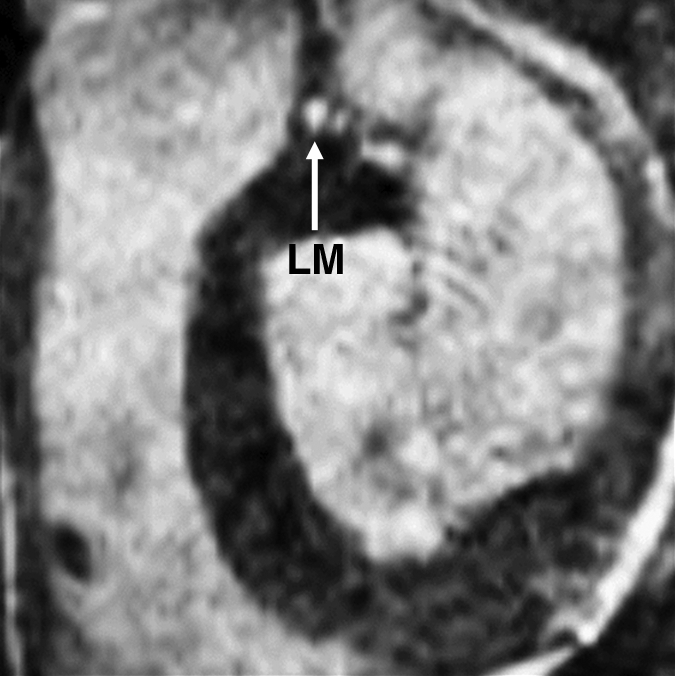
Images in an 84-year-old man with an 8-year history of type 2 DM. Peripheral blood pressure was 135/70 mm Hg (pulse pressure = 65 mm Hg). (a) Longitudinal view of LM artery in middiastole. (b) Longitudinal view of LM artery in end systole. (c) Transverse view of lumen in middiastole. (d) Transverse view of lumen in end systole. (e) Zoomed view during diastole shows lumen contour (area, 13.74 mm2). (f) Zoomed view during systole shows lumen contour (area, 16.35 mm2). CDI = [(16.35 − 13.74)/(13.74/65)] × 1000 = 2.92 mm Hg−1. LV = left ventricle. Lines in a and b represent locations of transverse views of vessel on its longitudinal view.
Figure 2e:
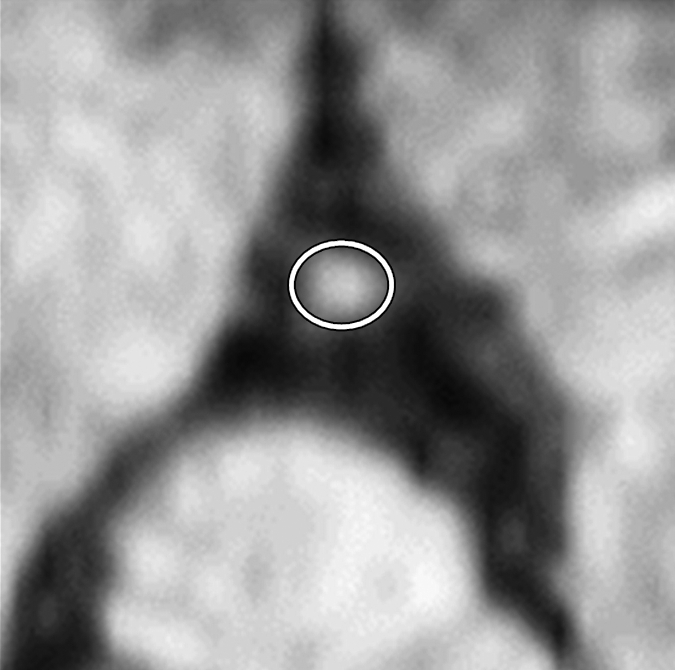
Images in an 84-year-old man with an 8-year history of type 2 DM. Peripheral blood pressure was 135/70 mm Hg (pulse pressure = 65 mm Hg). (a) Longitudinal view of LM artery in middiastole. (b) Longitudinal view of LM artery in end systole. (c) Transverse view of lumen in middiastole. (d) Transverse view of lumen in end systole. (e) Zoomed view during diastole shows lumen contour (area, 13.74 mm2). (f) Zoomed view during systole shows lumen contour (area, 16.35 mm2). CDI = [(16.35 − 13.74)/(13.74/65)] × 1000 = 2.92 mm Hg−1. LV = left ventricle. Lines in a and b represent locations of transverse views of vessel on its longitudinal view.
Figure 2f:
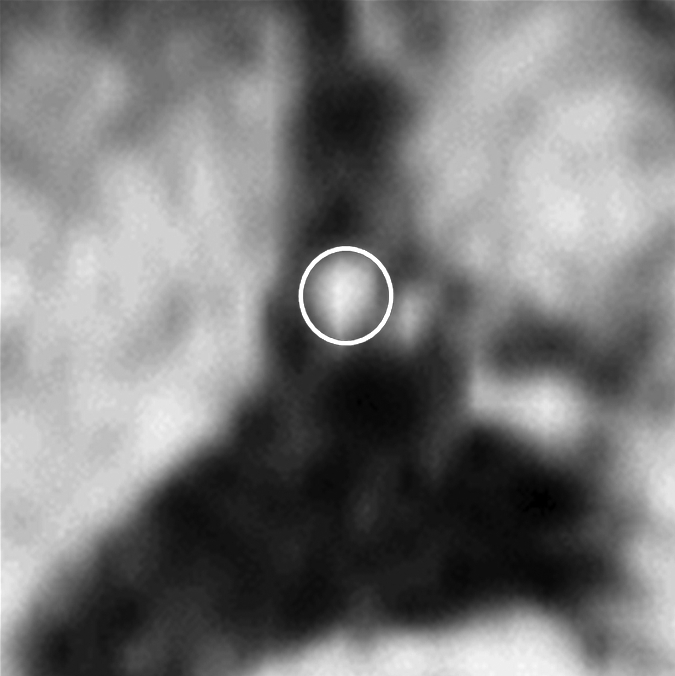
Images in an 84-year-old man with an 8-year history of type 2 DM. Peripheral blood pressure was 135/70 mm Hg (pulse pressure = 65 mm Hg). (a) Longitudinal view of LM artery in middiastole. (b) Longitudinal view of LM artery in end systole. (c) Transverse view of lumen in middiastole. (d) Transverse view of lumen in end systole. (e) Zoomed view during diastole shows lumen contour (area, 13.74 mm2). (f) Zoomed view during systole shows lumen contour (area, 16.35 mm2). CDI = [(16.35 − 13.74)/(13.74/65)] × 1000 = 2.92 mm Hg−1. LV = left ventricle. Lines in a and b represent locations of transverse views of vessel on its longitudinal view.
Repeatability and Reproducibility
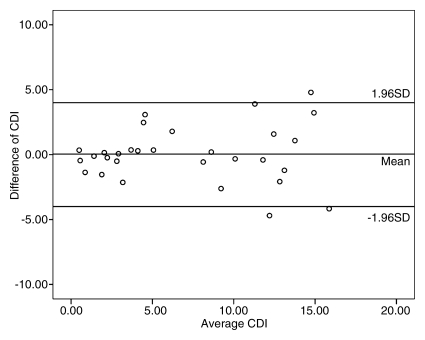
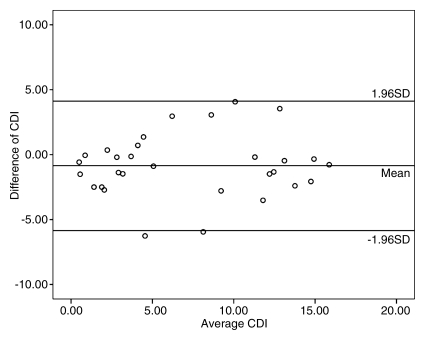
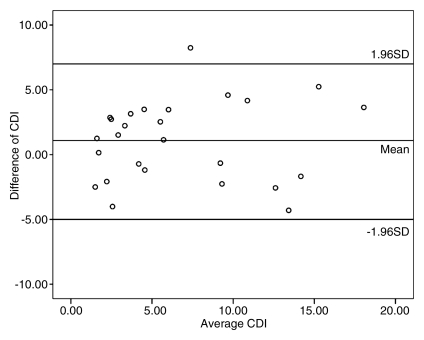
Repeat measurements of coronary lumen (the main factor affecting CDI measurements in our study) were performed in 10 subjects, including 30 coronary artery segments. CDI measurements showed excellent intraobserver agreement (r = 0.914, P < .001) and good interobserver agreement (r = 0.820, P < .001). In addition, good imaging–repeat imaging agreement (r = 0.811, P < .001) for CDI acquisition in 26 coronary segments in 10 subjects was also found (Fig 3).
Figure 3a:
Repeatability and reproducibility of CDI measurements with MR angiography. (a) Bland-Altman plot shows excellent intraobserver agreement between CDI measurements for reader 1 (r = 0.914), with low variability of CDI measurements. (b) Bland-Altman plot shows good interobserver agreement of CDI measurements between readers 1 and 2 (r = 0.820), with mild dispersion of CDI measurements. (c) Bland-Altman plot shows good imaging–repeat imaging agreement between CDI measurements for reader 1 (r = 0.811), with mild discrepancy of CDI measurements. Data points that appear outside the 1 standard deviation (SD) region may be due to the effect of signal loss on coronary lumen measurements.
Figure 3b:
Repeatability and reproducibility of CDI measurements with MR angiography. (a) Bland-Altman plot shows excellent intraobserver agreement between CDI measurements for reader 1 (r = 0.914), with low variability of CDI measurements. (b) Bland-Altman plot shows good interobserver agreement of CDI measurements between readers 1 and 2 (r = 0.820), with mild dispersion of CDI measurements. (c) Bland-Altman plot shows good imaging–repeat imaging agreement between CDI measurements for reader 1 (r = 0.811), with mild discrepancy of CDI measurements. Data points that appear outside the 1 standard deviation (SD) region may be due to the effect of signal loss on coronary lumen measurements.
Figure 3c:
Repeatability and reproducibility of CDI measurements with MR angiography. (a) Bland-Altman plot shows excellent intraobserver agreement between CDI measurements for reader 1 (r = 0.914), with low variability of CDI measurements. (b) Bland-Altman plot shows good interobserver agreement of CDI measurements between readers 1 and 2 (r = 0.820), with mild dispersion of CDI measurements. (c) Bland-Altman plot shows good imaging–repeat imaging agreement between CDI measurements for reader 1 (r = 0.811), with mild discrepancy of CDI measurements. Data points that appear outside the 1 standard deviation (SD) region may be due to the effect of signal loss on coronary lumen measurements.
Discussion
In the present study, we tested the feasibility of using 3D MR angiography to noninvasively measure coronary distensibility in older adults. The CDI in older adults with type 2 DM was significantly lower than that in subjects without DM. The increase in arterial stiffness assessed in patients with type 2 DM is consistent with the trend found in other central and peripheral arteries from similar studies of patients with DM (11).
According to results of epidemiologic studies, arterial stiffness is a reliable indicator of arterial aging that is independently predictive of future strokes and myocardial infarctions and has been associated with heart failure (12). The development of arterial aging may be accelerated by various traditional cardiovascular risk factors (eg, DM) (1). From a histologic perspective, increased arterial stiffness is determined by multiple factors related to physiologic or pathophysiologic processes. In general, the ratio of two matrix proteins, elastin and collagen, as well as their interactions with each other and other matrix constituents determines the stiffness of an artery. When a substantial reduction of elastin content and excessive synthesis and deposition of collagen are observed, the artery becomes stiffer owing to remodeling (1). Furthermore, increased formation of advanced glycation among adjacent collagen fibrils with nonenzymatic glycation and oxidation of free amino acids further strengthen and stiffen the intricate network of collagen (1). In addition, the stiffness of the arterial wall is also modulated by the vascular tone, which is under the control of endothelial function (1).
Coronary distensibility, which is a reflection of arterial stiffness, was reported to be assessed with multiple imaging methods in human hearts. With conventional angiography, Nahser et al (13) found reduced maximal coronary vasodilation and impaired regulation of coronary flow in patients with DM. Weissman et al (14) measured the coronary lumen of coronary arteries at end diastole and at early, mid-, and end systole with intravascular ultrasonography (US). They found that the coronary luminal diameter increased 2.1% and luminal area increased 8.1% during mid- and late systole in 32 patients with coronary artery disease (14). Vavuranakis et al (15) showed impaired reactivity to nitroglycerin in patients with DM compared with healthy control subjects by directly imaging coronary arteries with intravascular US. Ahmadi et al (16) demonstrated that CDI measured with computed tomographic angiography is inversely related to the severity of coronary artery disease. Because of the drawbacks of currently available modalities used to directly image the coronary arteries, noninvasive methods for evaluating CDI without radiation exposure are highly desired.
Terashima et al (17) used a 2D MR technique to evaluate luminal changes after the application of nitroglycerin in 20 healthy subjects and 12 patients with coronary artery disease. The authors reported a 23% increase in the coronary cross-sectional area as a response to induced vasodilation (17). Because a 2D MR imaging technique cannot automatically trace its target when the objective moves out of the preset 2D imaging plane, 3D MR techniques have emerged as promising methods with which to follow the movement and deformation of the coronary arteries in all three dimensions. In our study, the distensibility of coronary arteries during cardiac cycles without the application of medications was noninvasively assessed by using a 3D MR technique for the first time. Taking advantage of dual rest periods of cardiac motion, coronary lumina can be imaged in different stages of cardiac cycles and be exactly matched according to permanent anatomic references to precisely calculate CDI.
This feasibility study has some limitations. First, we did not compare lumen area measured on MR images to that obtained with a reference standard (eg, intravascular US or conventional angiography). Without signs or symptoms of cardiovascular disease, there was no clinical indication to justify invasive tests in our subjects. However, previous studies have proved that measurement of the coronary lumen area is more accurate with MR angiography than with conventional angiography (17,18). In our study, the observed low intraobserver, interobserver, and imaging–repeat imaging variability also showed that measurements of lumen area were repeatable and reliable. Second, we used peripheral pulse pressure but not intracoronary pulse pressure to calculate CDI. Because intracoronary or central blood pressure is unavailable in noninvasive studies, some authors used “estimated central pulse pressure,” which was estimated as “0.77 × peripheral pulse pressure” (16,19–21), to calculate arterial distensibility. We believe that it is also fair to compare CDI by directly applying peripheral blood pressure in our study without multiplying a constant (0.77) for all subjects. Third, owing to the limited spatial resolution and to the contrast resolution characteristics of whole-heart MR angiography, some lesions that may possibly affect local CDI, such as small plaques and calcifications, could not be identified and therefore could have had an effect on CDI measurements. Because of this reason, the standard deviation of CDI appears high in the present study because the change in cross-sectional area in coronary segments with atherosclerotic plaques was significantly lower than that in the segments without plaques (22). Fourth, we did not adjust for many traditional cardiovascular risk factors, such as serum cholesterol level and cigarette smoking history, when comparing the CDIs between different populations. This work was designed as a feasibility study with a relatively small sample size. A prospective larger patient study is warranted to evaluate the role of the CDI in the prediction of cardiovascular events after adjusting for all involved risk factors. Fifth, this method of measuring CDI relies on stable rest periods of cardiac motion during both end systole and middiastole. For those individuals who do not have long rest periods, cardiac motion will substantially degrade the quality of the coronary MR angiograms and result in inaccurate results.
In conclusion, coronary MR angiography is a reproducible and repeatable method for noninvasively assessing coronary distensibility during cardiac cycles and is able to depict significant differences in coronary stiffness between older patients with type 2 DM and healthy aging control subjects. Whole-heart MR angiography may offer a useful means for evaluating cardiovascular aging in epidemiologic research studies.
Advance in Knowledge.
• Whole-heart coronary artery MR angiography is a repeatable and reproducible method for measuring coronary distensibility during cardiac cycles.
Implication for Patient Care.
• Coronary distensibility, which can be noninvasively assessed with MR angiography, has the potential to become a useful index of cardiovascular aging in cardiovascular and/or geriatric medicine.
Disclosures of Potential Conflicts of Interest: K.L. No potential conflicts of interest to disclose. D.M.L.J. No potential conflicts of interest to disclose. Y.L. No potential conflicts of interest to disclose. X.B. Financial activities related to the present article: none to disclose. Financial activities not related to the present article: is an employee of Siemens Healthcare. Other relationships: none to disclose. D.L. No potential conflicts of interest to disclose. J.C.C. Financial activities related to the present article: none to disclose. Financial activities not related to the present article: institution received money from Siemens for grant/grants pending; received payment for lectures including service on speakers bureaus from Lantheus Medical Imaging. Other relationships: none to disclose.
Received March 18, 2011; revision requested May 2; revision received May 25; accepted May 27; final version accepted June 10.
See also the editorial by Fernandes and Lima in this issue
Funding: This research was supported by NIH (grant R01HL089695).
Abbreviations:
- CDI
- coronary distensibility index
- DM
- diabetes mellitus
- LAD
- left anterior descending
- LM
- left main
- RCA
- right coronary artery
- 3D
- three-dimensional
- 2D
- two-dimensional
References
- 1.Najjar SS, Scuteri A, Lakatta EG. Arterial aging: is it an immutable cardiovascular risk factor? Hypertension 2005;46(3):454–462 [DOI] [PubMed] [Google Scholar]
- 2.Aatola H, Koivistoinen T, Hutri-Kähönen N, et al. Lifetime fruit and vegetable consumption and arterial pulse wave velocity in adulthood: the Cardiovascular Risk in Young Finns Study. Circulation 2010;122(24):2521–2528 [DOI] [PubMed] [Google Scholar]
- 3.Zhang J, Li Y, Wang Y, et al. Arterial stiffness and asymptomatic intracranial large arterial stenosis and calcification in hypertensive Chinese. Am J Hypertens 2011;24(3):304–309 [DOI] [PubMed] [Google Scholar]
- 4.Maldonado J, Pereira T, Polónia J, et al. Arterial stiffness predicts cardiovascular outcome in a low-to-moderate cardiovascular risk population: the EDIVA (Estudo de DIstensibilidade VAscular) project. J Hypertens 2011;29(4):669–675 [DOI] [PubMed] [Google Scholar]
- 5.Cheung YF, Chan GC, Ha SY. Arterial stiffness and endothelial function in patients with beta-thalassemia major. Circulation 2002;106(20):2561–2566 [DOI] [PubMed] [Google Scholar]
- 6.Redheuil A, Yu WC, Wu CO, et al. Reduced ascending aortic strain and distensibility: earliest manifestations of vascular aging in humans. Hypertension 2010;55(2):319–326 [DOI] [PMC free article] [PubMed] [Google Scholar]
- 7.Cecelja M, Chowienczyk P. Dissociation of aortic pulse wave velocity with risk factors for cardiovascular disease other than hypertension: a systematic review. Hypertension 2009;54(6):1328–1336 [DOI] [PubMed] [Google Scholar]
- 8.Al-Mallah MH, Nasir K, Katz R, et al. Thoracic aortic distensibility and thoracic aortic calcium (from the Multi-Ethnic Study of Atherosclerosis [MESA]). Am J Cardiol 2010;106(4):575–580 [DOI] [PMC free article] [PubMed] [Google Scholar]
- 9.Wang Y, Vidan E, Bergman GW. Cardiac motion of coronary arteries: variability in the rest period and implications for coronary MR angiography. Radiology 1999;213(3):751–758 [DOI] [PubMed] [Google Scholar]
- 10.Miao C, Chen S, Macedo R. et al. Positive remodeling of the coronary arteries detected by magnetic resonance imaging in an asymptomatic population: MESA (Multi-Ethnic Study of Atherosclerosis). J Am Coll Cardiol 2009;53(18):1708–1715 [DOI] [PMC free article] [PubMed] [Google Scholar]
- 11.Urbina EM, Kimball TR, Khoury PR, Daniels SR, Dolan LM. Increased arterial stiffness is found in adolescents with obesity or obesity-related type 2 diabetes mellitus. J Hypertens 2010;28(8):1692–1698 [DOI] [PMC free article] [PubMed] [Google Scholar]
- 12.Kang S, Fan HM, Li J, et al. Relationship of arterial stiffness and early mild diastolic heart failure in general middle and aged population. Eur Heart J 2010;31(22):2799–2807 [DOI] [PubMed] [Google Scholar]
- 13.Nahser PJ, Jr, Brown RE, Oskarsson H, Winniford MD, Rossen JD. Maximal coronary flow reserve and metabolic coronary vasodilation in patients with diabetes mellitus. Circulation 1995;91(3):635–640 [DOI] [PubMed] [Google Scholar]
- 14.Weissman NJ, Palacios IF, Weyman AE. Dynamic expansion of the coronary arteries: implications for intravascular ultrasound measurements. Am Heart J 1995;130(1):46–51 [DOI] [PubMed] [Google Scholar]
- 15.Vavuranakis M, Stefanadis C, Triandaphyllidi E, Toutouzas K, Toutouzas P. Coronary artery distensibility in diabetic patients with simultaneous measurements of luminal area and intracoronary pressure: evidence of impaired reactivity to nitroglycerin. J Am Coll Cardiol 1999;34(4):1075–1081 [DOI] [PubMed] [Google Scholar]
- 16.Ahmadi N, Shavelle D, Nabavi V, et al. Coronary distensibility index measured by computed tomography is associated with the severity of coronary artery disease. J Cardiovasc Comput Tomogr 2010;4(2):119–126 [DOI] [PubMed] [Google Scholar]
- 17.Terashima M, Meyer CH, Keeffe BG, et al. Noninvasive assessment of coronary vasodilation using magnetic resonance angiography. J Am Coll Cardiol 2005;45(1):104–110 [DOI] [PubMed] [Google Scholar]
- 18.Scheidegger MB, Stuber M, Boesiger P, Hess OM. Coronary artery imaging by magnetic resonance. Herz 1996;21(2):90–96 [PubMed] [Google Scholar]
- 19.Camacho F, Avolio A, Lovell NH. Estimation of pressure pulse amplification between aorta and brachial artery using stepwise multiple regression models. Physiol Meas 2004;25(4):879–889 [DOI] [PubMed] [Google Scholar]
- 20.Lamia B, Teboul JL, Monnet X, et al. Contribution of arterial stiffness and stroke volume to peripheral pulse pressure in ICU patients: an arterial tonometry study. Intensive Care Med 2007;33(11):1931–1937 [DOI] [PubMed] [Google Scholar]
- 21.Munir S, Guilcher A, Kamalesh T, et al. Peripheral augmentation index defines the relationship between central and peripheral pulse pressure. Hypertension 2008;51(1):112–118 [DOI] [PubMed] [Google Scholar]
- 22.Ge J, Erbel R, Gerber T, et al. Intravascular ultrasound imaging of angiographically normal coronary arteries: a prospective study in vivo. Br Heart J 1994;71(6):572–578 [DOI] [PMC free article] [PubMed] [Google Scholar]


