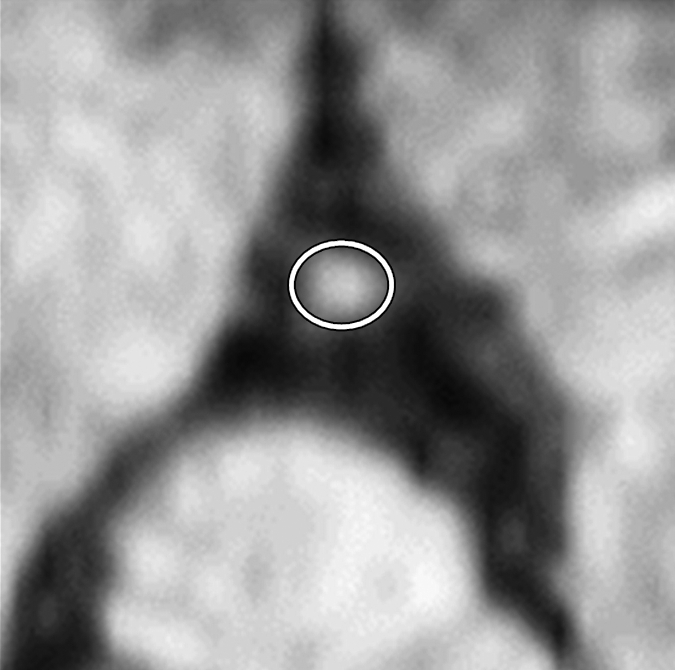
Figure 2e:

Images in an 84-year-old man with an 8-year history of type 2 DM. Peripheral blood pressure was 135/70 mm Hg (pulse pressure = 65 mm Hg). (a) Longitudinal view of LM artery in middiastole. (b) Longitudinal view of LM artery in end systole. (c) Transverse view of lumen in middiastole. (d) Transverse view of lumen in end systole. (e) Zoomed view during diastole shows lumen contour (area, 13.74 mm2). (f) Zoomed view during systole shows lumen contour (area, 16.35 mm2). CDI = [(16.35 − 13.74)/(13.74/65)] × 1000 = 2.92 mm Hg−1. LV = left ventricle. Lines in a and b represent locations of transverse views of vessel on its longitudinal view.
