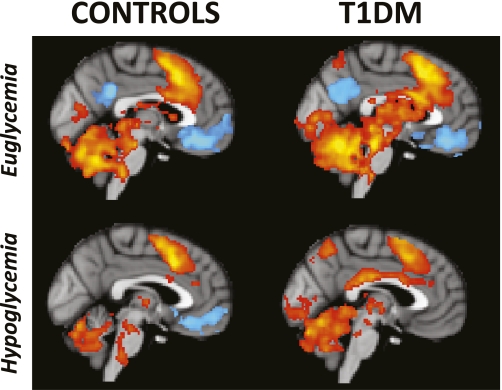
FIG. 5.
BOLD activation and deactivation during the WMT in type 1 diabetic (T1DM) and control subjects during euglycemia and hypoglycemia. Statistical parametric maps of regions of greatest activation during WMTs vs. control tasks (functional activations in the red-to-yellow color scale) and regions of decreased activation during the WMTs vs. resting tasks (functional deactivations in the blue color scale) are overlaid on the MNI-152 standard brain anatomy (gray scale). The threshold for activations and deactivations was P < 0.05 after correction for multiple comparisons using the cluster-based threshold method (see research design and methods). During hypoglycemia, patients with type 1 diabetes exhibit less deactivation than control subjects. (A high-quality digital representation of this figure is available in the online issue.)

