Abstract
Bacillus cereus Hemolysin BL enterotoxin, a ternary complex of three proteins, is the causative agent of food poisoning and requires all three components for virulence. The X-ray structure of the binding domain of HBL suggests that it may form a pore similar to other soluble channel forming proteins. A putative pathway of pore formation is discussed.
Keywords: HBL-B, Hemolysin, pore-formation, β-hairpain
Introduction
Bacillus cereus plays a major role in food borne illnesses, such as emesis and diarrhea.1,2 It secretes a diarrheal enterotoxin, which is known as hemolysin BL (HBL). HBL is a well characterized B. cereus toxin,3,4 composed of three distinct protein components, B (41 kDa), L1 (38.2 kDa), and L2 (43.5 kDa), which together possess hemolytic, cytotoxic, dermonecrotic, and vascular permeability activities. These components have similar isoelectric points and molecular weights to those of the multicomponent enterotoxin described by Thompson et al. .5 All these components individually bind to the membrane but the kinetics are different.6 Also, it is suggested that HBL components form pores after the three proteins form a complex. In this sense it may be similar to complement lesions, also called membrane attack complexes (MACs). There are some reports suggesting that a unique hemolysin (HBL) may be responsible for the diarrheal form of B. cereus food poisioning.7,8,9 This enterotoxin is toxic only as a ternary complex. Neither any binary combination of the components nor any individual component is toxic in its own right. To date, there are no reports on structure determinations of any of the hemolysin BL components. Herein, we report the crystal structure of B component of hemolysin (39 kDa), hereafter called HBL-B, from Bacillus cereus and compare it with a distantly related hemolysin from E. coli (HlyE).
Materials and Methods
Gene cloning, expression and protein purification
The target gene HBLA_BACCE for HBL-B was cloned from Bacillus cereus genomic DNA using primers AGTGAAATTGAACAAACGAAC (forward) and ATTTTTGTGGAGTAACAGTTTC (reverse) in pSGX4 (BS) vector. Se-Met protein expression/purification was performed as described previously.10 Purified HBL-B protein yield was ~8.65 mg/l of culture medium.
Crystallization, Data Collection, and Structure Determination
HBL-B, was crystallized by sitting drop vapor diffusion (1µL of 15 mg/ml protein and 1µL of reservoir solution, containing 30% PEG 4000, 0.1M Tris pH 8.5 and 0.2M lithium chloride). Thick plate-like crystals (typical dimensions: 0.2 × 0.3 × 0.2mm3) were obtained within days. Crystals belong to monoclinic space group C2, with a calculated Matthews coefficient of 2.1 Å3/Da, assuming one molecule/asymmetric unit. Crystals were flash frozen by immersion in liquid nitrogen following addition of 20% (v/v) glycerol to the mother liquor. Diffraction data were recorded under standard cryogenic conditions at X12C beamline of the National Synchrotron Light Source (NSLS), Brookhaven National Laboratory, and integrated and scaled using HKL-2000.11 The structure was determined at 2Å resolution via single-wavelength anomalous dispersion using Se-Met substituted protein. All seven possible selenium atom positions were located by SOLVE.12 Use of SHARP13 for phase refinement and density modification yielded an experimental electron density map suitable for use with ARP/wARP14 for automated model building. 93% of the polypeptide chain was built without manual intervention. The remainder of the polypeptide chain was built manually by using O.15 The final model was refined with CNS.16 In the initial stage of refinement, the R factor and RFree were reduced to 0.26 and 0.30, respectively. Prior to the final stage of refinement, 199 water molecules were located in difference Fourier syntheses. The final model contains 346 residues and 199 water molecules. The final R factor and RFree value converged to 0.21 and 0.25, respectively. Data collection and refinement statistics are provided in Table 1. A Ramachandran plot analysis performed with PROCHECK17 showed that 94.8% residues fell in the most favorable region and 5.2% in generously allowed region. Atomic coordinates and structure factors have been submitted to the Protein Data Bank (PDB ID: 2NRJ). All figures were prepared with PyMol.18
Table 1.
Crystal data, phasing and refinement statistics
| Unit cell dimensions (Å, °) | a=127.8, b=28.5, c=89.7; β = 105.0 |
| Space group | C2 |
| Data Collection Statistics | |
| Wavelength (Å) | 0.9772 |
| Temperature (K) | 100 |
| Resolution range (Å) | 26.05-2.03 |
| Resolution range(outermost shell) | 2.10-2.03 |
| No. of unique reflections | 20797 (1974) |
| Completeness (%) | 99.7 (97) |
| Mean I/σ(I) | 17.5 (2.1) |
| Mean redundancy | 7.2 (6.1) |
| Rmerge1 | 0.085 (0.27) |
| Mosaicity (°) | 0.3 |
| Solvent content | 40 |
| Matthews coefficients (Å3/Da) | 2.1 |
| Phasing Statistics | |
| Phasing power2 (ano) | 1.56 |
| FOM3: | 0.40 |
| FOM After solvent flattening | 0.90 |
| Refinement Statistics | |
| No. of reflections (work) | 19370 |
| No. of reflections (test) | 990 |
| 4Rfactor/5Rfree | 0.213/0.257 |
| Resolution range (Å) | 26.05-2.03 |
| Completeness(Working+Test) (%) | 97.7 |
| RMSD for bond lengths (Å) | 0.006 |
| RMSD for bond angles (Å) | 1.10 |
| B-values for main-chain (Å2) | 20.0 |
| B-values for side-chain (Å2) | 23.9 |
| No. of non-H atoms | 2653 |
| No. of water molecules | 199 |
Rmerge1= ΣjΣi|Ij,i−〈Ij〉 /ΣjΣi| Ij,i| where <Ij> is the mean intensity of symmetry-related reflections, Ij,i.
2Phasing power and 3FOM (Figure of merit) are as defined in SHARP.
Rfactor =Σ | Fobs−Fcalc | / Σ | Fobs | where Fcalc and Fobs are the calculated and observed structure factor amplitudes, respectively.
Rfree= as for Rfactor, but for 5% of the total reflections chosen at random and omitted from refinement.
Results and Discussion
Overall Structure of HBL-B
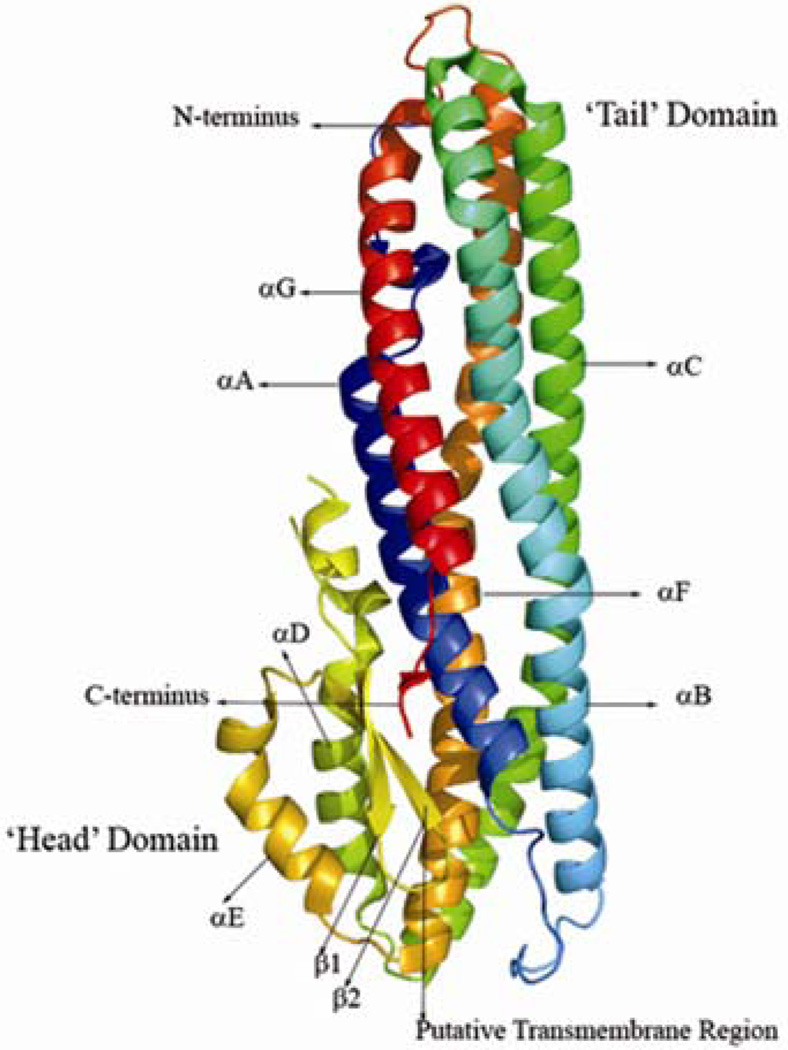
The structure of HBL-B is predominantly α-helical with approximate dimensions of 90 Å × 40 Å × 30 Å. There are seven major helices in the polypeptide chain, denoted αA (Glu19-Lys45), αB (Asp61-Asn114), αC (Gly118-Asn174), αD (Asp177-Leu189), αE (Arg225-Gln240), αF (Tyr244-Ala297), and αG (Lys307-Lys335) with few shorter α-helical segments and a short C-terminal β-strand. The molecule consists of two sub domains, the tail domain made up of a long helical bundle and a small α/β head domain. The head domain includes a β-hairpin, αD, αE, and two short α-helices of 4 residues each. The tail domain consists of the remaining five α-helices αA, αB, αC, αF and αG (Figure 1). The head domain is packed against the five long helices of the tail domain. There are a few distinct kinks present at the following dipeptides: Lys83-Val84 (within αB), Leu189-Gly190 (αD), Leu228-Gly229 (αE), and Lys310-Pro311 (αG). Most of the residues in the molecule are well ordered, with the exception of Ser1, Ser200, Asp201, and Thr341-Lys346, where the experimental electron density was poorly defined.
Figure 1.
Ribbon representation of HBL-B monomer showing the α-helical bundle architecture with five long α-helices, labeled αA, αB, αC, αF, and αG comprising the ‘Tail’ domain, and shorter α-helices, labeled αD and αE, and strands β1 and β2 forming the ‘Head’ domain. N- and C-termini and the putative transmembrane region are labeled. This Figure was prepared with PYMOL.
Related Toxin structures
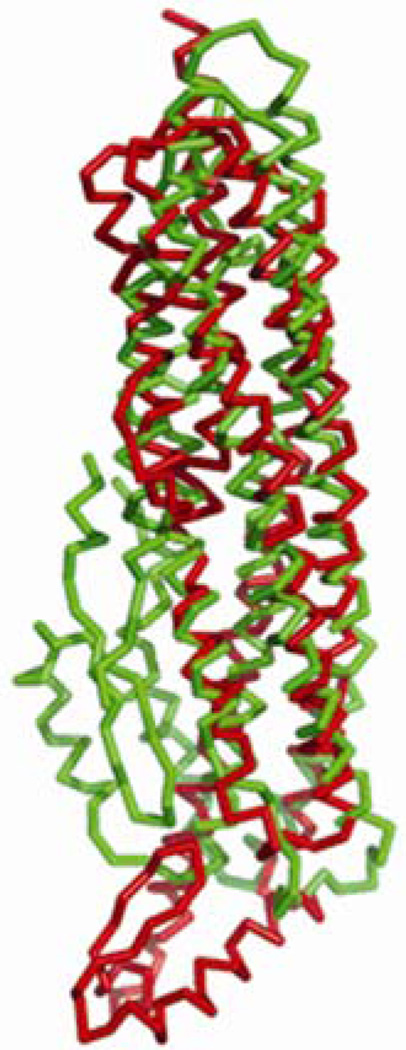
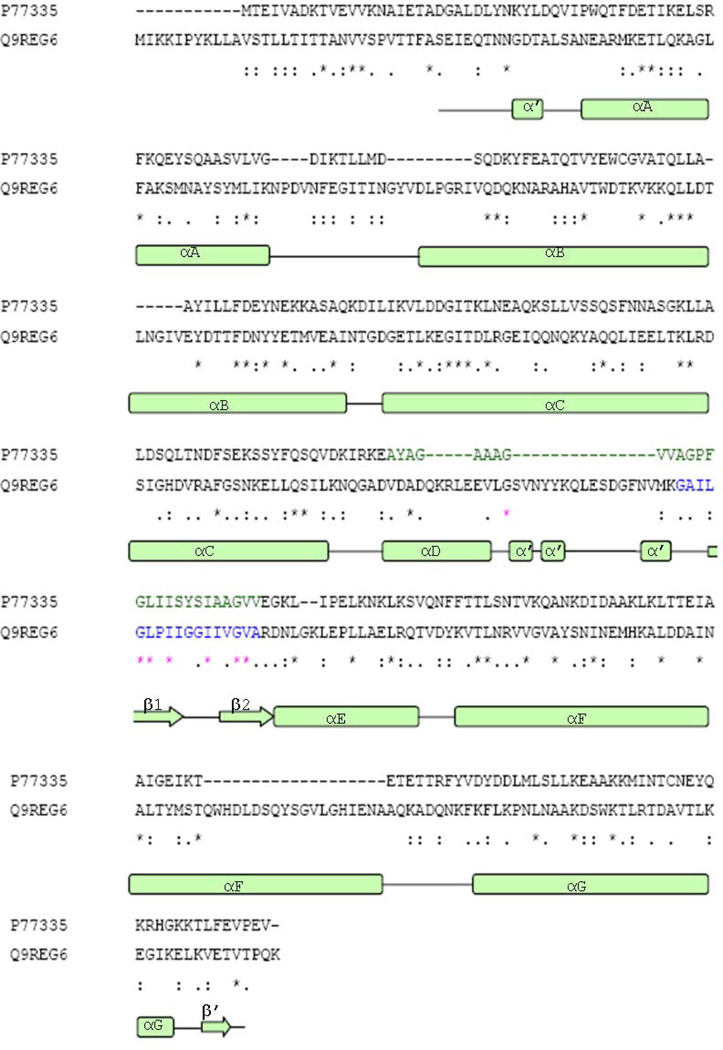
The long helical bundle and elongated shape of the molecule is reminiscent of other water soluble, channel forming proteins of known structure, such as colicin, aerolysin, the translocation domain of botulinum neurotoxin, etc. Notwithstanding this gross structural similarity, none of these proteins shares significant sequence homology with HBL-B. A DALI 19 search performed with the final model (PDB: 2NRJ) identified some structurally similar proteins in the Protein Data Bank. The closest structural match is HlyE (PDB: 1QOY), a hemolysin from E. coli, with a Z-score of 13.7, sequence identity=16%, and a root mean-square deviation (RMSD) of 3.8Å between 236 α-carbon atom pairs (Figures 2 and 3). All other DALI server matches, gave a Z-score of less than 10, which suggests no significant fold similarity.
Figure 2.
Superposition of HBL-B (green) with HlyE (red). Major structural differences are observed in the head sub-domain region, which adopts distinctive orientations.
Figure 3.
Sequence alignment of B. cereus (Q9REG6) HBL-B and E. Coli (P77335) HlyE. Sequence identities and similarities are provided in the bottom row: (*) identical, (:) conserved and (.) semi-conserved. Secondary structure elements of HBL-B are depicted below the sequence alignment. α’ and β’ are labeled as smaller secondary structure elements. The putative transmembrane regions of both HBL-B and HlyE are shown in highlighted blue and red color, respectively.
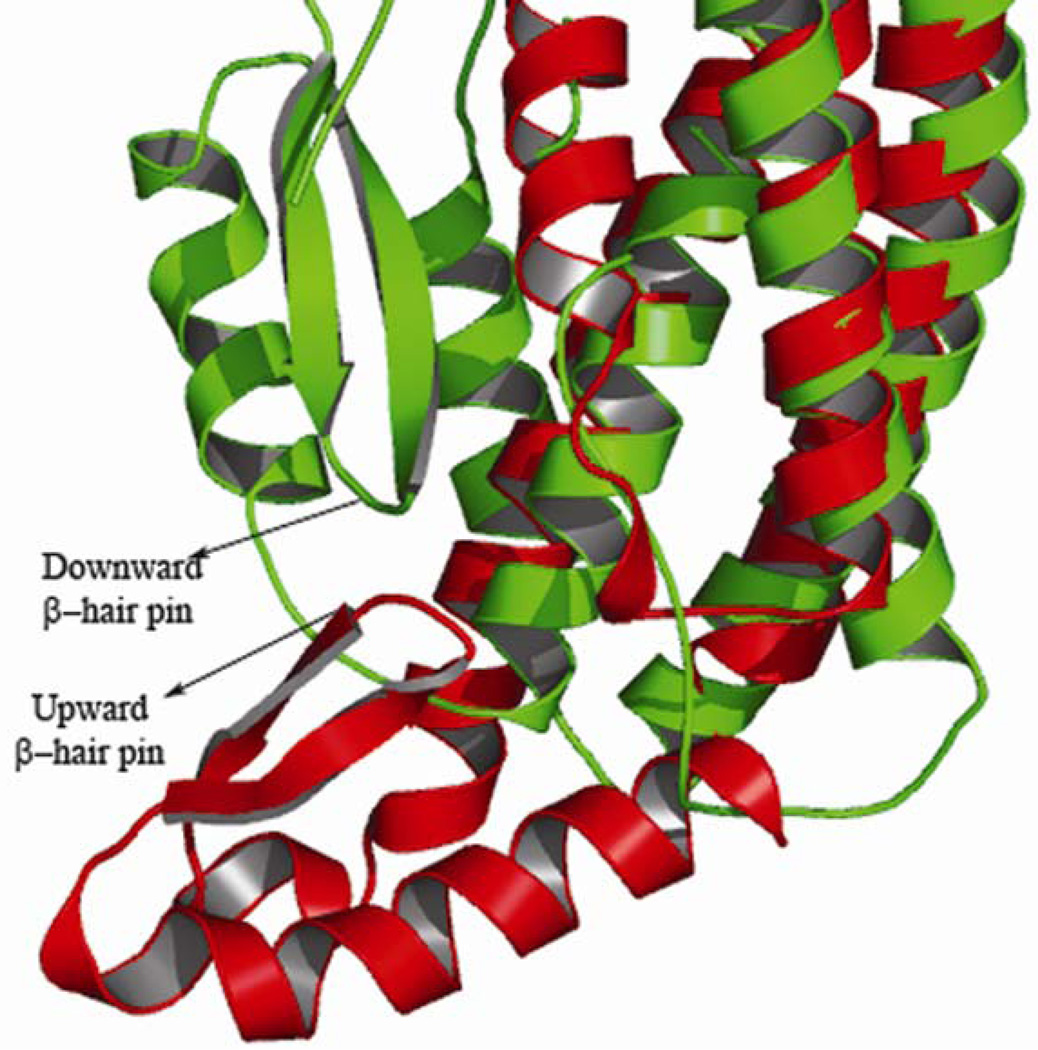
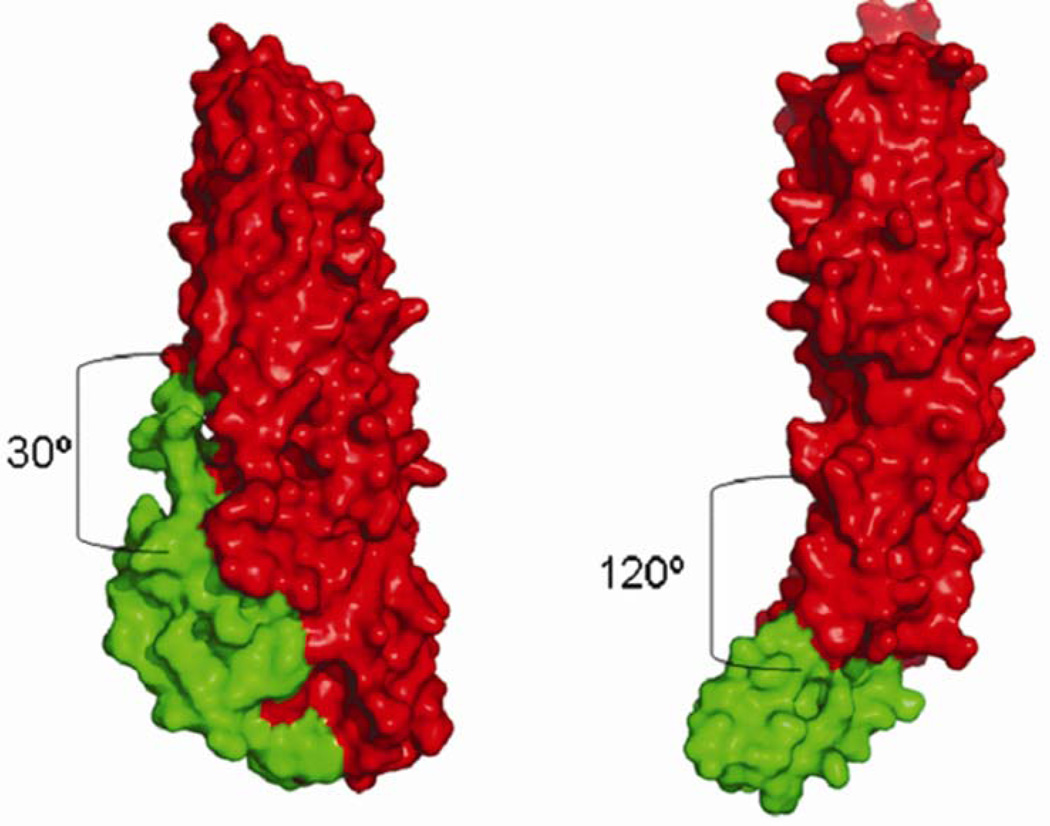
The structural similarity between B. cereus HBL-B and E. coli hemolysin is remarkable despite low sequence homology.20 The tail domains and the head domains of the two proteins are similar, but the orientation of the head domain with respect to the tail domain differs substantially between the two proteins. The head domain is turned upward and makes interactions with the tail domain in HBL-B, whereas it is turned downward in HlyE and makes only minimal interactions with its tail domain. The interdomain angle for HBL-B is ~30°, whereas it is ~120° in HlyE (Figures 4 and 5). Some toxins for which structures have been reported, such as aerolysin,21 perfringolysin,22 and staphylococcal LukF,23 have similarly elongated molecular architectures, albeit composed of β-sheets instead of α-helical bundles. There are also some examples 24–26 in the literature in which α-helices are involved in membrane translocation and pore formation. None of these latter examples appear to be evolutionarily related to HBL-B. Although HBL-B and HlyE do not bear significant sequence similarity, they are indeed similar in structure suggesting common mode of pore formation.
Figure 4.
Superimposed ribbon representations of the head sub-domain regions of HBL-B (green) and 1QOY (red). Two different orientations of β-hair pin are observed. Downward and upward β-hairpin orientations of HBL-B and HlyE are labeled
Figure 5.
Molecular surface view of HBL-B (left) and HlyE (right). Red and green denotes the ‘Tail’ and ‘Head’ domains, respectively. Calculated interdomain angles of 30°and 120° are also depicted.
Transmembrane region
The Tmap 27 server predicted that the transmembrane region of HBL-B spans residues 232–260. This region falls within the head domain and the 17 residue segment (GAILGLPIIGGIIVGVA) forming the only β-hairpin present in the structure is part of this region. A similar hydrophobic segment forming a β-hairpin was previously identified as the transmembrane region in HlyE.20 Despite this similarity to HlyE, the precise orientation of the β-hairpin differs between these two bacterial toxins.
Pore formation
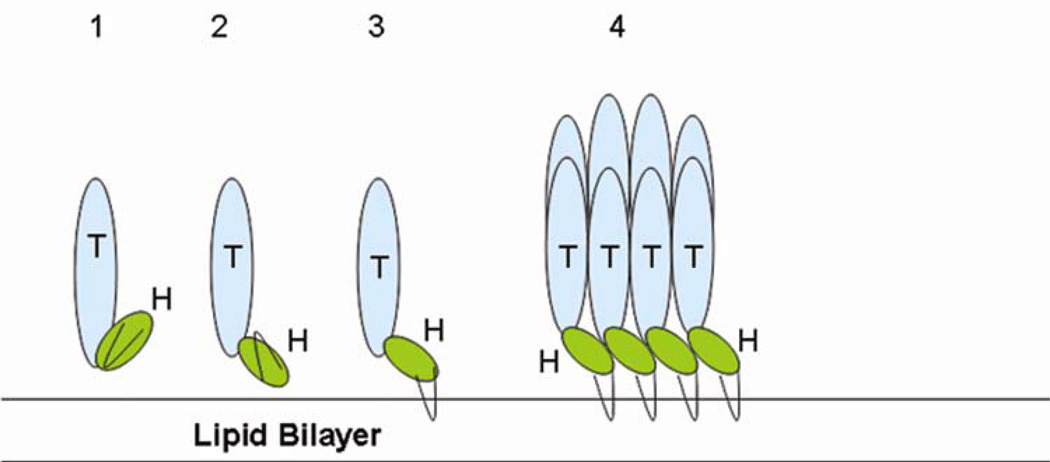
Some E. coli. hemolysin pore formation hypotheses have been published, but more than one oligomerization state has been proposed 20,28,29 including both octameric and tridecameric. EM reconstruction of the HlyE oligomer has provided information regarding the shape and size of the pore. The estimated pore thickness as obtained from EM reconstruction exceeds that of the isolated monomer, which suggests a conformational change accompanies oligomerization. Given that the β-hairpin enters the membrane, it is possible that it swings out when interacting with the lipid bilayer, thereby extending the length of each protomer. If HBL-B were to form an octameric pore, at least two conformational changes would be required. We propose that first the head domain would undergo a 90° rotation, thereby more closely resembling the HlyE conformation, and, second, the β-hairpin would swing out to contact the membrane as suggested for HlyE.
Mechanism of toxin action
Preliminary analytical gel filtration studies with HBL-B in the presence of detergents mimicking lipids demonstrated formation of an oligomer of molecular weight consistent with either a heptamer or an octamer (data not shown). Given the structural similarity of HBL-B and HlyE and EM evidence of HlyE octamerization, we propose the pathway for HBL pore formation depicted in Figure 6.
Figure 6.
Stepwise model for HBL-B oligomerization. ‘H’ and ‘T’ represent Head domain and Tail domain, respectively. The β-hairpin is shown in black.
Our model of HBL toxin pore formation consists of a series of intermediate states starting sequentially from the crystallographically-observed HBL-B monomer conformation to a more extened HlyE-like monomer conformation followed by modification of the orientation of the HBL-B β-hairpin rendering the protein competent for insertion into the membrane, as depicted in Figure 6. Thereafter, two-dimensional diffusion would permit multiple copies of the membrane embedded form of HBL-B to oligomerize and form a pore (Figure 6). It is also possible that oligomerization precedes membrane insertion. Since pore formation is always preceded by pH change, one or more of the steps depicted in Figure 6 may be induced by acidification.
The model proposed here is based on the structural similarity of HBL-B with HlyE. Here, we have proposed oligomerization of B component alone to form a pore. It has also been proposed that the three HBL components may form a membrane attack complex (MAC) to form a pore. 6 Future crystallographic studies on the HBL complex may shed light on the role of L1 and L2 on pore formation.
Biological implications of the HBL-B structure
It is remarkable that HlyE is hemolytic in its own right, whereas HLB-B requires both L1 and L2 components for hemolysis. It may be that L1 and L2 help to stabilize the head domain of HLB-B in a membrane-insertion/competent conformation. Alternatively, L1 and L2 could induce one or more conformational changes in HBL-B. Once a pore has formed L1 and L2 could then enter the cell as seen in anthrax 30. If true, this scenario is somewhat more complex than seen during anthrax induced hemolysis, because this toxin occurs as a binary complex, whereas HBL is toxic only when it is a ternary complex. L1 and L2 may play dual roles – changing the conformation of the head domain and also causing toxicity. Further structural studies of pore formation and the heterooligomeric HBL complex are required to better understand the mechanism of this system.
We have reported herein the first structure of the B component of hemolysin BL from B. cereus. Despite low sequence identity, it resembles the structure of hemolysin E from E. coli. It has a novel elongated structure and exhibits significant conformational differences with respect to the E. coli hemolysin toxin. The current structure determined at high resolution has provided a structural framework with which to plan experiments to better understand B. cereus enterotoxin pore formation and hemolysis. Further structural studies with lytic components L1 and L2 both alone and bound to HBL-B will almost certainly prove rewarding.
Coordinates have been deposited in the Protein Data Bank (RCSB: www.rcsb.org/pdb) with accession code 2NRJ. .
Acknowledgements
Research was supported by a U54 award from the National Institute of General Medical Sciences to the NYSGXRC (GM074945; PI: Stephen K. Burley) under DOE Prime Contract No. DEAC02-98CH10886 with Brookhaven National Laboratory. We gratefully acknowledge data collection support from beamline X12C (NSLS). Financial support for X12C beamline comes principally from the Offices of Biological and Environmental Research and of Basic Energy Sciences of the US Department of Energy, and from the National Center for Research Resources of the National Institutes of Health. We thank Dr. Tyagi for helpful discussions.
References
- 1.Turnbull PCB. Bacillus cereus toxins. Pharmacol Ther. 1981;13:453–505. doi: 10.1016/0163-7258(81)90026-7. [DOI] [PubMed] [Google Scholar]
- 2.Turnbull PCB, Kramer JM, Jorgensen K, Gilbert RJ, Melling J. Properties and production characteristics of vomiting, diarrheal and necrotizing toxins of Bacillus cereus. Am J Clin Nutr. 1979;32:219–228. doi: 10.1093/ajcn/32.1.219. [DOI] [PubMed] [Google Scholar]
- 3.Heinrichs JH, Beecher DJ, Macmillan JD, Zilinskas BA. Molecular cloning and characterization of the hblA gene encoding the B component of Hemolysin BL from Bacillus cereus. J Bacteriol. 1993;175:6760–6766. doi: 10.1128/jb.175.21.6760-6766.1993. [DOI] [PMC free article] [PubMed] [Google Scholar]
- 4.Ryan PA, Macmillan JD, Zilinskas BA. Molecular cloning and characterization of the genes encoding the L1 and L2 components of Hemolysin BL from Bacillus cereus. J Bacteriol. 1997;179:2551–2556. doi: 10.1128/jb.179.8.2551-2556.1997. [DOI] [PMC free article] [PubMed] [Google Scholar]
- 5.Thompson NE, Ketterhagen MJ, Bergdoll MS, Schantz EJ. Isolation and some properties of an enterotoxin produced by Bacillus cereus. Infect Immun. 1984;43:887–894. doi: 10.1128/iai.43.3.887-894.1984. [DOI] [PMC free article] [PubMed] [Google Scholar]
- 6.Beecher DJ, Wong ACL. Tripartite Hemolysin BL from Bacillus cereus. Hemolytic analysis of component interactions and a model for its characteristic paradoxical zone phenomenon. J Biol Chem. 1997;272:233–239. doi: 10.1074/jbc.272.1.233. [DOI] [PubMed] [Google Scholar]
- 7.Beecher DJ, Macmillan JD. A novel bicomponent hemolysin from Bacillus cereus. Infect Immun. 1990;58:2220–2227. doi: 10.1128/iai.58.7.2220-2227.1990. [DOI] [PMC free article] [PubMed] [Google Scholar]
- 8.Beecher DJ, Macmillan JD. Characterization of the components of hemolysin BL from Bacillus cereus. Infect Immun. 1991;59:1778–1784. doi: 10.1128/iai.59.5.1778-1784.1991. [DOI] [PMC free article] [PubMed] [Google Scholar]
- 9.Beecher DJ, Schoeni JL, Wong ACL. Enterotoxic activity of Hemolysin BL from Bacillus cereus. Infect Immun. 1995;63:4423–4428. doi: 10.1128/iai.63.11.4423-4428.1995. [DOI] [PMC free article] [PubMed] [Google Scholar]
- 10.Agarwal R, Bonanno JB, Burley SK, Swaminathan S. Structure determination of FMN reductase from Pseudomonas aeruginosa PA01 using sulfur Anomalous signal. Acta Crystallogr D Biol Crystallogr. 2006;62:383–391. doi: 10.1107/S0907444906001600. [DOI] [PMC free article] [PubMed] [Google Scholar]
- 11.Otwinowski Z, Minor W. Processing of X-ray diffraction data collected in oscillation mode. Methods Enzymol. 1997;276:307–326. doi: 10.1016/S0076-6879(97)76066-X. [DOI] [PubMed] [Google Scholar]
- 12.Terwilliger TC, Berendzen J. Automated MAD and MIR structure solution. Acta Crystallogr D Biol Crystallogr. 1999;55:849–861. doi: 10.1107/S0907444999000839. [DOI] [PMC free article] [PubMed] [Google Scholar]
- 13.Fortelle EDL, Bricogne G. Maximum-likelihood heavy atom parameter refinement in the MIR and MAD methods. Methods Enzymol. 1997;276:472–493. doi: 10.1016/S0076-6879(97)76073-7. [DOI] [PubMed] [Google Scholar]
- 14.Lamzin VS, Perrakis A, Wilson KS. The ARP/WARP suite for automated construction and refinement of protein models. In: Rossmann MG, Arnold E, editors. Int. Tables for Crystallography. The Netherlands: Kluwer Academic Publishers; pp. 720–722. [Google Scholar]
- 15.Jones TA, Zou JY, Cowan SW, Kjeldgaard M. Improved methods for the building of protein models in electron density maps and the location of errors in these models. Acta Crystallogr A. 1993;47:110–119. doi: 10.1107/s0108767390010224. [DOI] [PubMed] [Google Scholar]
- 16.Brunger AT, Adams PD, Clore GM, DeLano WL, Gros P, Grosse-Kunstleve RW, Jiang JS, Kuszewski J, Nilges M, Pannu NS, Read RJ, Rice LM, Simonson T, Warren GL. Crystallography & NMR system: A new software suite for macromolecular structure determination. Acta Crystallogr D Biol Crystallogr. 1998;54:905–921. doi: 10.1107/s0907444998003254. [DOI] [PubMed] [Google Scholar]
- 17.Laskowski RA, MacArthur MW, Moss DS, Thornton JM. PRO-CHECK: a program to check the stereochemical quality of protein structures. J Appl Cryst. 1993;26:283–291. [Google Scholar]
- 18.DeLano WL. The PyMOL Molecular Graphics System. San Carlos, CA: Delano Scientific LLC; 2006. [Google Scholar]
- 19.Holm L, Sander C. Protein structure comparison by alignment of distance matrices. J Mol Biol. 1993;233:123–138. doi: 10.1006/jmbi.1993.1489. [DOI] [PubMed] [Google Scholar]
- 20.Wallace AJ, Stillman TJ, Atkins A, Jamieson SJ, Bullough PA, Green J, Artymiuk PJ. E. coli Hemolysin E (HlyE, ClyA, SheA): X-ray crystal structure of the toxin and observation of membrane pores by electron microscopy. Cell. 2000;100:265–276. doi: 10.1016/s0092-8674(00)81564-0. [DOI] [PubMed] [Google Scholar]
- 21.Parker MW, Buckley JT, Postma JPM, Tucker AD, Leonard K, Pattus F, Tsernoglou D. Structure of the Aeromonas toxin proaerolysin in its water-soluble and membrane-channel states. Nature. 1994;367:292–295. doi: 10.1038/367292a0. [DOI] [PubMed] [Google Scholar]
- 22.Rossjohn J, Feil SC, McKinstry WJ, Tweten RK, Parker MW. Structure of a cholestrol-binding, thiol-activated cytolysin and a model of its membrane form. Cell. 1997;89:685–692. doi: 10.1016/s0092-8674(00)80251-2. [DOI] [PubMed] [Google Scholar]
- 23.Olson R, Nariya H, Yokota K, Kamio Y, Gouaux E. Crystal structure of Staphylococcal LukF delineates conformational changes accompanying formation of a transmembrane channel. Nat Struct Biol. 1999;5:134–140. doi: 10.1038/5821. [DOI] [PubMed] [Google Scholar]
- 24.Li JD, Caroll J, Ellar DJ. Crystal structure of insecticidal delta-endotoxin from Bacillus thuringiensis at 2.5 A resolution. Nature. 1991;353:815–821. doi: 10.1038/353815a0. [DOI] [PubMed] [Google Scholar]
- 25.Choe S, Bennet MJ, Fujii G, Curmi PMG, Kantardjieff KA, Collier RJ, Eisenberg D. The crystal structure of diphtheria toxin. Nature. 1992;352:216–222. doi: 10.1038/357216a0. [DOI] [PubMed] [Google Scholar]
- 26.Parker MW, Pattus F, Tucker AD, Tsernoglou D. Structure of the membrane-pore-forming fragment of colicin A. Nature. 1989;337:93–96. doi: 10.1038/337093a0. [DOI] [PubMed] [Google Scholar]
- 27.Persson B, Argos P. Tmap: Prediction of transmembrane segements in proteins utilizing multiple sequence alignments. J Mol Biol. 1994;237:182–192. doi: 10.1006/jmbi.1994.1220. [DOI] [PubMed] [Google Scholar]
- 28.Tzokov SB, Wyborn NR, Stillman TJ, Jamieson S, Czudnochowski N, Artymiuk PJ, Green J, Bullough PA. Structure of the Hemolysin E (HlyE, ClyA, and SheA) channel in its membrane-bound Form. J Biol Chem. 2006;32:23042–23049. doi: 10.1074/jbc.M602421200. [DOI] [PubMed] [Google Scholar]
- 29.Eifler N, Vetsch M, Gregorini M, Ringler P, Chami M, Philippsen A, Fritz A, Muller SA, Glockshuber R, Engel A, Grauschopf U. Cytotoxin ClyA from Escherichia coli assembles to a 13-meric pore independent of its redox-state. EMBO J. 2006;25:2652–2661. doi: 10.1038/sj.emboj.7601130. [DOI] [PMC free article] [PubMed] [Google Scholar]
- 30.Santelli E, Bankston LA, Leppla LH, Liddington RC. Crystal structure of a complex between anthrax toxin and its host cell receptor. Nature. 2004;430:905–908. doi: 10.1038/nature02763. [DOI] [PubMed] [Google Scholar]


