Abstract
Nasolabial angle has become the angle depicting the esthetics so has attained the prime importance in the treatment planning. Dr Jay P. Fitzgerland and Dr. Ram S. Nanda. In 1992 gave norms for Caucasian population. A radiographic cephalometric study was undertaken with 45 subjects of Indian origin to evaluate and compare with their result. The method of evaluation was according to the criteria given by Dr. Jay P Fitzergerald in AJODO 1992; 102:328-34. Significant decrease in nasolabial angle values was found in case of Indian population as compared to white adults.
Keywords: Nasolabial angle, Indian population, FH plane
Introduction
The complexity of predicting changes in the soft tissue profile over time is difficult. A frequently used soft tissue parameter in orthodontic diagnosis is the nasolabial angle, which is formed by a line from the lower border of the nose to one representing the inclination of the upper lip. The range of nasolabial angle given by Dr. Jay P Fitzgerald in Caucasian adults is 114°±10°. Considering this range is too high for the Indian population, the study was carried out to evaluate the nasolabial angle in the Indian population and compare it with the Caucasian population values given by Dr. Jay P Fitzgerald.[1,2]
Materials and Methods
This study used the cephalometric radiographs of 45 subjects, 21 males and 24 females. All exhibited Class I occlusions with good facial balance. There was no history of orthodontic treatment or facial surgery. All 28 permanent teeth were intact excluding the presence of third molars. The mean age of the sample was 22 years with a range from 20 years 4 months to 24 years 10 months.
All cephalometric radiographs were taken with the lips relaxed, which is a more natural position and allowed a more accurate structure of the lip [Figure 1] and were traced on 0.003-inch matte acetate tracing paper.[3]
Figure 1.
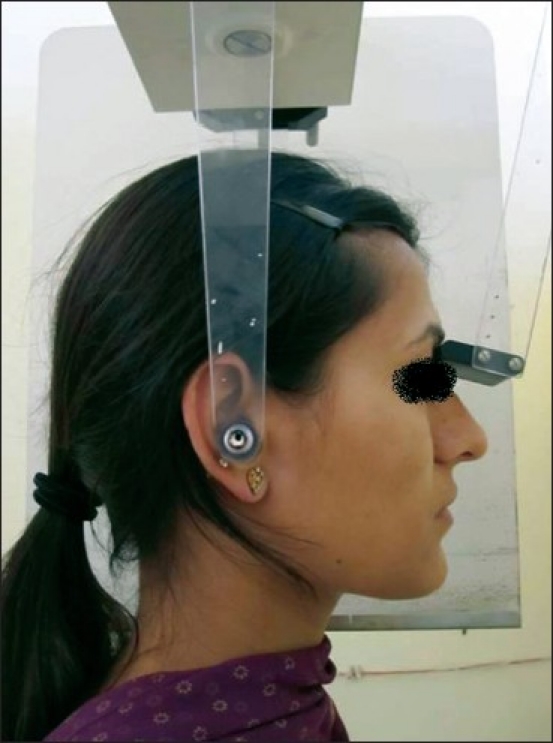
Positioning of patient while taking lateral cephalogram
The nasolabial angle has been drawn by using Dr. Jay P Fitzgerald's method[1] [Figure 2]. The most posterior point of the lower border of the nose at which it begins to turn inferiorly to merge with the philtrum of the upper lip was located and called posterior columella point, or PCm. A tangent was drawn from PCm anteriorly along the lower border of the nose at its approximate middle third and called PCm tangent. The posteroinferior angle of this line extending anteriorly and intersecting the Frankfort horizontal plane was considered the relative inclination of the nose and termed the lower nose to Frankfort horizontal plane angle, or N/FH. If this line representing the lower border of the nose was parallel to the Frankfort horizontal plane, it was measured as 0°. Occasionally a patient had a nose that was turned so far down that a plane parallel to the lower border of nose intersected the Frankfurt Horizontal Plane posterior to the soft tissue profile. In this case, the anteroinferior angle formed at this intersection was reported as the N/FH angle with a negative value.
Figure 2.
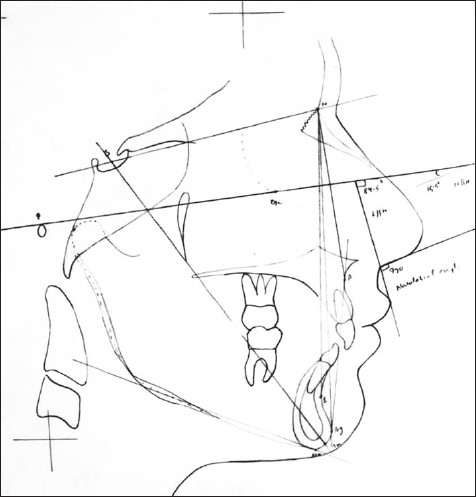
Nasolablal angle (Dr. Fitzgerald)
The line drawn from PCm to labrale superius (Ls) was termed the PCm-Ls line. When extended superiorly, it intersects the Frankfort horizontal plane. The anteroinferior angle formed at this intersection was considered the relative inclination of the upper lip and was termed the upper lip to Frankfort horizontal plane angle, or L/FH.
The anteroinferior angle formed by the intersection of PCm tangent and the PCm-Ls line was the nasolabial angle. This angle is the sum of the angles N/FH and L/FH or is the complement of the triangle formed by these two lines with the Frankfort horizontal plane.
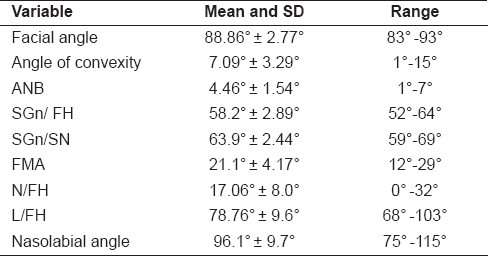
The measurements recorded from the sample of 45 cephalometric radiographs were tabulated [Table 1]. The mean and standard deviation were calculated for each measurement to establish normative data [Table 2].
Table 1.
Measurements of 45 cephalometric radiographs
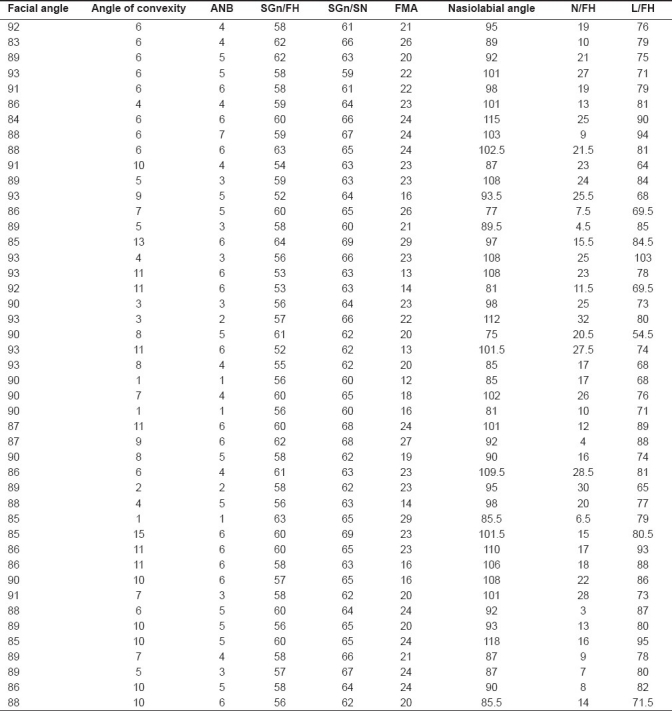
Table 2.
The mean and standard deviation and range for all of the angular measurements in degree based on the 45 samples from the Indian population
The three nasolabial parameters were compared with each other to determine the extent of linear correlation within the three nasolabial parameters.
Results and Observation
The mean value of the nasolabial angle was 96.1° ± 9.7°, with males at 96.74° ± 10.89° and females at 95.64° ± 8.9.
The N/FH angle had a mean value of 17.06° and a standard deviation of ±8.0°. The males had a mean value of 17.09° ± 8.44° and the females 17.04° ± 7.84° [Table 3].
Table 3.
L/FH angle recorded in Indian and white adult populations

The mean value of the L/FH angle was found to be 78.76° ± 9.6°. The males demonstrated a mean value of 80.92° ± 10.27° and the females 79.145° ± 9.236° [Graph 1] [Table 4].
Graph 1.
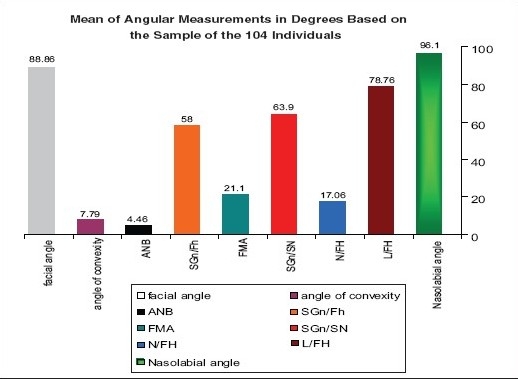
The angular measurement showing the Mean and Standard deviation and Range in degree based on the sample of 45 Indian population
Table 4.
N/FH angle recorded in Indian and white adult populations

Discussion
The evaluation of the soft tissue profile is vital in the diagnosis and the treatment planning of the orthodontic patient. Soft tissue changes have been shown to accompany growth, as well as orthodontic treatment. Although the soft tissue changes with orthodontic treatment are variable, the direct effect of orthodontic treatment on the soft tissue profile is usually apparent. Even more dramatic are the changes in the soft tissue profile that may be induced by orthognathic or plastic surgery. It is for these reasons that the soft tissue profile must be carefully examined before a decision regarding orthodontic treatment and/or orthognathic surgery can be made.[2,4–6]
Review of the nasolabial soft tissue is important when contemplating orthodontic treatment. Movement of the maxillary incisors in any of the three planes of space influences this area. However, consistent and reproducible methods of evaluating the nasolabial region are lacking.
The nasolabial angle is formed by two lines, one from the nose, another from the upper lip, and both independent of each other. The angular measurement described by these two lines is a resultant of their individual inclinations. The nasolabial angle of a person may be within normal range, small or large. The measurement of this angle alone provides inadequate information as it does not reveal which component is responsible for the variability. It could be the nose, the lip or both. Therefore, it is important to analyze each component of this angle to assist in the differential diagnosis of normal from its variation.[1,7,8]
This study was planned to evaluate the nasolabial angle for the Indian population by using Dr. Jay P Fitzgerald's method. The proposed method of locating the posterior columella point onto which a tangent was drawn to the lower border of the nose, as well as the line from this point to labrale superius, proved to be a reliable technique for constructing the nasolabial angle. The posteroinferior angle formed by the intersection of the Frankfort horizontal plane with the line drawn tangent to the lower border of the nose provided a representative inclination of the nose. The anteroinferior angle formed by the intersection of the Frankfort horizontal plane with the line drawn from the posterior columella point tangent to labrale superius provided a representative inclination of the upper lip.[1]
The mean value of the nasolabial angle in the Indian population is (96.1° ± 9.7°) which is less in comparison to the values given by Dr. Jay P Fitzgerald in white adults (114° ± 10). Males had shown higher nasolabial value (96.74° ± 10.89) in comparison to females (95.64° ± 8.9) in the Indian population, whereas in white adults female (116.19°) had shown higher value in comparison to males (113.55° ± 9.44°). This can be attributed to the fact that the Indian population is having a more fuller profile in comparison to the Caucasian where the profile are much more flatter.
In our study the N/FH angle had a mean value of 17.06° and a standard deviation of ±8.0°. The males had a mean value of 17.09° ± 8.44° and the females 17.04° ± 7.84°, whereas in white adults the N/FH angle had a mean value of 17.76° and a standard deviation of ±7.40°. The males had a mean value of 17.54° ± 7.28° and the females 18.61° ± 7.96° with no statistically significant difference (P >0.05) between them [Table 3].
The mean value of the L/FH angle in the Indian population was found to be 78.76° ± 9.6°. The males demonstrated a mean value of 80.92° ± 10.27° and the females 79.145° ± 9.236°, whereas in white adults the L/FH angle was found to be 97.85° ± 5.26°. The males demonstrated a mean value of 97.73° ± 5.11° and the females 98.33° ± 5.91° with the difference being statistically insignificant (P<0.05) [Table 4].
Brazilian black individuals had a nasolabial angle 88.14° ± 12.52° which is less than the Indian population. This can be explained by the reason that the soft tissue profiles of Brazilian black individuals are sharper, i.e. they tend to have more fuller lips and protrusive maxilla and thicker chins which is an ethnic feature.[9] Females show smaller nasolabial angle in comparison to males in the Indian population which is similar in the Brazilian population where the nasolabial angle is smaller among females demonstrating the occurrence of sexual dimorphism.
Conclusion
A method of constructing the nasolabial angle, given by Dr. Jay P Fitzgerald, has been employed and the nasolabial angle of 45 Indian subjects has been constructed which determines the relative angulations of the nose and the upper lip, as well as their relationship with each other.
The findings of this investigation of the nasolabial region reveal that the
-
mean and standard deviation, from a sample of 45 Indian subjects , for the three nasolabial parameters were
17.06 ± 8° for the N/FH angle,
78.76° ± 9.6° for the L/FH angle, and
96.1° ± 9.7° for the nasolabial angle.
There was no statistically significant difference between males and females in this study.
For further studies, in future these norms may act as preliminary blueprint for evaluation of the nasolabial angle for the Indian population.
Footnotes
Source of Support: Nil
Conflict of Interest: None declared.
References
- 1.Jay fitzgerald. An evaluation of the nasolabial angle and the relative inclinations of the nose and upper lip. Am J Orthod Dentofacial Orthop. 1992;102:328–34. doi: 10.1016/0889-5406(92)70048-F. [DOI] [PubMed] [Google Scholar]
- 2.Holdaway RA. A soft tissue cephalometric analysis and its use in orthodontic treatment planning.Part 1. Am J Orthod. 1983;84:1–28. doi: 10.1016/0002-9416(83)90144-6. [DOI] [PubMed] [Google Scholar]
- 3.Mansour S, Burstone C, Legan H. An evaluation of soft tissue changes resulting from LeFort I maxillary surgery. Am J Orthod. 1983;84:37–48. doi: 10.1016/0002-9416(83)90146-x. [DOI] [PubMed] [Google Scholar]
- 4.Pelton JW, Elasser WA. Studies of dentofacial morphology. 4. Profi le changes among 6829 white individuals according to age and sex. Angle Orthod. 1955;25:199–207. [Google Scholar]
- 5.Subtelny JD. The soft tissue profile,growth and treatment changes. Angle Orthod. 1961;31:105–22. [Google Scholar]
- 6.Bishara SE, Peterson LC. Changes in facial dimensions and relationships between the ages of 5 and 25 years. Am J Orthod. 1984;85:238–51. doi: 10.1016/0002-9416(84)90063-0. [DOI] [PubMed] [Google Scholar]
- 7.Lo FD. Changes in nasolabial angle due to maxillary incisor retraction. Am J Orthod. 1982;82:381–91. doi: 10.1016/0002-9416(82)90187-7. [DOI] [PubMed] [Google Scholar]
- 8.Owen AH. Diagnostic block cephalometrics.Part 1. J Clin Orthod. 1984;18:400–22. [PubMed] [Google Scholar]
- 9.Connor AM, Moshiri F. Orthognathic surgery norms for American black. Am J Orthod. 1985;87:119–135. doi: 10.1016/0002-9416(85)90021-1. [DOI] [PubMed] [Google Scholar]
- 10.Proffitt WR, Epker BN, Ackerman JL. Philadelphia: WB Saunders; 1980. Surgical correction of dentofacial deformities; pp. 127–35. [Google Scholar]
- 11.Robison J, Rinchuse DJ, Zullo TG. Relationship of skeletal pattern and nasal form. Am J Orthod. 1986;89:499–506. doi: 10.1016/0002-9416(86)90008-4. [DOI] [PubMed] [Google Scholar]
- 12.Williams R. The diagnostic line. Am J Orthod. 1969;55:458–76. doi: 10.1016/0002-9416(69)90084-0. [DOI] [PubMed] [Google Scholar]
- 13.Burstone CJ, James RB, MuIphy GA. Cephalometrics for orthognathic surgery. J Oral Surg. 1978;36:269–77. [PubMed] [Google Scholar]
- 14.Meng HP, Goorhuis J, Kapila S, Nanda RS. Growth changes in the nasal profile from 7 to 18 years of age. Am J Orthod Dentofac Orthop. 1988;94:317–26. doi: 10.1016/0889-5406(88)90057-1. [DOI] [PubMed] [Google Scholar]
- 15.Singh RN. Cephalometric changes in the soft tissue chin after orthodontic treatment. Am J Orthod Dentofac Orthop. 1990;98:41–6. doi: 10.1016/0889-5406(90)70030-G. [DOI] [PubMed] [Google Scholar]


