Abstract
In the assembly of microarrays and microarray-based chemical assays and enzymatic bioassays, most approaches use pins for contact spotting. Acoustic dispensing is a technology capable of nanoliter transfers by using acoustic energy to eject liquid sample from an open source well. Although typically used for well plate transfers, when applied to microarraying it avoids drawbacks of undesired physical contact with sample, difficulty in assembling multicomponent reactions on a chip by readdressing, a rigid mode of printing that lacks patterning capabilities, and time-consuming wash steps. We demonstrated the utility of acoustic dispensing by delivering human cathepsin L in a drop-on-drop fashion into individual 50-nanoliter, pre-spotted reaction volumes to activate enzyme reactions at targeted positions on a microarray. We generated variable-sized spots ranging from 200 to 750 μm (and higher), and handled the transfer of fluorescent bead suspensions with increasing source well concentrations of 0.1 to 10 ×108 beads/mL in a linear fashion. There are no tips that can clog and liquid dispensing CVs are generally below 5%. This platform expands the toolbox for generating analytical arrays and meets needs associated with spatially-addressed assembly of multicomponent microarrays on the nanoliter scale.
Keywords: Microarray, acoustic dispensing, pin spotting, no-contact dispensing, assay development, lab on a chip, screening
INTRODUCTION
Protein profiling and chemical compound screening are important in the fields of drug discovery and development, proteomics, and biology1-8. Due to the number and cost of biological samples, the emergence of microarrays as an analytical tool and a platform for testing chemical libraries9-17 has been fueled by its ability to analyze reactions run at the nanoliter scale18 and reach densities of thousands of spots/cm2, far surpassing the scale and density achievable by well plates19. Many types of microarrays have been developed using contact spotting. Protein microarrays detect free and cell-surface proteins by using surface-linked antibodies to capture them to the slide surface from the sample20-22. Enzyme microarrays profile enzymes against chemical libraries by housing reactions in printed nanodroplets of glycerol23. Recently microarrays were utilized to study phenotype changes in yeast cells cultured and grown in different chemical environments by using a staining process to observe changes in cellular features24. Typically for these and other applications25-28, stainless-steel or silicon pins are used. The pins are loaded by coming in direct contact with the sample and are transferred directly to the substrate surface, deliver a single volume, may exhibit spot-to-spot diameter variations, require multiple reloads and washes for a long print run, must be cleaned and stored properly to maintain performance, and pin arrayers are limiting as there is little room for patterning or microarray design.
With microarrays playing a more prominent role in analytical, proteomic, and screening studies, newer printing methodologies can aid in the advancement of the technology. Methods such as piezoelectric, Topspot, electrospray, and Cartesian dispensing have been implemented with success29-33. While piezoelectric dispensers offer low-volume dispensing without contacting the substrate surface and excellent CVs, they are susceptible to clogging, come in contact with the sample during the load and dispense steps, can handle only a limited number of samples at one time, and require washing and maintenance of the tubing and tips34,35. Topspot printing technology is capable of low nanoliter dispensing of 24 or 96 samples in parallel through the use of a pneumatic piston to generate droplets31; however, limitations include direct contact with the sample, fixed spacing between nozzles, and no patterning capability. Electrospray deposition, commonly used to produce thin films on solid surfaces, can be adapted to generate microarrays if a dielectric mask is placed between the capillaries housing the sample and the substrate surface to control the size of the deposited spots while an electric field is applied to force droplets out of the nozzles32. Although this method can produce spots that are under 6 μm in diameter, shortcomings include the requirement of large inter-spot spacing to avoid cross-contamination, uneven droplet distributions below the spray nozzle, and concerns that the deposition process can damage biological samples due to shearing at the dispense nozzles and exposure to an electric field33. Other commercial dispensers that can produce microarrays without pins are available; an example is the line of Cartesian inkjet dispensers, which use a syringe and a microsolenoid valve to dispense nanoliter volumes. These units also require intimate contact with the sample and may be better suited for high-nanoliter wellplate dispensing.
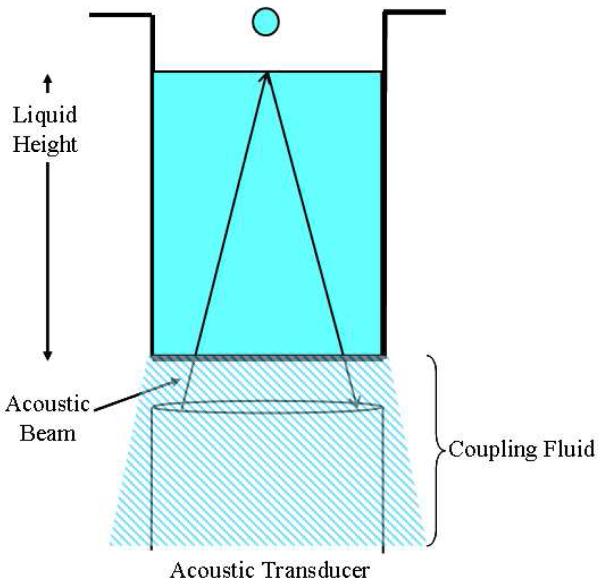
The microarraying approach using acoustic dispensing technology described in this technical note is a true no1contact method which functions by using focused bursts of ultrasound generated by a transducer located underneath the source plate to eject low nanoliter droplets of a liquid sample. The acoustic beam generates pressure on the sample, causing ripples to form on the surface from which a droplet rises and is ejected upward toward the target (a glass slide or inverted well plate). Water is used as a coupling fluid to mediate the transfer of the acoustic energy from the transducer to the bottom of the well (Fig. 1). The volume of the transfer can be adjusted by changing the amount of energy input to the well, and volumes of 1 - 2 nL are achievable with aqueous-, DMSO-, and glycerol-based solutions. Although acoustic dispensing is commonly used for transfers between well plates, the tool was effective for microarraying and assembling reactions in glycerol nanodroplets on glass slides when careful optimizations of the energy settings and modifications to the working buffers were applied. No physical contact is made with the sample or target surface (the other “no-contact” methods described earlier only refer to the target surface), variable-sized spots can be generated, and multiple reagents can be dispensed sequentially and accurately into existing spots in a user-defined pattern without cross-contamination or cross-mixing. Clogging is not a concern as there are no nozzles or tips, washing and maintenance are not required, and dead volumes are minimal. There is an inherent advantage to using acoustic dispensing for solutions that are difficult to handle (such as radioactive or biological solutions), assays that use a very small amount of protein, or samples that have suspensions or particulates. The spotting is observed in real time through a built-in camera. The arrays are designed in the software by mapping source wells to target locations, setting center-to-center distances, and indicating the number of drops to be dispensed. We investigated and showed how an acoustic dispenser performed favorably when compared to contact methods over several select areas of microarraying.
Figure 1.
Illustration of Acoustic Dispensing. Focused acoustic beams travel from the transducer, through a coupling fluid, through the bottom of the well plate, and into the sample. The amount of energy used can be tuned so that droplets over a small range of volumes are ejected from the surface.
MATERIALS AND METHODS
Reagents, Equipment and Software, and Materials
Reagents sources: Invitrogen Corporation, Carlabad, CA, USA (7-Amino-4-methylcoumarin (AMC), Rhodamine 110 (R110), FluoSpheres NeutrAvidin-labeled microsphere beads, 1-μm size, 1% solids); Calbiochem, San Diego, CA, USA (Cathepsin L protease); Penn Center for Molecular Discovery, University of Pennsylvania, Philadelphia, PA, USA (the thiocarbazate cathepsin L inhibitor, Substance Identifier (SID) 266815096); Sigma Aldrich, St. Louis, MO, USA (Z-fr-AMC (7-Amino-4-methylcoumarin, N-CBZ-L-phenylalanyl-L-arginine amide, hydrochloride) substrate, fluorescein isothiocyanate (FITC)).
Equipment and software sources: EDC Biosystems, Malpitas, CA, USA (ATS-100 acoustic dispenser); GeneMachines Corporation, San Carlos, CA, USA (GeneMachines OmniGrid Accent); Alpha Innotech, San Leandro, CA, USA (Alpha Arrayer); Perkin Elmer, Waltham, MA, USA (Envision plate reader); CSZ, Cincinnati, OH, USA (Micro Climate humidifying chamber); Molecular Devices, Sunnyvale, CA, USA (Aquamax DW4); Imaging Research, Ontario, CA (Array Vision genomic software); Olympus, Hamburg, Germany (IX81 motorized research microscope).
Materials sources: Aurora Biosciences, San Diego, CA, USA (1536- and 384-well cyclo-olefin copolymer (COC) plates); Telechem International Inc., Sunnyvale, CA, USA (SMP4 Stealth microarray pins); Corning Incorporated Life Sciences, Lowell, MA, USA (black, nonbinding 384- and 1536-well plates); Erie Scientific, Portsmouth, NH, USA (polylysine-coated glass slides); Xenopore, Hawthorne, NJ, USA (streptavidin-coated glass slides).
RESULTS
Accurate Drop-on-Drop Delivery without Cross-Contamination
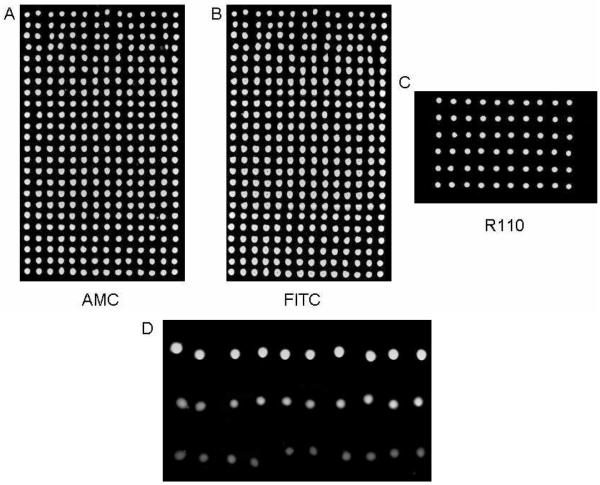
On a polylysine-coated glass slide, 40-nL spots of 10% glycerol/water were dispensed from a 1536-well source plate by transferring twenty 2-nL droplets in a 24 × 14 array format, followed by stepwise delivery of 2-nL droplets of AMC in water and FITC in DMSO into each of the spots. The camera showed that the dyes were dispensed into every glycerol spot without a major change to the morphology of or cross-mixing between spots. Images taken on a fluorescent scanner revealed a very uniform signal with CVs below 5% for each dye (Fig. 2A and 2B). The experiment was repeated under more stringent conditions by first dispensing 35-nL spots of a 10% glycerol/reaction buffer solution, followed by drop-on-drop delivery of a rhodamine dye in reaction buffer, resulting in a CV of 2.5% for the 6 × 10 microarray (Fig. 2C).
Figure 2.
Images taken after drop-on-drop delivery of fluorescent dyes and enzyme. Images from a dual-filter scan after (A) AMC and (B) FITC were sequentially dispensed into 40 nL spots of a non-fluorescent microarray. There was a clear signal in each spot, no mixing between spots, and no missed dispenses. The CVs for the AMC and FITC dispenses were 4.5% and 5.1% (n = 336) respectively. Control spots (not shown) remained dark. (C) Image taken after R110 was dispensed into 35 nL spots. The CV was 2.5% (n = 60). (D) An enzyme microarray activated by drop-on-drop delivery of cathepsin L into 50 nL spots containing 100 μM Z-fr-AMC substrate and inhibitor concentrations of 0 μM, 10 μM, and 50 μM respectively from top to bottom. The reaction is more strongly inhibited at increasing inhibitor concentrations.
Activation of Enzyme Microarrays
A small 3 × 10 microarray consisting of 50-nL spots containing 100 μM of Z-fr-AMC substrate and three concentrations (0 μM, 10 μM, and 50 μM) of a known thiocarbazate cathepsin L inhibitor, Substance Identifier (SID) 26681509, in a 10% glycerol/buffer solution was acoustically dispensed onto a polylysine-coated glass slide from a 384-well plate and activated by drop-on-drop delivery of cathepsin L in reaction buffer to achieve a final concentration of 30 nM. After an incubation of 2 hrs at 30° C (97% Rh), the microarrays were analyzed and dose-response behavior was evident as relative fluorescence signals of 50000, 32000, and 14000 were seen for the 0 μM, 10 μM, and 50 μM inhibitor samples respectively. Cathepsin L was increasingly inhibited with increasing inhibitor concentration (Fig. 2D).
Dispensing Variable Spot Sizes
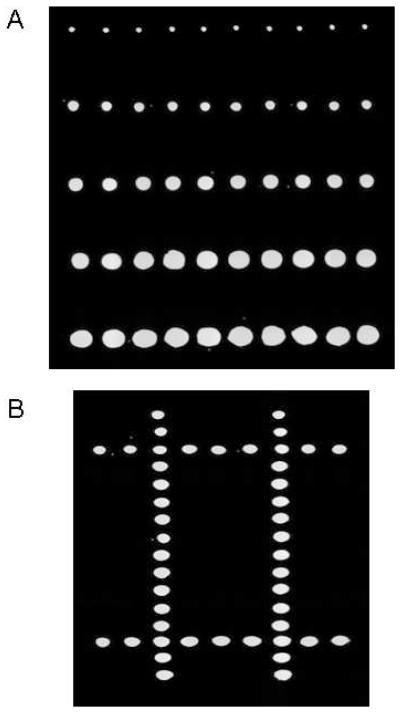
AMC in a 10% glycerol/water solution in a 1536-well plate was used to generate a gradient microarray with spots of differing diameters in each row. Using a well-calibrated 2-nL droplet as the basis, variable-sized reaction volumes were generated by increasing the number of 2-nL dispenses to each position on the chip. The number of droplets dispensed to each row was 1, 5, 10, 15, and 20, respectively. As estimated from genomics software analysis, diameters were approximately 200 μm for the single-drop and upwards of 750 μm for the twenty-drop dispense (Fig. 3A).
Figure 3.
Variable volume and surface pattern microarraying. (A) An array of an AMC in 10% glycerol solution dispensed at increasing drop numbers. (B) Image taken after dispensing AMC into a blank array consisting of glycerol spots to create a “#” pattern. More complex patterns are possible, allowing for analyses that are a function of position on the target.
Surface Patterning
An aqueous AMC solution in a 1536-well plate was dispensed into a microarray to form a pattern. The dispense maps allow for sample from any source well to be transferred to any spatial location on the target slide with a user-defined number of droplets. A non-fluorescent microarray was first spotted at 20 nL with a 10% glycerol/water solution to serve as the targets for the AMC drop-on-drop dispense. Included is a simple pattern consisting of a “#” sign that was generated by dispensing dye into the spots (Fig. 3B). This experiment demonstrated that source wells can be cherry picked and accurately transferred to target locations of choice.
Spot Size Consistency and Array Geometry
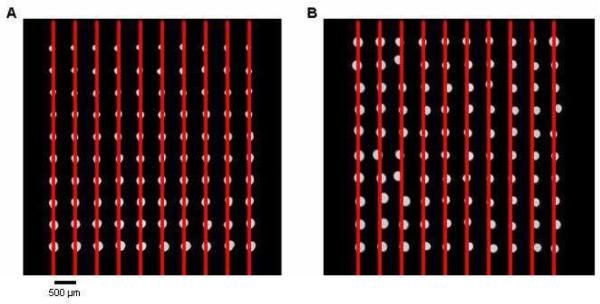
Two microarrays consisting of 2-nL AMC in 10% glycerol spots with 500 μm × 500 μm spacing generated by pins and acoustic dispensing were compared. The acoustic-dispensed array showed better diameter size consistency as the pin-generated spots grew smaller in size with each transfer. The array geometry was better in the pin-spotted microarray as some spots were noticeably shifted on the acoustically dispensed microarray. Although the targeting of the sample was quite accurate, the spots tended to settle randomly in any given direction after landing on the slide surface. The extent of the misalignment due to this settling effect very rarely exceeded the radius of the spot (Fig. 4).
Figure 4.
Comparison of pin- and acoustic dispense-generated microarrays. The spots contained AMC in a 10% glycerol/buffer solution and were spaced 500 μm apart. (A) Array created with a Stealth SMP4 pin with reloading after 20 spots. Although the diameters varied greatly in size, the spots were very evenly spaced. (B) Acoustic dispensing produced spots that had more uniform spot diameters, but their final positions did not align as well.
Delivery of Fluorescent Bead Suspensions
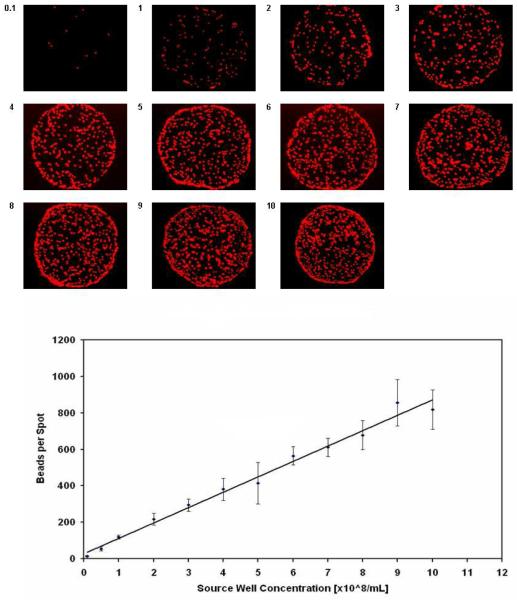
FluoSpheres NeutrAvidin-labeled microsphere beads with a 1-μm diameter in a 5% glycerol/buffer solution were acoustically dispensed from a 384-well source plate onto streptavidin-coated slides. The source wells contained microspheres ranging from 0.1 to 10 ×108 beads per mL, and the dispensing was performed at a single, fixed energy setting to test the impact of increasing non-homogeneity in delivering suspensions. After imaging the 11 × 20 array on a microscope and counting the number of fluorescent features, it was determined that the average number of beads transferred in each spot (n = 20) increased linearly with increasing bead concentration in the source well (Fig. 5). CVs were 8% - 14%. With a common buffer, samples acoustically dispensed were quite consistent and representative of the contents in the source wells despite a change of two orders of magnitude in the composition of the suspension.
Figure 5.
Acoustic dispensing of fluorescent beads. As the sample only contacts the source well and each spot is dispensed fresh, concerns of non-specific binding to the transfer device and non-uniform compositions between spots are greatly minimized when dealing with bead solutions or other suspensions.
DISCUSSION
Acoustic dispensing expands the microarray toolbox. Drop-on-drop delivery is difficult to accomplish with pins without contamination but is readily handled by acoustic dispensing for the stepwise addition of reagents. We demonstrated accuracy and precision by dispensing AMC and FITC solutions into glycerol nanodroplets. The energies used for each individual sample were optimized to produce good spot morphology and centering, two factors that are critical to the integrity of the microarray and for targeting subsequent reagents into existing spots. The volume of each droplet was determined by dispensing fluorescent dyes of known concentration into a known well volume and comparing to a calibration curve. Real-time scrutiny through the camera showed that the dyes were dispensed directly into the center of each glycerol spot, and CVs were < 5%; a comparable approach with pins produced CVs > 16%18. This capability encouraged a push toward the assembly of more complex, enzymatic bioassays; we started with cathepsin L protease as it and its associated inhibitor were both well-studied in our laboratory. The resulting dose-response behavior from this proof-of-concept experiment was indicative that the reactions were properly assembled, paralleling those constructed by liquid handlers in well plates or by hand in test tubes.
We can transfer 1-nL volumes of aqueous-, DMSO-, and glycerol-based working buffers while maintaining the proper morphology and spatial-targeting control required for microarraying. A single 2-nL glycerol spot has a diameter of approximately 200 μm, and variable sizes can be achieved by increasing the number of dispenses to a particular location. The droplets land on one another and coalesce to form a single spot. Larger reaction volume compartments are easier to target when introducing subsequent reagents for multicomponent assembly. Moreover, the increased amount of sample in each spot ultimately results in a stronger signal. Pins are not capable of variable volume transfers, and pin arrayers generally produce microarrays in a regular, rectangular pattern, especially if multiple pins are used. Acoustic dispensers allow for complex arrangements as sample from any source well can be transferred to any location on the target surface. The ability to spatially dispense to a chip from 384 or 1536 wells is an application that is useful for cherry picking a compound plate to screen an enzyme assay or perhaps to dispense samples onto specific areas of a tissue slice, for example.
When aqueous or organic buffers are printed by a pin, often each successive spot displays a decrease in diameter as the pin empties. And for glycerol-containing samples, spots that are printed immediately following a reload often have larger diameters than those printed prior to the reload, unless an extensive preprint or blotting is performed, which results in wasted sample and extended run times27. These factors contribute to greater CVs. Acoustic dispensing does not suffer from this effect as each spot is ejected fresh. The geometries of acoustically dispensed arrays are not quite as symmetric as those generated by pins as frequently the spot moves in a random direction after it settles on the substrate surface; aqueous components evaporating out of the glycerol-containing spots and non-uniformities on the solid surface contribute to this shifting. However, provided the center-to-center spacing is sufficient, occasional shifting rarely causes two spots to merge, and most genomics and microarray software packages can easily account for these minor misalignments during analysis. The step motor on a pin arrayer can have 5 - 10 μm precision in the x- and y-directions so the spots are usually spaced out very accurately.
The pin’s size, material, and chemical coating should be chosen carefully to achieve the optimal physical interaction with the sample and substrate during a print run. Other factors that affect spot size include the depth and time the pin dips into the sample, number of preprint blots, and the contact time and retraction speed on the substrate surface37. Additionally, the volume transferred and spot morphology may depend on the chemical coating of the solid surface for contact methods, and better spot morphologies are evident when no-contact methods print on hydrophobic surfaces19. There is also a very little chance of cross-contamination or carryover with no-contact microarraying as is possible when a split pin dips into multiple wells during a long print run. To combat this, microarrayers have several built-in units for cleaning the pins, including sonicators, wash stations, and dryers. Since several loops are usually required, the washing, drying, reloading, and preprinting steps may contribute greatly to the total run time when a single pin is employed18.
Acoustic dispensing eases the use of certain solutions where contact may not be desired as the reagent would damage the pin or contaminate it with something that is difficult to remove; very acidic or basic solutions, “sticky” biological proteins or beads, and radio-labeled compounds fall under this category (contact is made with the sample by the microarraying technologies mentioned earlier, which all have tips, nozzles, or tubing). Furthermore, a pin interacting with a protein may have an effect on its kinetic properties and folding state, and may cause denaturation30,38. Complex biological samples containing proteins or cells may experience electrostatic interactions or adhesion forces that lead to a higher localized concentration on the surface of the pin, preventing transfer to the slide, and resulting in a lack of homogeneity between spots on the microarray26,30. These concerns are minimized with acoustic dispensing, and we demonstrated with a non-homogeneous suspension of fluorescent, 1-μm diameter beads that it can deliver spots that are representative of the sample in the source well. Spanning a range from 0.1 to 10 ×108 beads/mL, there was a direct, linear relationship between concentration in source well and number of beads transferred in each spot.
Viscous solutions containing upward of 25% glycerol by volume can be handled before the acoustic dispensing capabilities start to break down. Our reaction buffers typically contain 10% glycerol by volume (to prevent evaporation of the spots), and at this level there are no problems with the dispensing. When we transferred cellular lysate solutions, the presence of detergents led to difficulties in producing spots that did not fragment (this would be less of a problem dispensing into well plates as morphology would not be a concern). To overcome the formation of satellites, the concentration of detergent should be reduced and some glycerol may be added to try and improve performance. Spotting at a high glycerol concentration is not a problem for pins, and we have regularly used 50% glycerol solutions for protease assays18,23. It may be difficult to transfer lysates to the substrate surface due to the complexity of the sample and possible physical interactions with the pin, and thus clever design is required for lysate microarrays36.
Acoustic dispensing requires flat-bottom polypropylene or COC plates, both of which are ideal for compound storage. They can be 384-, 1536-, or 3456-well formats, and for 1536-well plates, only 0.25 mm of liquid sample is needed for dispensing to be possible (the tool can detect the amount of sample remaining in the well), corresponding to a volume of about 1 μL. Even after sampling a plate multiple times, the leftover liquid can be stored for future use until the wells are drained, minimizing wasted material. This reduces the cost for microarraying expensive or rare proteins, and allows for the repeated use of compound plates. In sharp contrast, contact arrayers require volumes of 5 - 10 μL and 25 - 50 μL for 384- and 96-well plates respectively.
Three slides can be placed into the acoustic dispenser at one time and array densities of approximately 1000 - 3000 spots/slide can be achieved. This platform cannot match the throughput or density of pins and piezoelectric dispensers. As a microarrying tool, acoustic dispensing is best utilized as a low-throughput platform for specialized applications that require complex assembly, use expensive reagents, or function better with minimal contact with solid surfaces. The technology was an upgrade over an existing screening platform developed in our laboratory involving the aerosol deposition of proteases to activate microarray reactions because with acoustic dispensing we are able to determine the exact volume of enzyme introduced to each spot, and only a fraction of the sample is required18,23. We have also shown that kinase bioassays can be constructed and analyzed39.
CONCLUSION
The utility of acoustic dispensing is that it allows for the assembly of microarrays with an expanded set of usable biological samples, chemical reagents, and assay development protocols. Analytical techniques on a chip that require an output from a reaction, spatial placement of proteins for hybridization or MALDI, or dispensing onto soft surfaces such as gels, can be handled. Future applications in our laboratory may include the generation of combinatorial mixtures of matrix proteins for cell culture studies or polymers for blood compatibility studies, among others that require multicomponent assembly on the nanoliter scale.
Table 1.
A comparison of microarraying platforms for selected areas.
| Microarraying Characteristics | Acoustic Dispensing |
Pin Spotting | No-Contact Dispensing (Piezoelectric) |
|---|---|---|---|
| Contact With Sample / Substrate Surface |
No / No | Yes / Yes | Yes / No |
| Low Volume Spotting (< 5 nL) | Yes | Yes | Yes |
| Variable Volume Transfers | Yes | No | Yes |
| Spot Size Consistency / Array Geometry |
Excellent / Very Good |
Good / Excellent |
Excellent / Excellent |
| Drop1on1Drop Capability | Yes | No | Yes |
| Washing and Maintenance Steps | No | Yes | Yes |
| Clogging of Tips or Nozzles | No | Yes | Yes |
| Surface Patterning and Flexible Array Design |
Yes | No | Some |
| Uniform Sample Transfer | Yes | Sample Dependent |
Sample Dependent |
| Throughput | Low - Medium | Increases with number of pins |
Medium - High |
| Special Plate Requirement | Yes | No | No |
ACKNOWLEDGEMENTS
We would like to thank Parag P. Shah for providing samples for the cathepsin L study, and Sean Maloney for generating images from the fluorescent bead experiments. This work was supported in part by NIH U54-HG3915.
REFERENCES
- 1.Bleicher KH, Bohm HJ, Muller K, Alanine AI. Nat Rev Drug Discov. 2003;2(5):369–78. doi: 10.1038/nrd1086. [DOI] [PubMed] [Google Scholar]
- 2.Hammach A, Barbosa A, Gaenzler FC, Fadra T, Goldberg D, Hao MH, Kroe RR, Liu P, Qian KC, Ralph M, Sarko C, Soleymanzadeh F, Moss N. Bioorg Med Chem Lett. 2006;16(24):6316–20. doi: 10.1016/j.bmcl.2006.09.014. [DOI] [PubMed] [Google Scholar]
- 3.Jenkins KM, Angeles R, Quintos MT, Xu R, Kassel DB, Rourick RA. J Pharm Biomed Anal. 2004;34(5):989–1004. doi: 10.1016/j.jpba.2003.08.001. [DOI] [PubMed] [Google Scholar]
- 4.Leung D, Hardouin C, Boger DL, Cravatt BF. Nat Biotechnol. 2003;21(6):687–91. doi: 10.1038/nbt826. [DOI] [PubMed] [Google Scholar]
- 5.Mayr LM. Ernst Schering Res Found Workshop. 2006;(58):111–73. doi: 10.1007/978-3-540-37635-4_8. [DOI] [PubMed] [Google Scholar]
- 6.Myers MC, Shah PP, Diamond SL, Huryn DM, Smith AB., 3rd Bioorg Med Chem Lett. 2008;18(1):210–4. doi: 10.1016/j.bmcl.2007.10.107. [DOI] [PMC free article] [PubMed] [Google Scholar]
- 7.Olsen M, Iverson B, Georgiou G. Curr Opin Biotechnol. 2000;11(4):331–7. doi: 10.1016/s0958-1669(00)00108-7. [DOI] [PubMed] [Google Scholar]
- 8.Fox S, Farr-Jones S, Sopchak L, Boggs A, Nicely HW, Khoury R, Biros M. J Biomol Screen. 2006;11(7):864–9. doi: 10.1177/1087057106292473. [DOI] [PubMed] [Google Scholar]
- 9.Blagoev B, Pandey A. Trends Biochem Sci. 2001;26(11):639–41. doi: 10.1016/s0968-0004(01)01977-6. [DOI] [PubMed] [Google Scholar]
- 10.Bryant PA, Venter D, Robins-Browne R, Curtis N. Lancet Infect Dis. 2004;4(2):100–11. doi: 10.1016/S1473-3099(04)00930-2. [DOI] [PubMed] [Google Scholar]
- 11.Gomase V.S.l, Tagore S, Kale KV. Curr Drug Metab. 2008;9(3):221–31. doi: 10.2174/138920008783884795. [DOI] [PubMed] [Google Scholar]
- 12.Kawasumi M, Nghiem P. J Invest Dermatol. 2007;127(7):1577–84. doi: 10.1038/sj.jid.5700853. [DOI] [PubMed] [Google Scholar]
- 13.Tao SC, Chen CS, Zhu H. Comb Chem High Throughput Screen. 2007;10(8):706–18. doi: 10.2174/138620707782507386. [DOI] [PubMed] [Google Scholar]
- 14.Uttamchandani M, Walsh DP, Khersonsky SM, Huang X, Yao SQ, Chang YT. J Comb Chem. 2004;6(6):862–8. doi: 10.1021/cc049900s. [DOI] [PubMed] [Google Scholar]
- 15.Uttamchandani M, Wang J, Yao SQ. Mol Biosyst. 2006;2(1):58–68. doi: 10.1039/b513935j. [DOI] [PubMed] [Google Scholar]
- 16.Venkatasubbarao S. Trends Biotechnol. 2004;22(12):630–7. doi: 10.1016/j.tibtech.2004.10.008. [DOI] [PubMed] [Google Scholar]
- 17.Ma H, Horiuchi KY, Wang Y, Kucharewicz SA, Diamond SL. Assay Drug Dev Technol. 2005;3(2):177–87. doi: 10.1089/adt.2005.3.177. [DOI] [PubMed] [Google Scholar]
- 18.Gosalia DN, Diamond SL. Proc Natl Acad Sci USA. 2003;100(15):8721–6. doi: 10.1073/pnas.1530261100. [DOI] [PMC free article] [PubMed] [Google Scholar]
- 19.Dufva M. Biomol Eng. 2005;22(5-6):173–84. doi: 10.1016/j.bioeng.2005.09.003. [DOI] [PubMed] [Google Scholar]
- 20.Glokler J, Angenendt P. J Chromatogr B Analyt Technol Biomed Life Sci. 2003;797(1-2):229–40. doi: 10.1016/j.jchromb.2003.08.034. [DOI] [PubMed] [Google Scholar]
- 21.MacBeath G. Nat Genet. 2002;32(Suppl):526–32. doi: 10.1038/ng1037. [DOI] [PubMed] [Google Scholar]
- 22.Ziegler C. Fresenius J Anal Chem. 2000;366(617):552–9. doi: 10.1007/s002160051550. [DOI] [PubMed] [Google Scholar]
- 23.Gosalia DN, Salisbury CM, Maly DJ, Ellman JA, Diamond SL. Proteomics. 2005;5(5):1292–8. doi: 10.1002/pmic.200401011. [DOI] [PubMed] [Google Scholar]
- 24.Narayanaswamy R, Niu W, Scouras AD, Hart GT, Davies J, Ellington AD, Iyer VR, Marcotte EM. Genome Biol. 2006;7(1):R6. doi: 10.1186/gb-2006-7-1-r6. [DOI] [PMC free article] [PubMed] [Google Scholar]
- 25.Angenendt P, Lehrach H, Kreutzberger J, Glokler J. Proteomics. 2005;5(2):420–5. doi: 10.1002/pmic.200400955. [DOI] [PubMed] [Google Scholar]
- 26.Baird IS, Yau AY, Mann BK. Biotechniques. 2008;44(2):249–56. doi: 10.2144/000112683. [DOI] [PubMed] [Google Scholar]
- 27.Horiuchi KY, Wang Y, Diamond SL, Ma H. J Biomol Screen. 2006;11(1):48–56. doi: 10.1177/1087057105282097. [DOI] [PubMed] [Google Scholar]
- 28.Robinson WH, DiGennaro C, Hueber W, Haab BB, Kamachi M, Dean EJ, Fournel S, Fong D, Genovese MC, de Vegvar HE, Skriner K, Hirschberg DL, Morris RI, Muller S, Pruijn GJ, van Venrooij WJ, Smolen JS, Brown PO, Steinman L, Utz PJ. Nat Med. 2002;8(3):295–301. doi: 10.1038/nm0302-295. [DOI] [PubMed] [Google Scholar]
- 29.Delehanty JB, Ligler FS. Biotechniques. 2003;34(2):380–5. doi: 10.2144/03342mt02. [DOI] [PubMed] [Google Scholar]
- 30.Gutmann O, Kuehlewein R, Reinbold S, Niekrawietz R, Steinert CP, de Heij B, Zengerle R, Daub M. Lab Chip. 2005;5(6):675–81. doi: 10.1039/b418765b. [DOI] [PubMed] [Google Scholar]
- 31.Ducree J, Gruhler H, Hey N, Bekesi S, Freygang M, Sandmaier H, Zengerle R. Proc. of IEEE-MEMS. 2000:317–322. [Google Scholar]
- 32.Morozov VN, Morozova T. Anal Chem. 1999;71(15):3110–7. doi: 10.1021/ac981412h. [DOI] [PubMed] [Google Scholar]
- 33.Barbulovic-Nad I, Lucente M, Sun Y, Zhang M, Wheeler AR, Bussmann M. Crit Rev Biotechnol. 2006;26(4):237–59. doi: 10.1080/07388550600978358. [DOI] [PubMed] [Google Scholar]
- 34.Delehanty JB. Methods Mol Biol. 2004;264:135–43. doi: 10.1385/1-59259-759-9:135. [DOI] [PubMed] [Google Scholar]
- 35.Gutmann O,R, Niekrawietz R, Kuehlewein R, Steinert CP, Reinbold S, De Heij B, Daub M, Zengerle R. Analyst. 2004;129(9):835–40. doi: 10.1039/b408625m. [DOI] [PubMed] [Google Scholar]
- 36.Nielsen UB, Cardone MH, Sinskey AJ, MacBeath G, Sorger PK. Proc Natl Acad Sci USA. 2003;100(16):9330–5. doi: 10.1073/pnas.1633513100. [DOI] [PMC free article] [PubMed] [Google Scholar]
- 37.Smith JT. Langmuir. 2002;18:6289–6293. [Google Scholar]
- 38.Gray JJ. Curr Opin Struct Biol. 2004;14(1):110–5. doi: 10.1016/j.sbi.2003.12.001. [DOI] [PubMed] [Google Scholar]
- 39.Wong EY, Diamond SL. Anal Biochem. 2008;381(1):101–6. doi: 10.1016/j.ab.2008.06.024. [DOI] [PMC free article] [PubMed] [Google Scholar]


