

Abstract
Accurate predictions of pKa values of titratable groups require taking into account all relevant processes associated with the ionization/deionization. Frequently, however, the ionization does not involve significant structural changes and the dominating effects are purely electrostatic in origin allowing accurate predictions to be made based on the electrostatic energy difference between ionized and neutral forms alone using a static structure. On another hand, if the change of the charge state is accompanied by a structural reorganization of the target protein, then the relevant conformational changes have to be taken into account in the pKa calculations. Here we report a hybrid approach that first predicts the titratable groups, which ionization is expected to cause conformational changes, termed “problematic” residues, then applies a special protocol on them, while the rest of the pKa’s are predicted with rigid backbone approach as implemented in multi-conformation continuum electrostatics (MCCE) method. The backbone representative conformations for “problematic” groups are generated with either molecular dynamics simulations with charged and uncharged amino acid or with ab-initio local segment modeling. The corresponding ensembles are then used to calculate the pKa of the “problematic” residues and then the results are averaged.
Keywords: pKa calculations, conformational changes, MD simulations, homology modeling, electrostatics
INTRODUCTION
Ionizable groups are essential for structure, function and interactions of proteins 1–3. They are frequently involved in catalysis and are responsible for acidic/basic protein unfolding and for the pH-dependence of a variety of biological reactions 4–10. Because of this, an accurate prediction of pKa’s of ionizable groups is crucial for successful modeling of virtually all biological processes 11,12 and further development of new, more precise methods for computing pKa’s is highly desirable as outlined in the last pKa-cooperative meeting (Telluride, June 4–7, 2009).
Current methods have reached an average accuracy (average RMSD or STE) of less than 1 pH unit benchmarked on large datasets of experimentally determined pKa values (as for example the collections available from http://www.sci.ccny.cuny.edu/~mcce/, http://www.jenner.ac.uk/PPD/13 and reported in a number of benchmarking papers 14,15). However, until recently, the benchmarking databases were predominantly made of pKa values of surface exposed ionizable groups. Almost all methods are quite successful in predicting such pKa’s15. However, an analysis of the prominent failures shows that the most “problematic” are the predictions of pKa’s of buried amino acids. Recently, the list of experimentally available pKa values was greatly expanded due to the work performed in Dr. Garcia-Moreno’s lab 16–19. The importance of such an enrichment is that most of the pKa’s were determined for amino acids buried in the hydrophobic core of Staphylococcus Nuclease (SNase) and thus correcting the population ratio of surface versus buried groups and providing a better benchmarking set. The first pKa-cooperative round, which is covered by this special issue, indicated that none of the existing methods can predict these pKa’s with the same level of accuracy (less than 1 pH unit) as they did in the past if benchmarked on databases overly populated by pKa’s of surface-exposed ionizable groups.
All pKa methods utilize structural information, as provided by the corresponding protein data bank (PDB) file, along with some energy calculations to make the pKa predictions. However, the corresponding PDB file represents the structure of the target protein at a specific ionization state as some titratable groups being ionized while others being neutral. At the same time, the ionization of a given amino acid dramatically changes its interactions with the water phase and other charges within the protein. While an ionization of a surface amino acid may not affect protein stability due to water screening, an ionization of a buried or semi-buried group in a non-polar environment could, in principle, reduce protein stability by more than several tens of kcal/mol. Such an energy change is comparable with typical folding free energy and could cause partial unfolding or significant structural changes 20–24. Any attempt to predict the pKa value of such a group using a static 3D structure, corresponding to either an ionized or neutral state of the group, will be potentially wrong and will overestimate the pKa shift. Taking into account the structural relaxation explicitly or implicitly (by assigning large dielectric constant for the protein 25,26 or even more sophisticated dielectric distribution 27,28) will reduce the energy difference between ionized and neutral states and will result in better pKa predictions.
Here we emphasize on the importance that for accurate pKa predictions the methods have to be able to access such induced structural rearrangements. This is expected to be done by the methods allowing backbone structural changes to accompany the calculations of the pKa’s, for example constant pH molecular dynamics simulations 29–34. Here we report two alternative approaches: (1) generating representative conformations with MD, keeping the charged states constant and (2) generating representative conformations with local ab-initio sampling. In both cases, two representative ensembles of structures are generated, each representing the charged and uncharged states of the corresponding “problematic” amino acid.
Another important aspect of pKa calculations utilizing an ensemble of structures, rather than a static structure, is the treatment of the reorganization energy, i.e. the work that has to be done to change the conformation states from a neutral to an ionized charge state of the “problematic” group of interest. Following the previous work of Baptista and coworkers 35, we argue that reorganization energy is a secondary effect and can be omitted. Instead, the pKa value can be predicted as an average of the pKa’s obtained by the corresponding representative structures.
METHODS
The protocol that we used to generate our predictions for pKa-cooperative rounds roughly can be divided into three steps: (a) identification of “problematic” groups; (b) generation of representative structures for both ionized and neural states of the problematic group and (c) calculating the pKa of the problematic group using the representative structures and making the predictions. Below we describe the details of these steps.
Predicting “problematic” groups
The initial screening was done by applying default settings and running MCCE on the corresponding structure of SNase, wild type or in silico generated mutants (see pKa-cooperative webpage for details). The dielectric constant of the protein was kept low, εp=4.0. At such parameters, the MCCE was shown to be very accurate if benchmarked on “standard” dataset of experimentally determined pKa’s 36. However, the very same protocol, applied on the pKa’s listed for pKa-cooperative initiative, resulted in many predicted pKa shifts of more than 5 pH units with respect to the standard solution pKa values. The “problematic” residues were predicted as residues satisfying two criteria:
Rigid backbone structure MCCE calculations with a low protein dielectric constant predict pKa shift larger than 5 pH units.
Structural analysis reveals no strong hydrogen bonds supporting the ionized form of the corresponding residue.
Generating alternative backbone structures with MD simulations
The corresponding 3D structure with ionizable group predicted to be “problematic” was subjected to MD simulations using TINKER package 37. Two sets of simulations per “problematic” group were done, a run with a “problematic” charged residue (charge state, CS) and a run with an uncharged form (neutral state, NS). The water phase was modeled with the Still Generalized Born model 38. The reason for choosing implicit solvent presentation is to enhance the sampling and to avoid the friction between protein and water molecules with the goal of exploring larger conformation changes than the modeling with explicit waters. The first step in the protocol was to relax plausible steric clashes, especially for structures with in silico generated mutations. Thus, the initial structures were relaxed with a 200-step minimization performing the Limited Memory BFGS Quasi-Newton Optimization algorithm 37. The minimized structures were then subjected to 2 ns MD simulations using the dynamic.x module of TINKER. The snapshots were collected after the initial equilibration phase of 0.1 ns in intervals of 100 ps.
Generating alternative backbone structures with local ab-initio modeling
Some structural changes may not be easily sampled by the standard, and relatively short, MD simulations described above. As an alternative to the MD simulations, we applied local ab-initio structural modeling. This was motivated by the analysis of the results from MD simulations performed on selected sets of SNase mutants and carried over longer simulation times. The analysis indicated that the overall 3D structure of SNase is very stable and does not change by much during the simulation time. However, the side chain of a buried charged group tries to make its way out of the hydrophobic core and to get exposed (either fully or partially) to the water phase. Two distinctive mechanisms were observed: (a) short side chains, as Asp or Glu, if originally pointing toward hydrophobic core of the protein, bend themselves toward the water phase and cause distortion of their own backbone structure and the backbone structure of neighboring residues; and (b) long side chains, as Lys and Arg, if pointing toward the hydrophobic core of the SNase, tend to adopt extended conformations and perturb the backbone structure of the residues obscuring their exposure to the water while not causing any conformational change of their own backbone. These observations were used to apply two protocols for generating alternative backbone conformations. The local ab-initio segments modeling was done with the LOOPY program 39, developed in Barry Honig’s lab. Default parameters were used. LOOPY generates a 3D structure of a structural segment provided that the endpoints are known. In the calculation protocol, the “problematic” residues were considered to be charged.
Approach toward short side chain residues. The alternative backbone conformations associated with Asp and Glu predicted to be “problematic” residues were generated in the following fashion. The original PDB structure was modified by deleting amino acid segments of length seven (other lengths were explored as well) centered on the “problematic” residue. The sequence card in the PDB file header was kept unchanged. The structure with deleted segment was then subjected to LOOPY and the missing segment was generated ab-initio. The sequence content was taken from the sequence card (note that in case of in silico generated mutants, the sequence card was originally changed to include the mutation). To generate more than one prediction, different options of LOOPY were explored (as for example, all atoms versus heavy atoms only). These alternative backbone structures were considered to represent the ionized ensemble (CS) of the “problematic” group.
Approach toward long side chain residues. By visual inspection, we identified structural segments that prevent the titratable atom(s) to be exposed to the water. Secondary structure elements as helices and beta strands were avoided. It was motivated by the intention to keep SNase structure intact, while allowing for structural changes associated with loops. At the same time, extended loop conformations in the original PDB file were avoided as well, since ab-initio predictions in such cases result in very similar 3D structures. More than one alternative structures were generated by varying the segment length from five up to nine amino acids and/or picking up different loops.
Predicting pKa’s of “problematic” groups
In principle, if the endpoint structures are available, i.e. the ensemble of structures representing charged and uncharged states of a particular titratable group, one can calculate the free energy difference between the charged and uncharged states and predict the corresponding pKa. The result is independent of the transition path since we are interested in the equilibrium process. However, estimating the absolute free energy of an ensemble of alternative backbone structures is not a trivial task and frequently results in errors larger than expected pKa shifts. To avoid such cases and to keep our protocol simple, we adopted the approach that was originally developed by Baptista and coworkers 35 and reflecting the approaches described by Warshel and coworkers 40,41. Essentially the approach claims that the reorganization energy for achieving the transition from a charged to uncharged state is of secondary order and can be omitted from the pKa predictions (for more details see original work of Baptista and coworkers (Ref 35, supplementary material). Thus, the pKa’s were calculated as:
| (1) |
where pKa,i are the pKa’s calculated using the corresponding alternative “i” structure. N is the number of alternative structures, evenly split between representatives of charged (CS) and uncharged (NS) states.
For the purposes of the pKa-cooperative, the titration curves were generated as the mean of the fractional ionization (qi(pH)) calculated with each representative structures as:
| (2) |
This approach presumes that representative structures, i.e. their free energies, obey a Boltzmann distribution of states. While this perhaps is a reasonable assumption for the structures generated with MD (although it can be debated how long the MD simulations should be and what should be the technique used for sampling), it is not obvious that this is the case for an ab-initio segment modeling protocol. In addition, the alternative structures generated (N) with an ab-initio protocol are much less than those generated with MD. These are inherent limitations associated with an ab-initio segment modeling approach.
RESULTS AND DISCUSSION
Here we present the results of our predictions first providing a detailed analysis of several cases and then reporting our results for the entire set of pKa’s of SNase mutants.
Analysis of the mutants at site 66
All mutants (D, E and K) introduced at these sites were predicted to be “problematic” residues. The pKa’s calculated with original PDB structures are provided in the supplementary material and they all are predicted to be shifted by more than 5 pH units. In addition, structural analysis showed that neither of the mutated residues makes strong hydrogen bonds with protein moiety. Because of this, all structures with a mutant introduced at the above sites were subjected to either MD simulation or to ab-initio segment prediction. The results are discussed below, per each substitution.
(a) V66→D
2 ns simulations were done and snap shots were collected each 0.1 ns. We confirm other researchers’ observation 21,42,43 that the turn of the helix where Asp66 resides undergoes slight unfolding letting Asp66 side chain to be exposed to the water phase. This conformational change was found to occur in both MD simulations, with charged and uncharged Asp66. The corresponding 2×20 snap shot structures were subjected to MCCE to calculate the pKa of Asp66. Results are shown in Fig. 1 separately for snap shots obtained with Asp66 ionized and uncharged, as well as for pKa’s averaged among these two. The lines connecting data points are to guide the eye only. In terms of conformational changes, the MD simulations were capable of generating conformations that expose the side chain of Asp66 to the water phase. It takes less than several hundred ps. Once the Asp66 side chain gets exposed to the water, the desolvation penalty reduces dramatically and the calculated pKa’s are very close to unperturbed (solution) pKa’s (Fig. 1). While the predicted pKa’s are still away from the experimental value of 8.7 and the pKa shifts are under predicted, the results indicate the potential of generating alternative backbone conformations, since without such conformations, the pKa of Asp66 was predicted to be extremely high (pKa > 11.0, see supplementary materials). Applying eq. (1), one gets pKa = 3.12.
Fig. 1.

Calculated pKa’s for V66D mutant of SNase as a function of the MD simulation time. The experimental pKa is shown as a solid line.
(b) V66→E
The MD simulations predicted different effects with Glu66 charged and uncharged (Fig. 2). It takes more than 0.1 ns for the side chain of charged Glu66 to get out from the hydrophobic pocket and to be exposed to the water phase. This conformational change is accomplished by the same mechanism as in the case of Asp66, resulting in a partial unfolding of the helix where Glu66 is situated. However, the MD simulations with uncharged Glu66 predicted no significant structural changes and the side chain of Glu66 remained inside the hydrophobic pocket. Figure 2 shows a superimposition of the X-ray structure (white), the snap shots at t=0.2ns (blue) and t=0.4ns (green) with charged Glu66, and the same (t=0.2ns, red and t=0.4ns, orange) for uncharged Glu66. It can be seen that the uncharged Glu66 side chain stays in the core of the protein. The corresponding snap shot structures were also subjected to MCCE calculations and the results are shown in Fig. 3. The pKa’s calculated with snap shots obtained with ionized Glu66 are drastically different from those obtained with neutral Glu66. Interestingly, the average pKa stays close to the experimental value. This is a particular example of successful pKa calculations with alternative backbone conformations, especially keeping in mind that the pKa of Glu66 was outside the range if calculated with original structure (see supplementary material, pKa > 14.0). Two distinctive conformations were generated; a conformation with Glu66 side chain exposed to the water phase representing the charged state of Glu66, and a conformation with Glu66 side chain still being in the hydrophobic core of the protein representing the neutral state of Glu66. Applying eq. (1) results in a pKa = 7.57.
Fig. 2.

Superimposed snap shot structures of V66E mutant in ribbon presentation. The side chain of Glu66 is shown in stick presentation. The X-ray structure is shown in white, the color scheme for snap shots with charged Glu66 at t=0.2ns (blue) and t=0.4ns (green) and with uncharged Glu66 at=0.2ns (red) and t=0.4ns (orange).
Fig. 3.

Calculated pKa’s for V66E mutant of SNase as a function of the MD simulation time. The experimental pKa is shown as a solid line.
(c) V66→K
The protein remains very stable, the conformational changes are saddle and the side chain of Lys66 (both charged and uncharged) remains buried in the hydrophobic core of SNase until the simulation time reaches 1.2 ns. However, after 1.2 ns of simulation time with charged Lys66, the beta sheet covering Lys66 undergoes a conformational change letting the titratable atoms of Lys66 to be partially exposed to the water phase. The corresponding MCCE calculations using these snap shots (t > 1.2 ns) resulted in an average pKa of 4.8, very close to the experimental value of 5.6 (Fig. 4). This is another successful example since the calculations with original structures resulted in pKa predictions smaller than zero (see supplementary material, pKa < 0.0). However, the main problem is to figure out what the threshold simulation time should be taken to collect pKa’s. Without knowledge of the experimental pKa and applying eq. (1), one would predict a pKa=1.45, which although being better than the static backbone pKa, is still far away from the experimental value of 5.6.
Fig. 4.

Calculated pKa’s for V66K mutant of SNase as a function of the MD simulation time. The experimental pKa is shown as a solid line. The pKa’s calculated with NS ensemble is always zero.
Using random walk procedure to generate backbone alternative structures
Using the random walk (RW) method 43–45, we generated alternative backbone structures to calculate titration curves and the corresponding pKa’s for V66 mutants of SNase. We generated 20 structures per mutant out of which 10 structures represent the charged state (CS) and the other 10 structures corresponding to neutral state (NS) of the amino acid of interest. Each structure was independently subjected to MCCE calculations and the corresponding titration curve calculated in the pH interval from 0.0 to 14.0. Below we present the results for each mutant and compare them with those obtained with structures generated with standard MD simulations and GB solvation model.
(a) V66→D
The first question to address is how different the structures representing CS and NS are. Analysis of the RW structures confirmed previous observations that the structural changes are mostly localized around the mutation site. The overall Ca RMSD varies among the mutants but in most cases stays within 1–2 Å. However, a dramatic structural difference in CS is observed near the mutation site associated either with the secondary structure element where the mutation site is or with structural segments covering it. In the supplementary material, we demonstrate the difference between CS and NS by showing titration curves calculated with the corresponding structures (Fig. 1S). The titration curves shown in red were obtained using structures corresponding to CS while the green curves represent the same calculations using the NS structures. It can be seen that red and green curves are clustered and if used independently will result in quite different pKa’s, each either too low or too high compared with the experimental value of 8.1. However, if we apply the methodology of averaging over the titration curves as described in the proposal, the resulting titration curve and the corresponding pKa are similar to experimental data (red curve in Fig. 5). Figure 5 shows the averaged titration curve using RW generated alternative backbone structures and for comparison the same done using MD generated structures. In this particular case, the RW generated structures resulted in better pKa prediction. An analysis of the 3D structures showed that the main reason is that of the structures representing NS. The MD generated NS structures resulted in Asp66 side chain almost completely exposed to the water phase, while in the RW generated NS structures the side chain of Asp66 was almost completely buried. This caused the titration curves calculated with RW generated NS structures to be shifted to high pH and thus compensating for the low pH shift of titration curves calculated with CS structures (see Fig.1). As a result, the averaged titration curve calculated with RW structures is 7.2, very close to the experimental value of 8.1, and thus outperforming in terms of pKa calculations, the MD generated ensemble. At the same time, it is interesting to mention, that the pKa calculations with the RW combined with full energy integration reported by Yang and coworkers resulted in a pKa = 7.6 43, a value very close to the pKa reported in this work, pKa of 7.2.
Fig. 5.

The averaged titration curves obtained with structures generated with MD approach or with random walk (RW) approach for V66Asp mutant.
(b) V66→E
In this case, the RW generated 3D structures resulted in titration curves shifted to low a pH compared with the titration curves calculated with an MD generated ensemble. Predicted pKa’s are 5.1 and 7.3, respectively, and the experimental value is 8.5. An analysis of the structures showed that the main reason for the underperformance of RW-based calculations is the structural ensemble of NS, in which the side chain of Glu66 is almost fully solvated.
(c) V66→K
The predicted pKa of Lys66 using RW generated structures is 7.4, which is reasonably close to the experimental value of 5.6. At the same time, the pKa of 4.8 with MD generated structures is delivered using the last snap shots only. If we were to average all MD obtained titration curves, the pKa would be much lower (see Fig. 4).
The above comparison of the results obtained with MD versus RW generated structures indicates the importance of generating appropriate alternative conformations. It was found that if the general structural feature among MD and RW generated structures are similar, the resulting titration curves are similar as well.
Example of results obtained with ab-initio segment modeling
In twenty nine cases the MD generated conformations were very close to the initial structure and thus did not provide enough structural variation to improve rigid backbone predictions. A typical example is the L36K mutant for which our initial calculations resulted in pKa=0.1, which is 7.1 pH units away from the experimental value (pKa(exp)=7.2). The side chain of Lys36 points directly to the hydrophobic core of SNase and does not have any hydrogen acceptors in the vicinity of the titratable group. The desolvation penalty, calculated with a low dielectric constant of εp = 4 is huge, resulting in predictions that Lys36 is deprotonated in the entire pH range. Our attempts to generate alternative structures with MD while keeping Lys36 charged were unsuccessful. During the simulations, the structure remained very stable and practically did not change. Structural analysis revealed that the Lys36 titratable group can, in principle, be hydrated if the structural segments shielding it from the water change their conformation. The loop connecting beta-strand four and helix two is an obvious candidate for structural remodeling. Thus, the segment which was modeled ab-initio comprised of residues 84 to 94 (including the end of beta-strand four). It can be seen (Fig. 8) that such a remodeling opens a cleft that partially hydrates the side chain of Lys36 and greatly reduces the desolvation penalty. This alternative structure was used as a representative of the structural ensemble of the charged state (CS) of Lys36. The corresponding pKa calculations resulted in pKa = 5.7, which is much better than the original prediction made with the rigid backbone structure.
Fig. 8.
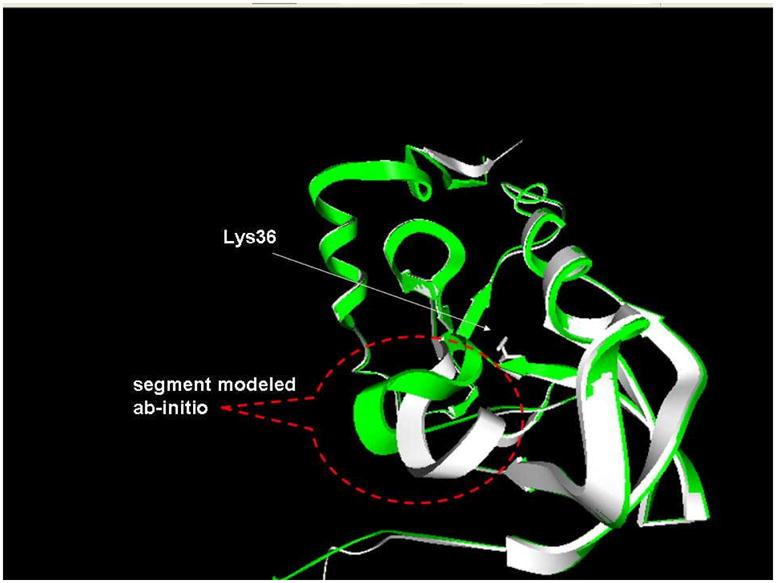
The wild type structure (PDB ID 3EJI) shown in white superimposed onto the modified structure (green). The segment that was modeled ab-initio comprises of residues 84–95. The Lys36 side chain is shown with ball-and-stick presentation.
General analysis of all predictions
We submitted 94 × 2 = 184 titration curves to the pKa-cooperative. They were calculated as explained in the method section, using eq. (2). The first set of predictions was made by taking the “mean” of the corresponding average occupancy <qi> at a particular pH (pH=0 to 14, in 1 pH unit intervals), while the second set was made by taking the “median”. This resulted in titration curves with different shapes, but did not affect the predicted pKa’s by much. Among the final predictions, 65 were made with MD generated alternative structures and 29 with in-silico generated alternative backbone conformations. However, in this paper we summarize the results reported on the pKa-cooperative meeting, which were entirely predicted with the MD protocol. In addition, only “non restricted”, publicly available experimental pKa’s, are benchmarked in order to provide estimation of the quality of predictions per residue type.
In Fig. 2S in supplementary material we show the ΔpKa=|pKa(experiment)-pKa(calc)| for 19 “non restricted” cases. The corresponding RMSDs are: RMSD(all) = 3.14; RMSD(Lys)= 3.82; RMSD(Glu) = 2.04; RMSD(ARG) = 1.46 and RMSD(Asp) = 1.17 in pK units. Figure 2S and the above RMSDs indicate that most difficult to predict are the pKa’s of Lys residue, while the pKa’s short side chain residue Asp are calculated with accuracy similar to the accuracy obtained if benchmarked on “standard” pKa’s database. The main reason for that is that the required conformational changes to expose the titratable group to the water phase are easier to achieve for short side chains using MD simulations, while longer side chains as Lys takes much longer simulation time. Even is some cases, as discussed above, simulation time of 2ns is not enough to solvate Lys side chain. The Arg side chains are longer than Lys, but are predicted with better accuracy. Perhaps this is related to the overall size of SNase molecule, which is relatively small protein and because of that a buried Arg side chain can relatively easy make its way out from the hydrophobic core by small structural perturbation of the structural segment which obscures it from the water.
CONCLUSION
The approach described in the manuscript, the hybrid approach, offers a significant improvement over the pKa calculations using static backbone structure. Without backbone relaxation, the vast majority of the predictions for the pKa-cooperative set of experimental pKa’s resulted in pKa shifts more than 5 pH units, grossly overestimating experimental data. Accounting for plausible backbone reorganization, either with MD simulations or with ab-initio segment modeling, resulted in much better predictions, as pointed out in the main body of the manuscript. One of the main advantages of the hybrid approach is that it retains the speed and simplicity of original MCCE algorithm for the predictions of pKa’s of groups that are not “problematic”, which is frequently the case, and at the same time, improves the predictions for “problematic” residues with relatively small computational cost. In addition, while keeping the protocol relatively simple and fast, the hybrid approach offers a structural explanation of the effects associated with the pKa shifts of “problematic” groups.
However, despite of the success of the hybrid method, there are still cases for which we were unable to make reasonable predictions, since neither the MD nor the ab-initio sampling managed to expose (at least partially) the originally buried titratable group to the water phase. Such cases require either more enhanced sampling techniques or ab-initio modeling including longer structural segments and perhaps including helix and beta strand modeling as well. Another unresolved issue is associated with over relaxation, resulting in predictions of very small pKa shifts while experimental data indicates pKa shifts of several pH units. This problem indicates that additional considerations should be taken for some groups, perhaps, including friction in the MD simulations or reducing the sampling space in the ab-initio modeling. Obviously, some criterion needs to be developed to distinguish between these two cases, i.e. the cases requiring larger or smaller conformational changes, and such residues should be subjected to different protocols.
Supplementary Material
Fig. 6.

The averaged titration curves obtained with structures generated with MD approach or with random walk (RW) approach for V66Glu mutant.
Fig. 7.

The averaged titration curves obtained with structures generated with MD approach or with random walk (RW) approach for V66Lys mutant. Only the last (t = 2ns) snap shot of the MD simulations are taken into account.
Acknowledgments
The work was supported by a grant from the Institute of General Medical Sciences, National Institutes of Health, award number 1R01GM093937-01.
LITERATURE
- 1.Kamerlin SC, Haranczyk M, Warshel A. Progress in ab initio QM/MM free-energy simulations of electrostatic energies in proteins: accelerated QM/MM studies of pKa, redox reactions and solvation free energies. J Phys Chem B. 2009;113(5):1253–1272. doi: 10.1021/jp8071712. [DOI] [PMC free article] [PubMed] [Google Scholar]
- 2.Warshel A, Sharma PK, Kato M, Parson WW. Modeling electrostatic effects in proteins. Biochim Biophys Acta. 2006;1764(11):1647–1676. doi: 10.1016/j.bbapap.2006.08.007. [DOI] [PubMed] [Google Scholar]
- 3.Baker NA, McCammon JA. Electrostatic interactions. Methods Biochem Anal. 2003;44:427–440. [PubMed] [Google Scholar]
- 4.Whitten S, Garcia-Moreno B. pH Dependence of Stability of Staphyloccocal Nuclease: Evidence of Substantial Electrostatic Interactions in the Denaturated State. Biochemistry. 2000;39:14292–14304. doi: 10.1021/bi001015c. [DOI] [PubMed] [Google Scholar]
- 5.Tollinger M, Crowhurst K, Kay L, Forman-Kay J. Site-specific contributions to the pH dependence of protein stability. Proc Natl Acad Sci USA. 2003;100(8):4545–4550. doi: 10.1073/pnas.0736600100. [DOI] [PMC free article] [PubMed] [Google Scholar]
- 6.Frantz C, Barreiro G, Dominguez L, Chen X, Eddy R, Condeelis J, Kelly MJ, Jacobson MP, Barber DL. Cofilin is a pH sensor for actin free barbed end formation: role of phosphoinositide binding. J Cell Biol. 2008;183(5):865–879. doi: 10.1083/jcb.200804161. [DOI] [PMC free article] [PubMed] [Google Scholar]
- 7.Garcia-Moreno B. Adaptations of proteins to cellular and subcellular pH. J Biol. 2009;8(11):98. doi: 10.1186/jbiol199. [DOI] [PMC free article] [PubMed] [Google Scholar]
- 8.Talley K, Alexov E. On the pH-optimum of activity and stability of proteins. Proteins. 2010;78(12):2699–2706. doi: 10.1002/prot.22786. [DOI] [PMC free article] [PubMed] [Google Scholar]
- 9.Chan P, Warwicker J. Evidence for the adaptation of protein pH-dependence to subcellular pH. BMC Biol. 2009;7:69. doi: 10.1186/1741-7007-7-69. [DOI] [PMC free article] [PubMed] [Google Scholar]
- 10.Kukic P, Nielsen J. Electrostatics in proteins and protein-ligand complexes. FUTURE MEDICINAL CHEMISTRY. 2010;4:647–666. doi: 10.4155/fmc.10.6. [DOI] [PubMed] [Google Scholar]
- 11.Jensen JH. Calculating pH and salt dependence of protein-protein binding. Curr Pharm Biotechnol. 2008;9(2):96–102. doi: 10.2174/138920108783955146. [DOI] [PubMed] [Google Scholar]
- 12.Mitra R, Shyam R, Mitra I, Miteva MA, Alexov E. Calculation of the protonation states of proteins and small molecules: Implications to ligand-receptor interactions. Current computer-aided drug design. 2008;4:169–179. [Google Scholar]
- 13.Toseland CP, McSparron H, Davies MN, Flower DR. PPD v1.0--an integrated, web-accessible database of experimentally determined protein pKa values. Nucleic Acids Res. 2006;34(Database issue):D199–203. doi: 10.1093/nar/gkj035. [DOI] [PMC free article] [PubMed] [Google Scholar]
- 14.Davies MN, Toseland CP, Moss DS, Flower DR. Benchmarking pK(a) prediction. BMC Biochem. 2006;7:18. doi: 10.1186/1471-2091-7-18. [DOI] [PMC free article] [PubMed] [Google Scholar]
- 15.Stanton C, Houk K. Benchmarking pKa Prediction methods for residues in Proteins. J Chem Theory and Computation. 2008;4:951–966. doi: 10.1021/ct8000014. [DOI] [PubMed] [Google Scholar]
- 16.Harms MJ, Schlessman JL, Chimenti MS, Sue GR, Damjanovic A, Garcia-Moreno B. A buried lysine that titrates with a normal pKa: role of conformational flexibility at the protein-water interface as a determinant of pKa values. Protein Sci. 2008;17(5):833–845. doi: 10.1110/ps.073397708. [DOI] [PMC free article] [PubMed] [Google Scholar]
- 17.Fitch CA, Karp DA, Lee KK, Stites WE, Lattman EE, Garcia-Moreno EB. Experimental pK(a) values of buried residues: analysis with continuum methods and role of water penetration. Biophys J. 2002;82(6):3289–3304. doi: 10.1016/s0006-3495(02)75670-1. [DOI] [PMC free article] [PubMed] [Google Scholar]
- 18.Baran KL, Chimenti MS, Schlessman JL, Fitch CA, Herbst KJ, Garcia-Moreno BE. Electrostatic effects in a network of polar and ionizable groups in staphylococcal nuclease. J Mol Biol. 2008;379(5):1045–1062. doi: 10.1016/j.jmb.2008.04.021. [DOI] [PubMed] [Google Scholar]
- 19.Castaneda CA, Fitch CA, Majumdar A, Khangulov V, Schlessman JL, Garcia-Moreno BE. Molecular determinants of the pKa values of Asp and Glu residues in staphylococcal nuclease. Proteins. 2009;77(3):570–588. doi: 10.1002/prot.22470. [DOI] [PubMed] [Google Scholar]
- 20.Damjanovic A, Wu X, Garcia-Moreno B, Brooks BR. Backbone relaxation coupled to the ionization of internal groups in proteins: A self-guided Langevin dynamics study. Biophys J. 2008 doi: 10.1529/biophysj.108.130906. [DOI] [PMC free article] [PubMed] [Google Scholar]
- 21.Kato M, Warshel A. Using a charging coordinate in studies of ionization induced partial unfolding. J Phys Chem B. 2006;110(23):11566–11570. doi: 10.1021/jp061190o. [DOI] [PubMed] [Google Scholar]
- 22.Gribenko AV, Makhatadze GI. Role of the charge-charge interactions in defining stability and halophilicity of the CspB proteins. J Mol Biol. 2007;366(3):842–856. doi: 10.1016/j.jmb.2006.11.061. [DOI] [PubMed] [Google Scholar]
- 23.Mazzini A, Polverini E, Parisi M, Sorbi RT, Favilla R. Dissociation and unfolding of bovine odorant binding protein at acidic pH. J Struct Biol. 2007;159(1):82–91. doi: 10.1016/j.jsb.2007.02.007. [DOI] [PubMed] [Google Scholar]
- 24.Sato S, Raleigh DP. pH-dependent stability and folding kinetics of a protein with an unusual alpha-beta topology: the C-terminal domain of the ribosomal protein L9. J Mol Biol. 2002;318(2):571–582. doi: 10.1016/S0022-2836(02)00015-3. [DOI] [PubMed] [Google Scholar]
- 25.Antosiewicz J, McCammon J, Gilson M. Prediction of pH dependent properties of proteins. JMol Bio. 1994;238:415–436. doi: 10.1006/jmbi.1994.1301. [DOI] [PubMed] [Google Scholar]
- 26.Antosiewicz J, McCammon JA, Gilson MK. The determinants of pKas in proteins. Biochemistry. 1996;35(24):7819–7833. doi: 10.1021/bi9601565. [DOI] [PubMed] [Google Scholar]
- 27.Warwicker J. Simplified methods for pKa and acid pH-dependent stability estimation in proteins: removing dielectric and counterion boundaries. Protein Sci. 1999;8(2):418–425. doi: 10.1110/ps.8.2.418. [DOI] [PMC free article] [PubMed] [Google Scholar]
- 28.Warwicker J. Improved pKa calculations through flexibility based sampling of a water-dominated interaction scheme. Protein Sci. 2004;13(10):2793–2805. doi: 10.1110/ps.04785604. [DOI] [PMC free article] [PubMed] [Google Scholar]
- 29.Wallace JA, Shen JK. Predicting pKa values with continuous constant pH molecular dynamics. Methods Enzymol. 2009;466:455–475. doi: 10.1016/S0076-6879(09)66019-5. [DOI] [PubMed] [Google Scholar]
- 30.Stern HA. Molecular simulation with variable protonation states at constant pH. J Chem Phys. 2007;126(16):164112. doi: 10.1063/1.2731781. [DOI] [PubMed] [Google Scholar]
- 31.Mongan J, Case DA, McCammon JA. Constant pH molecular dynamics in generalized Born implicit solvent. J Comput Chem. 2004;25(16):2038–2048. doi: 10.1002/jcc.20139. [DOI] [PubMed] [Google Scholar]
- 32.Mongan J, Case DA. Biomolecular simulations at constant pH. Curr Opin Struct Biol. 2005;15(2):157–163. doi: 10.1016/j.sbi.2005.02.002. [DOI] [PubMed] [Google Scholar]
- 33.Machuqueiro M, Baptista AM. Constant-pH molecular dynamics with ionic strength effects: protonation-conformation coupling in decalysine. J Phys Chem B. 2006;110(6):2927–2933. doi: 10.1021/jp056456q. [DOI] [PubMed] [Google Scholar]
- 34.Machuqueiro M, Baptista AM. Acidic range titration of HEWL using a constant-pH molecular dynamics method. Proteins. 2008;72(1):289–298. doi: 10.1002/prot.21923. [DOI] [PubMed] [Google Scholar]
- 35.Eberini I, Baptista AM, Gianazza E, Fraternali F, Beringhelli T. Reorganization in apo- and holo-beta-lactoglobulin upon protonation of Glu89: molecular dynamics and pKa calculations. Proteins. 2004;54(4):744–758. doi: 10.1002/prot.10643. [DOI] [PubMed] [Google Scholar]
- 36.Song Y, Mao J, Gunner MR. MCCE2: Improving Protein pKa Calculations with Extensive Side Chain Rotamer Sampling. Comp Chem. 2009;30(14):2231–2247. doi: 10.1002/jcc.21222. [DOI] [PMC free article] [PubMed] [Google Scholar]
- 37.Ponder JW. TINKER-software tools for molecular design. Vol. 3.7. St. Luis: Washington University; 1999. [Google Scholar]
- 38.Still WC, Tempczyk A, Hawley RC, Hendrickson T. Semianalytical Treatment of Solvation for Molecular Mechanics and Dynamics. J Am Chem Soc. 1990;112:6127–6129. [Google Scholar]
- 39.Xiang Z, Soto CS, Honig B. Evaluating conformational free energies: the colony energy and its application to the problem of loop prediction. Proc Natl Acad Sci U S A. 2002;99(11):7432–7437. doi: 10.1073/pnas.102179699. [DOI] [PMC free article] [PubMed] [Google Scholar]
- 40.Schulz C, Warshel A. What Are the Dielectric "Constants" of Proteins and How To Validate Electrostatic Models. Proteins. 2001;44:400–417. doi: 10.1002/prot.1106. [DOI] [PubMed] [Google Scholar]
- 41.Sham Y, Chu Z, Warshel A. Consistent Calculations of pKa's of Ionizable Residues in Proteins: Semi-microscopic amd Microscopic Approaches. J Phys Chem. 1997;101:4458–4472. [Google Scholar]
- 42.Ghosh N, Cui Q. pKa of residue 66 in Staphylococal nuclease. I. Insights from QM/MM simulations with conventional sampling. J Phys Chem B. 2008;112(28):8387–8397. doi: 10.1021/jp800168z. [DOI] [PMC free article] [PubMed] [Google Scholar]
- 43.Zheng L, Chen M, Yang W. Random walk in ortogonal space to achieve efficient free-energy simulation of complex systems. Proc Natl Acad Sci U S A. 2008;105:20227–20232. doi: 10.1073/pnas.0810631106. [DOI] [PMC free article] [PubMed] [Google Scholar]
- 44.Chen M, Yang W. On-the-path random walk sampling for efficient optimization of minimum free-energy path. J Comput Chem. 2009;30(11):1649–1653. doi: 10.1002/jcc.21311. [DOI] [PubMed] [Google Scholar]
- 45.Zheng L, Yang W. Essential energy space random walks to accelerate molecular dynamics simulations: convergence improvements via an adaptive-length self-healing strategy. J Chem Phys. 2008;129(1):014105. doi: 10.1063/1.2949815. [DOI] [PubMed] [Google Scholar]
Associated Data
This section collects any data citations, data availability statements, or supplementary materials included in this article.