Abstract
Mitochondrial dysfunction is associated with neurodegenerative diseases and mutations in the HSPD1 gene, encoding the mitochondrial Hsp60 chaperone, are the causative factors of two neurodegenerative diseases, hereditary spastic paraplegia and MitChap60 disease. In cooperation with Hsp10, Hsp60 forms a barrel-shaped complex, which encloses unfolded polypeptides and provides an environment facilitating folding. We have generated an Hsp60 variant with a mutation (Asp423Ala) in the ATPase domain and established a stable human embryonic kidney (HEK293) cell line allowing tetracycline-controlled expression of this mutant variant. We monitored expression of the Hsp60–Asp423Ala variant protein following induction and examined its effects on cellular properties. We showed that the folding of mitochondrial-targeted green fluorescent protein, a well-known substrate protein of Hsp60, was consistently impaired in cells expressing Hsp60–Asp423Ala. The level of the Hsp60–Asp423Ala variant protein increased over time upon induction, cell proliferation stopped after 48-h induction and mitochondrial membrane potential decreased in a time-dependent manner. In summary, we have established a stable cell line with controllable expression of an Hsp60 variant, which allows detailed studies of different degrees of Hsp60 deficiency.
Electronic supplementary material
The online version of this article (doi:10.1007/s12192-011-0275-5) contains supplementary material, which is available to authorized users.
Keywords: Hsp60, Mitochondrial dysfunction, Mitochondrial protein folding, Mitochondrial-targeted GFP, Molecular chaperone
Introduction
For proteins to function properly, they must fold into a defined tertiary structure. Hsp60 (HSPD1 according to Guidelines for the nomenclature of the human heat shock proteins (Kampinga et al. 2009)) is a mitochondrial chaperone that is essential for the folding of certain mitochondrial proteins (Hartl and Hayer-Hartl 2009). It is a component of the mitochondrial protein quality control system, a cooperation of chaperones and proteases that counteracts protein misfolding and aggregation inside mitochondria (Tatsuta and Langer 2008). Expression of Hsp60 is modulated by the mitochondrial unfolded protein response, which is triggered by the presence of unfolded proteins in mitochondria (Zhao et al. 2002; Haynes and Ron 2010; Gregersen and Bross 2010; Aldridge et al. 2007). Hsp60 is a barrel-shaped complex consisting of seven subunits. Together with Hsp10, Hsp60 forms a secluded environment for protein folding. Formation of the complex is dependent on the binding of ATP and dissociation of the complex requires ATP hydrolysis by the Hsp60 subunits (Mayer 2010).
Mutations in HSPD1, the gene encoding Hsp60, cause at least two neurodegenerative diseases, hereditary spastic paraplegia and MitChap60 disease (Hansen et al. 2007; Magen et al. 2008), which affect the central nervous system in different ways. Inactivation of HSPD1 in mice is embryonally lethal (Christensen et al. 2010) which underlines the essential and well-documented role of Hsp60. However, the molecular pathways affected in Hsp60-associated diseases are less well-defined. Large-scale studies have identified a number of proteins that bind and interact with the bacterial Hsp60 homolog GroEL. These include proteins that are obligatory substrates requiring association with GroEL for their folding (Kerner et al. 2005; Hirtreiter et al. 2009; Fujiwara et al. 2010).
Since Hsp60/GroEL-mediated folding is dependent on the ATPase activity of these proteins, the impact of mutations in the ATPase domain has been investigated in GroEL (Rye et al. 1997; Makio et al. 2001). The GroEL variant studied has a mutation (Asp398Ala), which makes it unable to hydrolyse ATP. This blocks release of the co-chaperone GroES and substrate proteins are trapped within the barrel. Asp398 is highly conserved in type-I chaperonins (Brocchieri and Karlin 2000). We have previously engineered a variant of human mitochondrial Hsp60, in which the residue corresponding to Asp398 in GroEL is mutated (Asp423Ala). We have shown that it conferred a dominant negative effect when its expression was induced in Escherichia coli cells deleted for endogenous GroEL/GroES and expressing wild-type Hsp60 (Bross et al. 2008). In the current study, we have produced a stable cell line for tetracycline-controlled expression of the Hsp60–Asp423Ala variant protein in human embryonic kidney (HEK293) cells. We indicate that induction of expression of the Hsp60–Asp423Ala variant confers a dominant negative effect. These model cells can be used to monitor the molecular and cellular effects of different degrees of Hsp60 deficiency.
Materials and methods
Construction of cell lines
HEK293 cells inducible for expression of Hsp60–wt or Hsp60–Asp423Ala were created using the Flp-In T-REx system (Invitrogen). The cells were co-transfected with pcDNA5/FRT/TO plasmids, containing either Hsp60wt or Hsp60–Asp423Ala cDNA sequences, together with pOG44, encoding a Flp-recombinase, according to manufacturer’s instructions. By selection with hygromycin cells with stable integration of the pcDNA5/FRT/TO, vector containing the Hsp60 variants were obtained. Single-cell colonies were screened for the presence of insert and investigated for induced expression of Hsp60 with quantitative reverse-transcriptase polymerase chain reaction (qRT-PCR) and Western blotting. The cells were induced with 1 μg/ml tetracycline for 48 h unless otherwise stated.
Cells were grown at 37°C in 5% CO2, cultured in Dulbecco's modified Eagle's medium containing 10% fetal calf serum, 0.29 mg/mL glutamine, 0.1 streptomycin/mL, 100 units penicillin/mL, and supplemented with 15 μg/ml blasticidin (Invitrogen) and 100 μg/ml hygromycin B (Invitrogen).
Test of the inducible cell system
HSPD1 mRNA and Hsp60 protein levels were measured with qRT-PCR, Western blotting and mass spectrometry (MS). Cells were scraped from the flask and cell pellets stored at −80°. RNA was purified using SV Total RNA isolation system (Promega). cDNA was synthesized from 0.5 μg of total RNA using the iScript™ cDNA Synthesis Kit (BioRad). Subsequent qRT-PCR analysis was performed using custom designed TaqMan gene expression assays analyzed on an ABI Prism 7000 sequence detection system (Applied Biosystems) essentially as described in Hansen et al. (2008). Relative transcript levels were calculated using the standard curve method.
Western blotting and mass spectrometry were applied on the same cell lysates for investigation of the protein levels of Hsp60. Cells were lysed in 50 mM Tris-HCL, pH 7.8, 5 mM ethylenediaminetetraacetic acid, pH 8.0, 1 mM dithiothreitol, 10 μg/mL trypsin inhibitor (Bie & Berntsen), and 1% Trition-X100 containing one tablet Complete™ mini protease inhibitor cocktail tablet (Roche) per 10 ml and subjected to three freeze/thawed cycles followed by 30 s burst in a cooled water bath sonicator (Branson). Cell lysates were centrifuged at 15,000×g for 30 min at 4°C and the protein concentration of the supernatant fraction was measured by Bradford assay (Bio-Rad; Corydon et al. 2005).
For Western blotting, 10 μg protein were subjected to 4–12% sodium dodecyl sulfate (SDS) polyacrylamide gel electrophoresis. Proteins were blotted onto polyvinylidene fluoride membranes (PVDF P; Millipore), probed with primary antibodies (mouse anti-Hsp60 (Sigma) and rabbit anti-VDAC (Abcam)) overnight and detected by horseradish peroxidase-conjugated antibodies (DAKO) and the enhanced chemiluminescence ECL Plus Western blotting detection reagent (Amersham Biosciences).
Immunostaining and confocal laser scanning microscopy
Cells were seeded in slideflasks (Nunc) and either induced with tetracycline (Hsp60wt and Hsp60Asp423Ala cells) or transiently transfected with 2 μg DNA plasmid encoding mitochondrial-targeted green fluorescent protein (mGFP) or green fluorescent protein (GFP), respectively, using FuGene6 (Roche) as transfection reagent according to manufacturer’s instructions. Cells were probed with MitoTracker Red CMXROS (Molecular Probes, Invitrogen) 48 h post-induction/transfection, fixed in normal-buffered formalin and permeabilized in 70% ethanol at −20°C. Wt and Asp423Ala cells were stained for Hsp60 with primary mouse-anti-Hsp60 (Sigma) and secondary Alexa-488-conjugated goat-anti-mouse antibodies (Molecular Probes, Invitrogen).
Sequential imaging was done by using a 488 nm line of a multiline argon laser (detection of Alexa-488), the 563 nm line of a helium–neon laser (detection of MitoTracker Red CMXRos), and the 405 nm line of a 405–30 nm diode laser (detection of 4′,6-diamidino-2-phenylindole) on a confocal laser scanning microscope (LSM 710, Zeiss, Jena, Germany) using 63× oil immersion objective with a numerical aperture of 1.4.
Mass spectrometry and peptide quantification
For mass spectrometry, the region of the lane containing Hsp60 was excised from a Coomassie blue-stained SDS-polyacrylamid gel. After destaining, the proteins were in-gel trypsin digested, purified on C18 PepClean spin columns (Pierce Biotechnology) and vacuum dried. The peptides were then subjected to reverse-phase nanoliquid chromatography (Easy nLC, Proxeon, Odense, Denmark) and eluted to the MS (LTQ-Orbitrap, Thermo Fisher Scientific, Waltham, USA) by an acetonitrile (AcN) gradient. The VTXALNATR peptide eluted at ca 10% AcN for X = A or ca 10.5% AcN for X = D, respectively. Relative quantification of the endogenous Hsp60 (X = D) peptide to two reference peptides in Hsp60, VGLQVVAVK and LSDGVAVLK both identified in a mascot search with a p value <1 × 10⁻⁶ was performed. The full scan peptide peaks of the three peptides, measured with <3 ppm mass accuracy were integrated by the Avalon algorithm in the Qual browser program (Thermo Fisher Scientific). The ratio between the specific endogenous Hsp60 peptide and each of the reference peptides were calculated for the control sample. This ratio was used to calculate a theoretical peak area of the Hsp60 reference peptides in each of the induced samples by multiplication with the integrated area of endogenous Hsp60 peptide from the respective sample. The ratios between the theoretical Hsp60 reference peptides and the actual peak areas of the reference Hsp60 peptides were used as representative values of the ratio between the Hsp60 variant peptide and the endogenous Hsp60 peptide.
Mitochondrial potential and cell proliferation
Hsp60wt and Asp423Ala cells were cultured and induced for 0, 12, 24, 48, 72, and 96 h. Cells harvested at 0 and 12 h were seeded at the same cell density. Cells harvested at 24, 48, 72, and 96 h were seeded 1:2, 1:4, 1:8, and 1:16, respectively. Following harvest, cells were diluted in PBS and cell counts and measurements of mitochondrial membrane potential were carried out with the NucleoCounter N3000 full-spectrum fluorescence microscope system (Chemometec) according to the manufacturer’s instructions. Mitochondrial membrane potential was studied using JC-1, a cationic dye that is transported across the mitochondrial membrane in a potential-dependent manner. JC-1 forms J aggregates in mitochondria (red fluorescence) whereas JC-1 localized outside mitochondria is in a monomeric state (green fluorescence).
As a control for disruption of the membrane potential, non-induced Hsp60wt cells were treated with carbonyl cyanide 3-chlorophenylhydrazone (CCCP; Molecular Probes). The cells were harvested and 1 × 10⁶ cells were suspended in 1 ml pre-heated medium. CCCP was added to a final concentration of 50 μM and the cells were incubated for 5 min at 37°C and measurement of mitochondrial membrane potential on NucleoCounter N3000 was carried out.
Flow cytometry analysis
Prior to flow cytometry Hsp60wt and Asp423Ala cells cultured as previously described, were transiently transfected with 3.75 μg plasmid DNA encoding mGFP using FuGene6 (Roche) as transfection reagent according to manufacturer’s instructions. Three hours post-transfection cells were induced using tetracycline as stated above and after induction for 48 h the cells were harvested and suspended in 500 μl PBS. To eliminate dead cells from the analysis propidium iodide was added to a final concentration of 8 μg/ml in each sample. Cells were analyzed by flow cytometry using FACSaria 1 and FACSDiva 4.1 software (BD Biosciences, Franklin Lakes, NJ, USA). GFP and propidium iodide were exitated by the 488-nm laser and emitted light was collected through 530/30 and 616/23 band-pass filters, respectively.
Results and discussion
Construction of stable cells for tetracycline-inducible expression of Hsp60 variant proteins
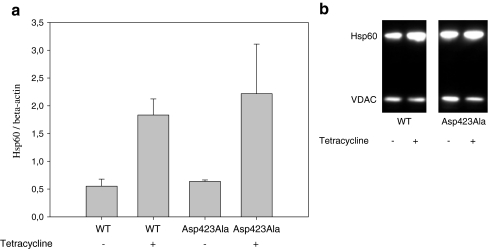
Stably transfected HEK293 cell lines inducible for expression of Hsp60–Asp423Ala and Hsp60–wt variants were created using the Flp-In T-REx system (see “Materials and methods” section). This system allows insertion of exogenic sequences in the same locus and expression of the gene can be controlled by induction with tetracycline. HEK293 cells stably transfected with Hsp60wt are referred to as wt cells and HEK293 cells stably transfected with Hsp60–Asp423Ala are referred to as Asp423Ala cells. The average transcript levels of Hsp60 from three individual experiments with and without tetracycline induction were measured by qRT-PCR and related to β-actin expression (Fig. 1a). Tetracycline induction for 48 h increased Hsp60 mRNA levels approximately threefold in both wt and Asp423Ala cells, compared to non-induced wt and Asp423Ala cells. In line with the qRT-PCR analysis Western blotting showed increased Hsp60 protein levels relative to VDAC in wt and Asp423Ala cells upon tetracycline induction (Fig. 1b).The increase in Hsp60 protein levels is consistent with the amount of mutant protein relative to endogenous Hsp60 protein found in mass spectrometry (see below). Tetracycline induced upregulation of Hsp60 was not seen in Flp-In T-REx HEK293 cells stably transfected with an empty vector (data not shown), indicating that the up regulation seen after tetracycline induction was due to expression of the stably integrated Hsp60 variant gene.
Fig. 1.
Expression analysis of Hsp60 in Flp-In HEK293 cells stably transfected with Hsp60–wt or Hsp60–Asp423Ala cDNA constructs with (+) and without (−) tetracycline induction. a qRT-PCR analysis of Hsp60 transcript levels. Expression of Hsp60 was related to β-actin. Error bars show standard deviation from three individual experiments. b Protein levels of Hsp60 were visualized by Western blotting using the indicated antibodies
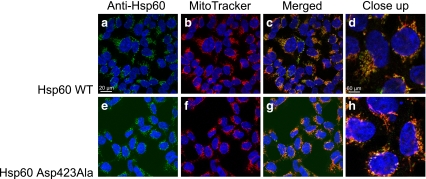
The subcellular localization of Hsp60 in induced wt and Asp423Ala cells was determined by confocal laser scanning microscope analysis shown in Fig. 2. The staining pattern of Hsp60 and the mitochondrial specific dye MitoTracker Red CMXRos co-localized in wt and Asp423Ala cells, respectively. The similar staining patterns indicated no difference in localization between Hsp60wt and Hsp60Asp423Ala.
Fig. 2.
Immunostaining of Hsp60 in stably transfected HEK293 cells. Hsp60wt cells (a–d) and Hsp60Asp423Ala cells (e–h) were induced for expression of Hsp60 for 48 h, incubated with MitoTracker, fixed, and probed with primary mouse-anti-Hsp60 and secondary Alexa-488-conjugated goat-anti-mouse antibodies. Nuclear DNA was counterstained with DAPI; 488 channel (a, e), MitoTracker (b, f), overlay (c, d, g, h)
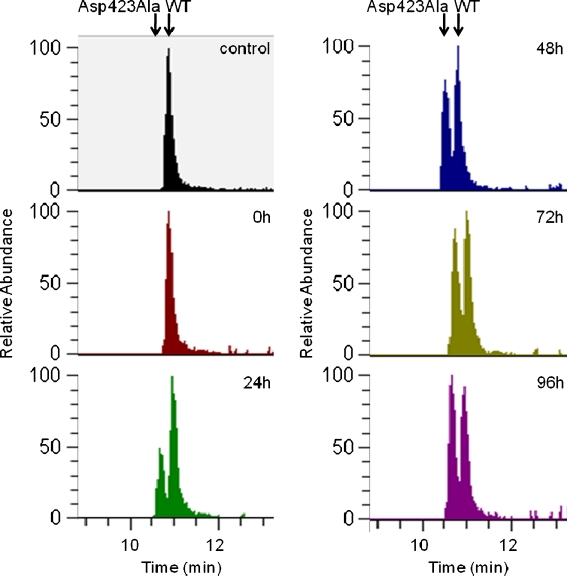
To directly measure the relative abundance of the Hsp60–Asp423Ala compared to the endogenous wild-type protein in the Asp423Ala cells, peptides from cells induced for 0, 24, 48, 72, or 96 h were quantified by mass spectrometry as described in “Materials and methods” section. The tryptic peptides containing the variant position; VTXALNATR (X being either D or A), i.e., 423-Asp or 423-Ala, were detected and the amounts originating from the induced variant peptide were compared to those of the endogenous peptide. As shown in Fig. 3, the relative amounts of the Hsp60–Asp423Ala-specific peptide increased over time reaching peak areas higher than the wild-type peptide after 96 h. Calculations of the ratios of the variant-specific peptides to other Hsp60 peptides showed that the detection response of the variant peptide was lower than that of the wild-type peptide. This indicates that the relative amount of Hsp60–Asp423Ala protein was higher than visually seen by comparing the areas of the peaks in Fig. 3 accumulating to levels clearly higher than those of the wild type at the latest time points.
Fig. 3.
Extracted ion chromatograms from nanoliquid chromatography mass spectrometry of peptides from non-induced wt cells (control), and Asp423Ala cells induced with tetracycline for the time periods indicated. The areas of the peaks represent the relative abundance of the peptide VTXALNATR, X being either D (endogenous Hsp60) or A (Hsp60–Asp423Ala) as indicated by the arrows
Although no peak for the variant peptide is visible at 0 h in Fig. 3, the peptide has confidently been detected in non-induced Asp423Ala cells (detection was below 1% of endogenous Hsp60, data not shown), indicating some leaky repression of the integrated Asp423Ala gene.
Effect of Hsp60–Asp423Ala expression
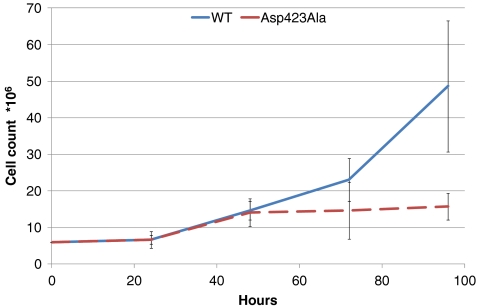
We investigated whether expression of the Hsp60–Asp423Ala protein affected cell proliferation. Cell counts were monitored after induction of expression of the stably transfected Hsp60–Asp423Ala and Hsp60–wt cDNAs, respectively (Fig. 4). The number of wt and Asp423Ala cells after induction with tetracycline for 0, 24, 48, 72, and 96 h were measured. Except for the first 24 h, the number of induced wt cells increased exponentially. Induced Asp423Ala cells followed the same curve as wt cells for the first 48 h; but at 72 and 96 h, proliferation of Asp423Ala cells stalled. The proliferation defect observed in induced Asp423Ala cells indicated that Hsp60 complexes composed of endogenous Hsp60-wt and ectopic Hsp60-Asp423Ala were inactive. This might affect folding of proteins essential for cell proliferation.
Fig. 4.
Total cell counts for wt (blue line) and Asp423Ala (red dashed line) cells. Cells were seeded, harvested at the indicated time points and counted
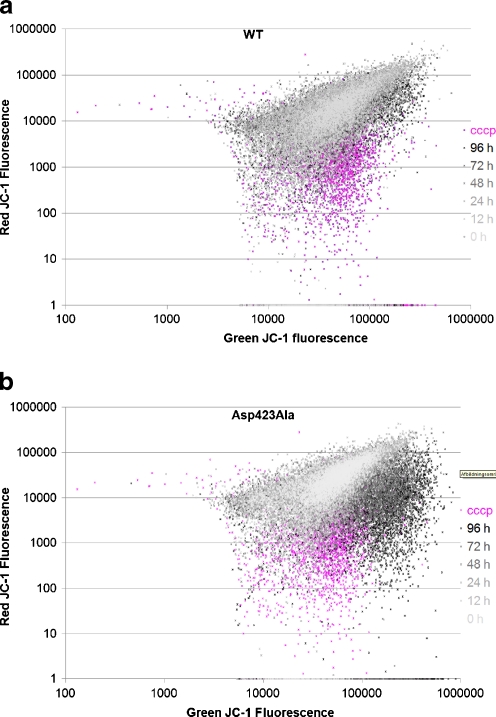
Next, we investigated how expression of the Hsp60–Asp423Ala protein affected the mitochondrial membrane potential. Mitochondrial membrane potential was measured using the lipophilic cationic dye JC-1. Altered membrane potential is reflected by a shift in the red/green fluorescence from JC-1; a shift towards green fluorescence is indicative of a reduction in the mitochondrial membrane potential. CCCP, a membrane potential disrupter, was added to non-induced wt cells as a control.
Red/green JC-1 fluorescence for HEK293 cells induced for expression of Hsp60wt for 12, 24, 48, 72, and 96 h (Fig. 5a) showed only a small variation in the mitochondrial membrane potential between the samples of wt cells harvested up to 72 h induction. However, the mitochondrial membrane potential was slightly reduced in the wt cells induced for 96 h. The Asp423Ala cells showed similar red/green JC-1 fluorescence as the wt cells when non-induced. Remarkably, the membrane potential decreased at every time point upon induction and a dramatic decrease was observed after induction for 96 h (Fig. 5b). At 0, 12, and 24 h, the scatters are located at the same region as the wt cells, but after 48 and up to 96 h, the green fluorescence was increased and the red fluorescence decreased indicating reduction in the mitochondrial membrane potential. In order to investigate whether the cells were apoptotic, DNA fragmentation and free thiols were measured. Both analyses showed no differences between the cells induced for expression of wild type and Asp423Ala Hsp60 (data not shown). The expression of the Hsp60–Asp423Ala protein thus clearly has an impact on mitochondrial membrane potential and cell proliferation but does not significantly induce apoptosis in the time frame up to 96 h after induction.
Fig. 5.
The mitochondrial membrane potential was monitored by measuring the red JC-1 fluorescence relative to the green JC-1 fluorescence as described in “Materials and methods” section. wt cells (a) and Asp423Ala cells (b) were induced with tetracycline, harvested and analyzed with the NucleoCounter N3000 after 0, 12, 24, 48, 72, and 96 h, respectively. Addition of CCCP resulting in disruption of the membrane potential was included as a control (pink). Each dot represents the red/green fluorescence ratio from a single cell
Effect of Hsp60–Asp423Ala expression on mitochondrial protein folding
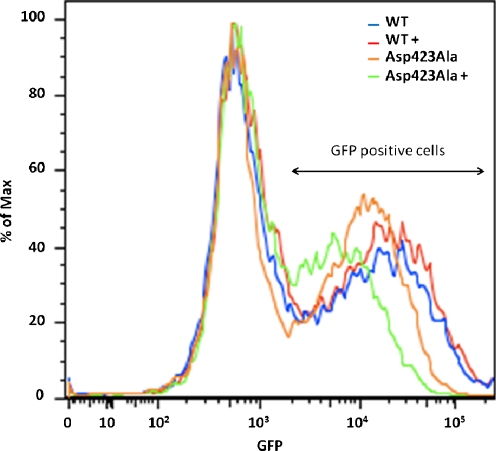
We also investigated how expression of the Hsp60 variants affected intramitochondrial folding by monitoring GFP fluorescence levels of mGFP. Wt and Asp423Ala cells were transiently transfected with mGFP, a previously shown substrate for Hsp60 (Corydon et al. 2005), induced with tetracycline for 48 h and hereafter analyzed for fluorescence from mGFP. Mitochondrial localization of mGFP was confirmed by comparing the staining pattern of mGFP with the mitochondrial marker MitoTracker (Online Resource 1). In the absence of the mitochondrial targeting sequence, GFP was distributed evenly throughout the cell and showed no specific localization to mitochondria.
Induction of Hsp60wt cells showed the same average intensity of mGFP compared to non-induced Hsp60wt cells (Fig. 6). Asp423Ala cells induced with tetracycline showed a decrease in the average intensity of mGFP fluorescence compared to the non-induced Asp423Ala cells. Three individual experiments all showed the same tendencies for both cell lines. We also repeatedly observed that non-induced Asp423Ala cells had slightly lower average mGFP fluorescence intensity than non-induced Hsp60wt cells. This is likely caused by leakiness of the repression of the stably integrated Hsp60 genes as we detected Hsp60Asp423Ala in non-induced Asp423Ala cells (see above). More importantly, expression of Hsp60Asp423Ala clearly has a negative effect on the fluorescence intensity from mGFP. As mGFP is a substrate for Hsp60 and only fluoresces when properly folded, our experiments thus suggest that the decrease in fluorescence intensity is caused by the presence of Hsp60–Asp423Ala subunits in the Hsp60 complexes and this leads to decreased folding of Hsp60 substrates.
Fig. 6.
Fluorescence from transiently transfected mGFP in wt or Asp423Ala cells with (+) and without tetracycline induction was detected by flow cytometry. Cell counts (% of max) for each fluorescence intensity are depicted and normalized to the background fluorescence
Conclusions
Induction of the Hsp60–Asp423Ala variant protein had a strong negative effect on protein folding in mitochondria, mitochondrial membrane potential, and cell proliferation. The effects develop with time as the relative levels of variant Hsp60 in relation to the endogenous wild-type Hsp60 increase. Different degrees of Hsp60 deficiency effects were observed at different time points after induction and our system can thus be used to study the Hsp60 deficiency at various levels of Hsp60 function. Expression of Hsp60–Asp423Ala protein leads to decreased folding of Hsp60 substrates resulting in decreased levels of functional mitochondrial proteins.
Electronic supplementary material
Below is the link to the electronic supplementary material.
CLSM of HEK293 cells expressing mGFP or GFP. HEK293 cells were transiently transfected with mGFP (a–d) or GFP (e–h). The cells were incubated with MitoTracker 48 h after transfection and hereafter fixed. Nuclear DNA was counterstained with DAPI; mGFP-fluorescence (a), GFP fluorescence (e), MitoTracker (b, f), overlay (c, d, g, h) (PDF 9370 kb)
Acknowledgments
This work was supported by funding from the Department of Clinical Medicine, Aarhus University, The Ludvig and Sara Elsass Foundation, The John and Birthe Meyer Foundation, and the Lundbeck Foundation.
References
- Aldridge JE, Horibe T, Hoogenraad NJ. Discovery of genes activated by the mitochondrial unfolded protein response (mtUPR) and cognate promoter elements. PLoS One. 2007;9:e874. doi: 10.1371/journal.pone.0000874. [DOI] [PMC free article] [PubMed] [Google Scholar]
- Brocchieri L, Karlin S. Conservation among HSP60 sequences in relation to structure, function, and evolution. Protein Sci. 2000;3:476–486. doi: 10.1110/ps.9.3.476. [DOI] [PMC free article] [PubMed] [Google Scholar]
- Bross P, et al. The Hsp60-(p.V98I) mutation associated with hereditary spastic paraplegia SPG13 compromises chaperonin function both in vitro and in vivo. J Biol Chem. 2008;23:15694–15700. doi: 10.1074/jbc.M800548200. [DOI] [PMC free article] [PubMed] [Google Scholar]
- Christensen JH et al (2010) Inactivation of the hereditary spastic paraplegia-associated Hspd1 gene encoding the Hsp60 chaperone results in early embryonic lethality in mice. Cell Stress Chaperones. doi:10.1007/s12192-010-0194-x [DOI] [PMC free article] [PubMed]
- Corydon TJ, Hansen J, Bross P, Jensen TG. Down-regulation of Hsp60 expression by RNAi impairs folding of medium-chain acyl-CoA dehydrogenase wild-type and disease-associated proteins. Mol Genet Metab. 2005;4:260–270. doi: 10.1016/j.ymgme.2005.04.003. [DOI] [PubMed] [Google Scholar]
- Fujiwara K, Ishihama Y, Nakahigashi K, Soga T, Taguchi H. A systematic survey of in vivo obligate chaperonin-dependent substrates. EMBO J. 2010;9:1552–1564. doi: 10.1038/emboj.2010.52. [DOI] [PMC free article] [PubMed] [Google Scholar]
- Gregersen N, Bross P (2010) Protein misfolding and cellular stress: an overview. Methods Mol Biol. doi:10.1007/978-1-60761-756-3_1 [DOI] [PubMed]
- Hansen J, et al. A novel mutation in the HSPD1 gene in a patient with hereditary spastic paraplegia. J Neurol. 2007;7:897–900. doi: 10.1007/s00415-006-0470-y. [DOI] [PubMed] [Google Scholar]
- Hansen J, et al. Decreased expression of the mitochondrial matrix proteases Lon and ClpP in cells from a patient with hereditary spastic paraplegia (SPG13) Neuroscience. 2008;2:474–482. doi: 10.1016/j.neuroscience.2008.01.070. [DOI] [PubMed] [Google Scholar]
- Hartl FU, Hayer-Hartl M. Converging concepts of protein folding in vitro and in vivo. Nat Struct Mol Biol. 2009;6:574–581. doi: 10.1038/nsmb.1591. [DOI] [PubMed] [Google Scholar]
- Haynes CM, Ron D. The mitochondrial UPR—protecting organelle protein homeostasis. J Cell Sci Pt. 2010;22:3849–3855. doi: 10.1242/jcs.075119. [DOI] [PubMed] [Google Scholar]
- Hirtreiter AM, et al. Differential substrate specificity of group I and group II chaperonins in the archaeon Methanosarcina mazei. Mol Microbiol. 2009;5:1152–1168. doi: 10.1111/j.1365-2958.2009.06924.x. [DOI] [PubMed] [Google Scholar]
- Kampinga HH, et al. Guidelines for the nomenclature of the human heat shock proteins. Cell Stress Chaperones. 2009;1:105–111. doi: 10.1007/s12192-008-0068-7. [DOI] [PMC free article] [PubMed] [Google Scholar]
- Kerner MJ, et al. Proteome-wide analysis of chaperonin-dependent protein folding in Escherichia coli. Cell. 2005;2:209–220. doi: 10.1016/j.cell.2005.05.028. [DOI] [PubMed] [Google Scholar]
- Magen D, et al. Mitochondrial hsp60 chaperonopathy causes an autosomal-recessive neurodegenerative disorder linked to brain hypomyelination and leukodystrophy. Am J Hum Genet. 2008;1:30–42. doi: 10.1016/j.ajhg.2008.05.016. [DOI] [PMC free article] [PubMed] [Google Scholar]
- Makio T, Takasu-Ishikawa E, Kuwajima K. Nucleotide-induced transition of GroEL from the high-affinity to the low-affinity state for a target protein: effects of ATP and ADP on the GroEL-affected refolding of alpha-lactalbumin. J Mol Biol. 2001;3:555–567. doi: 10.1006/jmbi.2001.4959. [DOI] [PubMed] [Google Scholar]
- Mayer MP. Gymnastics of molecular chaperones. Mol Cell. 2010;3:321–331. doi: 10.1016/j.molcel.2010.07.012. [DOI] [PubMed] [Google Scholar]
- Rye HS, et al. Distinct actions of cis and trans ATP within the double ring of the chaperonin GroEL. Nature. 1997;6644:792–798. doi: 10.1038/42047. [DOI] [PubMed] [Google Scholar]
- Tatsuta T, Langer T. Quality control of mitochondria: protection against neurodegeneration and ageing. EMBO J. 2008;2:306–314. doi: 10.1038/sj.emboj.7601972. [DOI] [PMC free article] [PubMed] [Google Scholar]
- Zhao Q, Wang J, Levichkin IV, Stasinopoulos S, Ryan MT, Hoogenraad NJ. A mitochondrial specific stress response in mammalian cells. EMBO J. 2002;17:4411–4419. doi: 10.1093/emboj/cdf445. [DOI] [PMC free article] [PubMed] [Google Scholar]
Associated Data
This section collects any data citations, data availability statements, or supplementary materials included in this article.
Supplementary Materials
Below is the link to the electronic supplementary material.
CLSM of HEK293 cells expressing mGFP or GFP. HEK293 cells were transiently transfected with mGFP (a–d) or GFP (e–h). The cells were incubated with MitoTracker 48 h after transfection and hereafter fixed. Nuclear DNA was counterstained with DAPI; mGFP-fluorescence (a), GFP fluorescence (e), MitoTracker (b, f), overlay (c, d, g, h) (PDF 9370 kb)


