Abstract
F-box and WD repeat domain-containing 7α (Fbw7α) is the substrate recognition component of a ubiquitin ligase that controls the degradation of factors involved in cellular growth, including c-Myc, cyclin E, and c-Jun. In addition, Fbw7α degrades the nuclear form of sterol regulatory element-binding protein (SREBP)-1a, a global regulator of lipid synthesis, particularly during mitosis in cultured cells. This study investigated the in vivo role of Fbw7α in hepatic lipid metabolism. siRNA knockdown of Fbw7α in mice caused marked hepatosteatosis with the accumulation of triglycerides. However, inhibition of Fbw7α did not change the level of nuclear SREBP-1 protein or the expression of genes involved in fatty acid synthesis and oxidation. In vivo experiments on the gain and loss of Fbw7α function indicated that Fbw7α regulated the expression of peroxisome proliferator-activated receptor (PPAR) γ2 and its target genes involved in fatty acid uptake and triglyceride synthesis. These genes included fatty acid transporter Cd36, diacylglycerol acyltransferase 1 (Dgat1), and fat-specific protein 27 (Cidec). The regulation of PPARγ2 by Fbw7α was mediated, at least in part, by the direct degradation of the Krüppel-like factor 5 (KLF5) protein, upstream of PPARγ2 expression. Hepatic Fbw7α contributes to normal fatty acid and triglyceride metabolism, functions that represent novel aspects of this cell growth regulator.
Keywords: Fatty Acid Metabolism, Liver, Transcription Factors, Triacylglycerol, Ubiquitin Ligase, Fbxw7, Hepatosteatosis
Introduction
F-box and WD repeat domain-containing 7 (Fbw7) is the component of an evolutionarily conserved complex of the Skp1-Cul1-F-box protein ubiquitin ligase and is involved in substrate recognition of the complex (1, 2). Fbw7 targets several proto-oncogenes that function in cell growth and division pathways, including c-Myc (encoded by Myc), cyclin E, Notch, and c-Jun (encoded by Jun) (3–7). Fbw7 is perturbed in many human malignancies and is an established tumor suppressor (8–11). Mouse Fbw7 exists in three different isoforms as follows: α, β, and γ. The α isoform is expressed ubiquitously, whereas the β and γ isoforms are expressed restrictedly in the brain, heart, testis, and skeletal muscle (12). Intriguing characteristics of Fbw7α (encoded by the isoform1 of Fbxw7) have recently been described by Ericsson et al. (13) who demonstrated that this cell growth regulator also regulated the degradation of the nuclear forms of the sterol regulatory element-binding protein (SREBP)2 family (14).
SREBPs, belonging to the bHLH-Zip transcription factor family, are established regulators of lipid synthesis. The unique features of SREBPs are their rough-surfaced endoplasmic reticulum membrane-bound transcription factors. These factors need to undergo proteolytic cleavage for nuclear transport to activate the expression of genes involved in lipid synthesis. This represents the crucial step for sterol and fatty acid synthetic gene regulation (15–17). The SREBP family includes three isoforms as follows: SREBP-1a, -1c, and -2 (18–20). SREBP-2 governs cellular sterol regulation, whereas hepatic SREBP-1c (encoded by the isoformb of Srebf1) controls fatty acid and triglyceride synthesis depending on the nutritional state of the liver. SREBP-1a is highly expressed in growing cells and contributes to the synthesis of cholesterol, triglyceride (TG), and phospholipid for the supply of membrane lipids during cell growth (21, 22). Nuclear SREBP-1a regulates the cell cycle and growth by itself, indicating its strong association with cell growth (23, 24).
Without a proteasome inhibitor such as calpain inhibitor I in cell cultures, nuclear SREBPs are rapidly degraded by the ubiquitin-proteasome pathway after cleavage. Recently, Fbw7 was reported to be the key factor for this degradation of SREBPs in cultured cells (14). SREBP-1a is phosphorylated at several sites depending on the cell cycle and then degraded by the ubiquitin-proteasome system. During mitosis, nuclear SREBP-1a is stabilized, and it activates lipid synthesis to supply membrane lipids (25). Thus, Fbw7 controls the degradation of SREBPs in cultured cells in relation to the cell cycle and growth. However, its physiological roles in vivo have yet to be determined. In this study, the effects of Fbw7α modification on SREBPs and lipid metabolism in the liver were investigated.
EXPERIMENTAL PROCEDURES
Materials
Antibodies to phosphorylated, c-Jun (Ser-63) and lamin A/C, were obtained from Cell Signaling Technology (Beverly, MA); antibodies to SREBP-1, c-Jun, Krüppel-like factor 5 (KLF5, encoded by Klf5), and α-tubulin were obtained from Santa Cruz Biotechnology (Santa Cruz, CA), and antibody to Fbw7/hCdc4 was purchased from Abcam (Tokyo, Japan). N-Acetyl-Leu-Leu-norleucinal-CHO (ALLN; calpain inhibitor I) and fenofibrate were purchased from Sigma; Redivue [α-32P]dCTP was from GE Healthcare, and [1-14C]palmitate was from PerkinElmer Life Sciences. Restriction enzymes were obtained from Takara Bio Inc. (Shiga, Japan), and plasmid DNAs for transfection were prepared using the Qiagen plasmid midi kit (Qiagen, Hilden, Germany).
Animal Experiments
All animal studies were approved by the Animal Care Committee of the University of Tsukuba. Male C57BL/6J mice (9 and 14 weeks old) were purchased from Clea (Tokyo, Japan), and male B6.V-Lep ob/J (ob/ob) mice (7 weeks old) were obtained from Charles River (Kanagawa, Japan). SREBP transgenic mice (13 weeks old) overexpressing the active form of human SREBP-1c under the control of the rat phosphoenolpyruvate carboxykinase promoter (SREBP1c-Tg) were generated as described previously (26). In addition, SREBP-1 knock-out mice (SREBP1-KO) (6–8 weeks old) were generated as described previously (27). Klf5 flox mice, in which the second exon was flanked by two lox sites, were also prepared and established.3 The mice were housed in colony cages, maintained on a 12-h light/12-h dark cycle, and given free access to water and standard chow diet (Oriental Yeast, Tokyo, Japan); the mice were adapted to their new environment for at least 1 week prior to the experiments. After the adenovirus injection, the mice were housed during the periods indicated and then sacrificed in the nonfasted state. Tissues were isolated immediately, weighed, and stored in liquid nitrogen. Plasma metabolic parameters were measured by using commercial kits according to the manufacturer's instructions (all test kits were obtained from Wako Pure Chemical Industries, Osaka, Japan).
Preparation of Recombinant Adenovirus
We subcloned Fbw7-specific RNAi constructs using the Fbw7-coding sequence 5′-GCTGAAACTGGAGAGTGTA-3′ into a U6 entry vector (Invitrogen). We then generated the recombinant adenoviral plasmid by homologous recombination with a pAd promoterless vector (Invitrogen). Next, we subcloned peroxisome proliferator-activated receptor (PPAR) γ2-specific RNAi constructs using the PPARγ2-coding sequence, 5′-GCCTATGAGCACTTCACAA-3′, and generated the recombinant adenoviral plasmid as described above. We subcloned hemagglutinin-tagged mouse Fbw7α cDNA into the pENTR4 vector (Invitrogen) and generated a recombinant adenoviral plasmid by homologous recombination with a pAd/CMV/V5-DEST vector (Invitrogen). We produced recombinant adenoviruses in HEK-293 cells and purified them by CsCl gradient centrifugation, as described previously (28, 29). The recombinant adenovirus expressing the Cre recombinase AxCANCre was produced by Dr. Izumu Saito (Institute of Medical Science, University of Tokyo, Japan) and was obtained from Riken DNA Bank (Tsukuba, Japan).
RNA Extraction, Northern Blot Analysis, and Quantitative Real Time PCR
Total RNA was isolated from mouse livers and primary hepatocytes using the Sepasol-RNA I super reagent (Nacalai Tesque Inc., Kyoto, Japan). Northern blot analysis was performed using the indicated 32P-labeled probe, as described previously (28, 30). First strand cDNA was synthesized using a high capacity cDNA reverse transcription kit (Applied Biosystems, Foster City, CA), and comparative analysis of mRNA levels was performed using fluorescence-based real time PCR. Real time PCR analyses were performed using the ABI 7300 PCR system (Applied Biosystems). Quantification of fat-specific protein 27 (Cidec) was performed using a TaqMan gene expression assay (Applied Biosystems), whereas quantification of other genes was performed using the SYBR Green dye (Nippon Gene, Tokyo, Japan). The relative abundance of each transcript was calculated using a standard curve of cycle thresholds for serial dilutions of a cDNA sample and then normalized to cyclophilin levels (31). The expression levels of cyclophilin used as an internal control in each experiment were not affected by procedures such as siRNA transfection. Primer sequences are described in supplemental Table S1.
Measurement of Metabolic Parameters
We measured the plasma levels of glucose, insulin, nonesterified fatty acid, TG, total cholesterol (TC), aspartate aminotransferase, and alanine aminotransferase as well as the levels of TG and TC in the liver, as described previously (32).
Expression Plasmids
The expression plasmid for the human nuclear form of SREBP-1c has been described previously (33). Expression plasmids encoding mouse Fbw7α and Klf5 were generated by PCR amplification, followed by the insertion of cDNAs into pcDNA3.1(+) (Promega). The following primers were used: Fbw7α, 5′-primer 5′-CTTAAGCTTGCCACCATGAATCAGGAACTGCTCTCTGT-3′ and 3′-primer 5′-CCGGAATTCTCATTTCATGTCCACATCAAAGTCCAG-3′, and Klf5, 5′-primer 5′-CTTAAGCTTGCCACCATGCCCACGCGGGTGC-3′ and 3′-primer 5′-CCGGAATTCTCAGTTCTGGTGGCGCT-3′. Restriction sites HindIII and EcoRI were added to each 5′-primer and 3′-primer, respectively. PCR products were digested with HindIII and EcoRI and then inserted into the respective sites of pcDNA3.1(+). Ligation was performed using a Quick Ligation kit (New England Biolabs Inc., Ipswich, MA).
Cell Cultures
COS-7 cells were cultured in DMEM (Sigma) supplemented with 5% FBS and 1% penicillin/streptomycin (Sigma). For the KLF5 degradation assay, COS-7 cells were seeded 24 h before transfection in 6-cm plates at a density of 3 × 10⁵ cells/plate. Mouse primary hepatocytes were isolated from male C57BL/6J mice, as described previously (28), and seeded into 10-cm plates for adenovirus infection and measurement of palmitate uptake.
Cellular Uptake of [1-14C]Palmitate
[1-14C]Palmitate uptake by primary hepatocytes was measured as described previously but with some modifications (34). Briefly, the isolated hepatocytes were infected with adenovirus for 60 h and incubated for 3 h in a culture medium containing 200 μm palmitate, radiolabeled [1-14C]palmitate (0.1 μCi/ml), 2 μm insulin, and 1% BSA (Sigma). After the 3-h incubation, the cells were washed twice with ice-cold PBS and then scraped into it. Cellular lipids were extracted with chloroform/methanol as described by Bligh and Dyer (35), and the residual radioactivity of each sample was then determined.
KLF5 Degradation Assay
Each indicated expression plasmid (3 μg) was transfected into COS-7 cells using the FuGENE 6 reagent (Roche Applied Science), according to the manufacturer's instructions. After 36 h of transfection, the cells were treated with cycloheximide (100 μg/ml) to stop protein synthesis and then incubated with or without ALLN for the indicated times.
Immunoblot Analysis
We performed an immunoblot analysis using the antibodies indicated as described previously (29, 36, 37). The intensity of each detected band was quantified using the image processing software ImageJ (National Institute of Mental Health, Bethesda, MD).
Liver Histology
Mouse livers were fixed in 10% neutral buffered formalin and embedded in paraffin. The sections were subjected to standard hematoxylin and eosin staining.
Statistical Analyses
All data are expressed as means ± S.E. Statistical analyses were performed using unpaired Student's t test, one sample t test, or two-way analysis of variance, followed by Tukey's procedure.
RESULTS
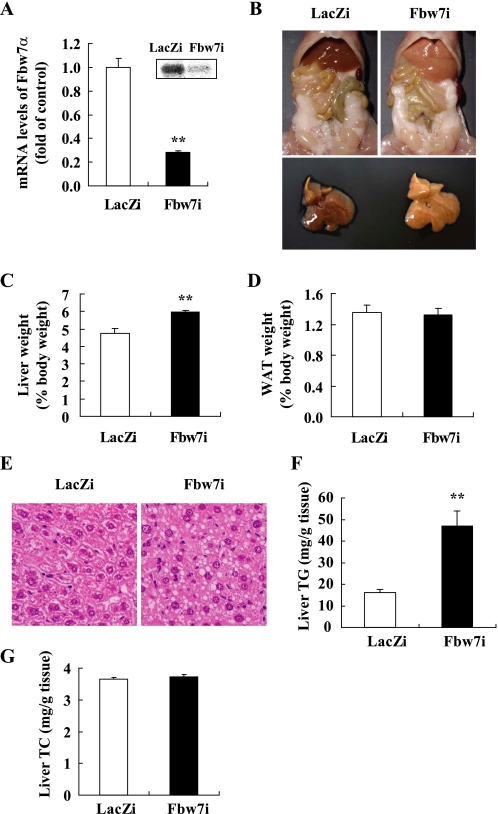
To estimate the contribution of Fbw7 to the physiological regulation of hepatic SREBP-1c and hepatic lipogenesis, Fbw7 was knocked down in murine livers by intravenous injection of adenovirus producing Fbw7 siRNA (Fbw7i). We confirmed that only the Fbw7α isoform was expressed in murine livers and cultured hepatoma cells, and Fbw7i fully suppressed Fbw7α expression in cultured hepatoma cells, as estimated by quantitative real time PCR (data not shown). In livers of mice infected with Fbw7i, the decrease in Fbw7α level was ∼70% (Fig. 1A). This hepatic Fbw7 knockdown caused fatty liver and a slight, but significant, enlargement of the liver (Fig. 1, B and C). These mice exhibited no significant changes in food intake, white adipose tissue weight, or body weight compared with animals infected with adenovirus producing LacZ siRNA (LacZi) as a control (Fig. 1D and data not shown). Of the plasma metabolic parameters, TG, glucose, and insulin levels were reduced significantly by infection with Fbw7i (Table 1). These data indicated that fatty liver was not likely to be associated with overnutrition or obesity. Hepatosteatosis was confirmed by liver histology (Fig. 1E) with a marked increase in the liver content of TG (Fig. 1F) but not TC (Fig. 1G).
FIGURE 1.
In vivo effects of Fbw7 knockdown in livers of C57BL/6J mice. Eight- to 9-week-old male C57BL/6J mice were infected through the tail vein with adenovirus encoding RNAi targeting Fbw7 (Fbw7i) or LacZ (LacZi) sequences (adenoviral dose of 2.5 × 10¹¹ viral particles per mouse). After 4 days of standard chow feeding, the mice were sacrificed in the nonfasted state. A, Fbw7 mRNA levels in the livers of mice infected with LacZi or Fbw7i, as determined by real time PCR (graph) or Northern blot analysis (inset). The quantities of mRNA were calculated as the ratio of the cyclophilin level in each cDNA sample. Data are shown as the expression ratio relative to the LacZi control group. B, abdominal (top) and hepatic (bottom) views of mice infected with LacZi or Fbw7i. Liver weights (C), epididymal white adipose tissue (WAT) weights (D), liver histology (hematoxylin and eosin staining, × 200) (E), liver TG contents (F), and liver TC contents (G) of mice infected with LacZi or Fbw7i. n = 9 per group in A, C, D, and F, and n = 4 per group in G. Statistical analysis was performed using unpaired Student's t test; **, p < 0.01 (versus LacZi control group).
TABLE 1.
Plasma metabolic parameters in the Fbw7 knockdown mice
Data are the means ± S.E. of four male C57BL/6J mice in the nonfasted state at day 4 after adenovirus infection.
| Parameter | LacZi | Fbw7i |
|---|---|---|
| Body weight | 25.3 ± 0.47 g | 24.6 ± 0.15 g |
| Glucose | 252 ± 8.3 mg/dl | 191 ± 14 mg/dla |
| Insulin | 0.30 ± 0.083 pg/ml | 0.057 ± 0.036 pg/mla |
| TG | 151 ± 6.4 mg/dl | 92 ± 1.2 mg/dlb |
| TC | 67.4 ± 6.9 mg/dl | 88.2 ± 6.7 mg/dl |
| Nonesterified fatty acid | 1.21 ± 0.04 mEq/liter | 1.14 ± 0.08 mEq/liter |
| Alanine aminotransferase | 30 ± 1.6 Karmen units | 42 ± 1.0 Karmen unitsb |
| Aspartate aminotransferase | 63 ± 4.8 Karmen units | 114 ± 5.4 Karmen unitsb |
a p < 0.05 (versus each respective LacZi control).
b p < 0.01 (versus each respective LacZi control).
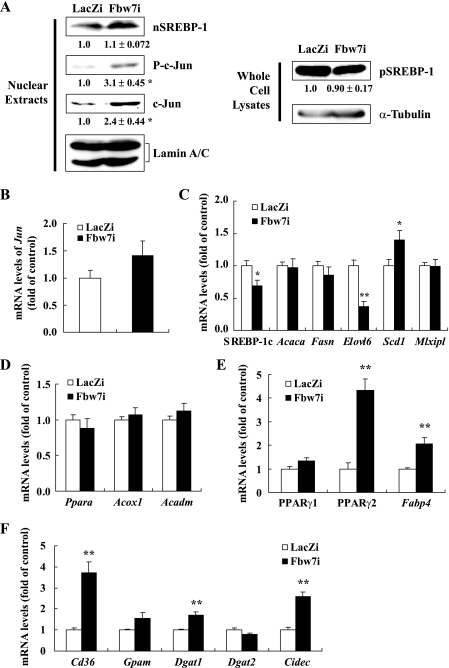
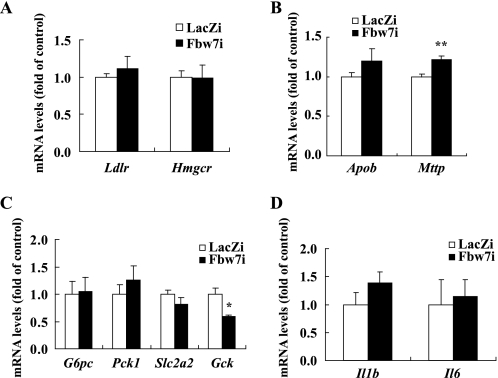
Immunoblot analysis of hepatic nuclear extracts demonstrated that the increase in nuclear SREBP-1 protein by Fbw7 knockdown was minimal, whereas c-Jun protein, another target of Fbw7, accumulated markedly without a change in its mRNA level (Fig. 2, A and B). This finding confirmed Fbw7 inactivation. The precursor form of SREBP-1c in the whole cell fraction did not change noticeably. Lack of hepatic SREBP-1 activation by Fbw7α suppression was confirmed by the gene expression pattern estimated by real time PCR (Fig. 2C). With the exception of stearoyl-CoA desaturase 1 (Scd1), mRNA levels of SREBP-1c and SREBP-1 target genes involved in fatty acid synthesis, such as acetyl-CoA carboxylase (Acaca), fatty-acid synthase (Fasn), and long chain fatty acid elongase 6 (Elovl6), were not up-regulated. There were no changes in the expression of carbohydrate response element-binding protein (Mlxipl), another transcription factor that controls fatty acid synthesis (Fig. 2C). The mRNA levels of Ppara (which encodes PPARα, a crucial regulator of hepatic fatty acid oxidation enzymes) and the PPARα target genes acyl-CoA oxidase (Acox1) and medium chain acyl-CoA dehydrogenase (Acadm) did not change (Fig. 2D). In contrast, hepatic expression of PPARγ2 (isoform2 of Pparg) increased significantly by Fbw7 knockdown, although expression of PPARγ1 (isoform1 of Pparg) increased minimally. Consistent with these findings, the expression of aP2 (Fabp4), another PPARγ2 target gene, was also up-regulated (Fig. 2E). We observed marked increases in the mRNA levels of Cd36, a transporter involved in the hepatic uptake of plasma fatty acids, mitochondrial glycerol-3-phosphate acyltransferase (Gpam), and diacylglycerol acyltransferase 1 (Dgat1), an enzyme in TG synthesis (Fig. 2F). Fsp27/CIDE-C (encoded by Cidec), a lipid droplet binding protein known to promote lipid accumulation in adipocytes, has recently been reported to contribute to hepatosteatosis as a PPARγ target (38–40). Furthermore, the expression of Cidec was enhanced by Fbw7 knockdown (Fig. 2F). These data indicated that fatty liver induced by Fbw7 knockdown was caused by an elevation in fatty acid uptake, TG synthesis, and lipid accumulation, rather than by an increase in de novo fatty acid synthesis or a decrease in fatty acid degradation. These genes involved in the accumulation of TG are direct targets of PPARγ2. Consistent with the liver cholesterol content remaining unchanged, SREBP-2 target genes involved in cholesterol metabolism such as low density lipoprotein receptor (Ldlr) and HMG-CoA reductase (Hmgcr) did not change with Fbw7 knockdown (Fig. 3A). Apolipoprotein B (Apob) and microsomal triglyceride transfer protein (Mttp) involved in TG secretion did not decrease (Fig. 3B). Expression of gluconeogenic genes such as phosphoenolpyruvate carboxykinase (Pck1), glucose-6-phosphatase (G6pc), and glucose transporter 2 (Slc2a2) did not change, although glucokinase (Gck) expression decreased significantly by Fbw7 knockdown (Fig. 3C). Phosphorylated protein levels of c-Jun increased by Fbw7 knockdown (Fig. 2A). Expression of cytokines such as Il1b and Il6 did not change (Fig. 3D).
FIGURE 2.
Effects of Fbw7 knockdown on the protein and mRNA expression in the livers of C57BL/6J mice. All mice were infected with Fbw7i or LacZi adenovirus. After 4 days of standard chow feeding, the mice were sacrificed in the nonfasted state. A, immunoblot analysis of the cleaved nuclear forms of SREBP-1 (nSREBP-1), c-Jun, phosphorylated c-Jun (P-c-Jun), and lamin A/C as an internal control in nuclear extracts and precursor forms of SREBP-1 (pSREBP-1) and α-tubulin as an internal control in whole cell lysates from mouse livers. Each protein sample was obtained from three to five mice infected with LacZi or Fbw7i. Protein levels of the Fbw7i group displayed below each blot are shown as the mean ± S.E. of the relative quantity ratios to the LacZi control group in three to five independent experiments. The protein quantities were determined as described under “Experimental Procedures” and normalized by the respective internal control. B, mRNA levels of Jun. C, mRNA levels of SREBP-1c, acetyl-CoA carboxylase (Acaca), fatty-acid synthase (Fasn), long chain fatty acid elongase 6 (Elovl6), stearoyl-CoA desaturase 1 (Scd1), and carbohydrate-responsive element-binding protein (Mlxipl). D, mRNA levels of PPARα (Ppara) and its regulated genes acyl-CoA oxidase (Acox1) and medium chain acyl-CoA dehydrogenase (Acadm). mRNA levels of PPARγ1, PPARγ2, aP2 (Fabp4) (E), and Cd36, mitochondrial glycerol-3-phosphate acyltransferase (Gpam), diacylglycerol acyltransferase 1/2 (Dgat1/2), and fat-specific protein 27 (Cidec) (F). All RNA samples were extracted from the livers of mice infected with LacZi or Fbw7i. The quantities of mRNA were determined by real time PCR and normalized by the cyclophilin level in each cDNA sample. mRNA levels are shown as the expression ratio relative to the LacZi control group. n = 3–5 per group in A; n = 4–9 per group in C and F; n = 4 per group in B and D; and n = 7–9 per group in E. Statistical analysis was performed using one sample t test in A and unpaired Student's t test in all other panels; **, p < 0.01, and *, p < 0.05 (versus LacZi control group).
FIGURE 3.
Effects of Fbw7 knockdown on gene expression in the livers of C57BL/6J mice. All mice were infected with Fbw7i or LacZi adenovirus. After 4 days of standard chow feeding, the mice were sacrificed in the nonfasted state. mRNA levels of LDL receptor (Ldlr) and HMG-CoA reductase (Hmgcr) (A), apolipoprotein B (Apob) and microsomal triglyceride transfer protein (Mttp) (B), glucose-6-phosphatase (G6pc), phosphoenolpyruvate carboxykinase (Pck1), glucose transporter 2 (Slc2a2), and glucokinase (Gck) (C), and Il1b and Il6 (D) in the livers of mice infected with LacZi or Fbw7i were determined by real time PCR. The quantities of mRNA were calculated as the ratio of the cyclophilin level in each cDNA sample. mRNA levels are shown as the expression ratio relative to the LacZi control group. n = 4 per group in A and C, and n = 8 or 9 per group in B and D. Statistical analysis was performed using unpaired Student's t test; **, p < 0.01, and *, p < 0.05 (versus LacZi control group).
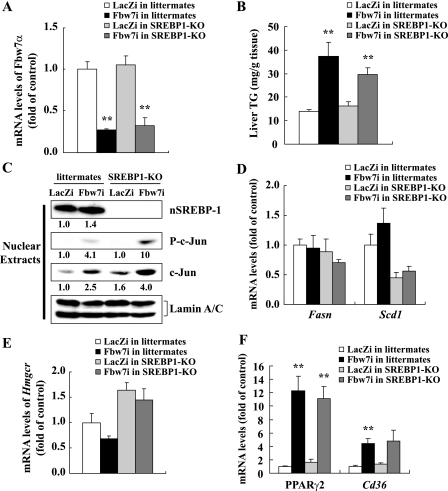
The possibility that SREBP-1 did not contribute to fatty liver induced by Fbw7 knockdown was investigated further in SREBP1-KO. Littermates and SREBP1-KO had similar basal mRNA levels of Fbw7α (Fig. 4A). After Fbw7 knockdown, the TG content of SREBP1-KO livers increased to levels comparable with littermates (Fig. 4B). Inhibition of Fbw7 function by knockdown was confirmed by the increased levels of c-Jun and phosphorylated c-Jun proteins in nuclear extracts (Fig. 4C). Lipogenic enzyme genes such as Fasn and Scd1 were not affected by Fbw7 knockdown in SREBP1-KO livers (Fig. 4D). Fbw7 knockdown did not alter Hmgcr expression or liver cholesterol content (Fig. 4E and data not shown). Meanwhile, PPARγ2 and Cd36 were up-regulated by Fbw7 knockdown irrespective of the presence or absence of SREBP-1 (Fig. 4F), indicating SREBP-1c-independent and PPARγ2-mediated TG accumulation.
FIGURE 4.
Effects of Fbw7 knockdown on gene expression and TG contents in the livers of SREBP1-KO. Six- to 8-week-old male SREBP1-KO and littermates were infected through the tail vein with Fbw7i or LacZi adenovirus (adenoviral dose of 2.5 × 10¹¹ viral particles per mouse). After 4 days of standard chow feeding, the mice were sacrificed in the nonfasted state. A, Fbw7α mRNA levels in the livers of SREBP1-KO and littermates infected with LacZi or Fbw7i determined by real time PCR. B, liver TG contents of SREBP1-KO and littermates infected with LacZi or Fbw7i. C, immunoblot analysis of cleaved nSREBP-1, c-Jun, P-c-Jun, and lamin A/C as an internal control in nuclear extracts from the livers of four or five mice in each group indicated. Quantification results were obtained as described under “Experimental Procedures” and normalized by the internal control. Relative changes compared with controls (littermates infected with LacZi) are displayed below each blot. The mRNA levels of Fasn and Scd1 (D), Hmgcr (E), and PPARγ2 and Cd36 (F) in the livers of SREBP1-KO and littermates infected with LacZi or Fbw7i are shown. The quantities of mRNA were determined by real time PCR and normalized by the cyclophilin level in each cDNA sample. mRNA levels are shown as the expression ratio relative to the LacZi control group. n = 4 or 5 per group in all panels. Statistical analysis was performed using unpaired Student's t test; **, p < 0.01 (versus respective LacZi control group).
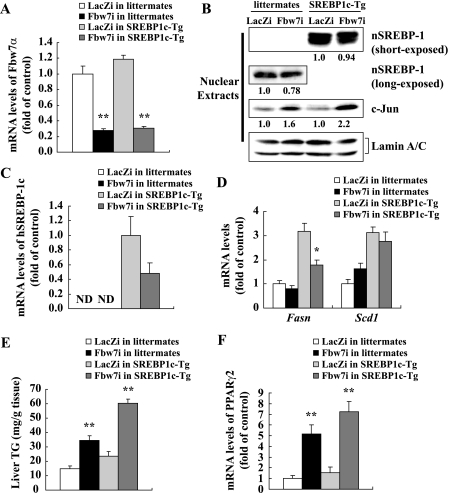
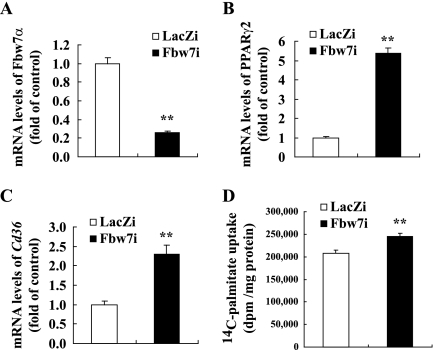
Besides its stability in the nucleus, nuclear SREBP-1c protein level is regulated mainly by its mRNA level and cleavage activity of the precursor SREBP-1c protein for nuclear transport. To exclude the possibility that the lack of change in the nuclear SREBP-1 protein by Fbw7 knockdown was attributable to changes in mRNA expression and cleavage activity of the precursor protein, we tested the effect of Fbw7 inhibition on the overexpressed nuclear form of the SREBP-1c protein in transgenic livers (Fig. 5). Production of nuclear SREBP-1c was stabilized by the transgene under the control of the phosphoenolpyruvate carboxykinase promoter. However, the amount of transgene SREBP-1c protein in liver nuclei was not elevated by Fbw7 knockdown, whereas c-Jun was accumulated (Fig. 5, A–C). Expression of SREBP-1c target genes such as Fasn and Scd1 was not elevated consistently (Fig. 5D). Nevertheless, after Fbw7i treatment, increased TG content was elevated further, and PPARγ2 expression was markedly up-regulated in SREBP-1c transgenic livers to the same extent as in wild-type livers (Fig. 5, E and F). These data suggested that Fbw7 knockdown did not affect the stability of the hepatic nuclear SREBP-1c protein in vivo. To directly evaluate the effects of Fbw7 knockdown on the uptake of fatty acids, mouse primary hepatocytes were prepared and infected with Fbw7i (Fig. 6). Direct Fbw7 knockdown in primary hepatocytes increased the expression of PPARγ2 and Cd36 (Fig. 6, A–C), leading to an increase in the estimated uptake of fatty acids (Fig. 6D).
FIGURE 5.
Effects of Fbw7 knockdown on gene expression and TG contents in the livers of SREBP-1c transgenic mice (SREBP1c-Tg). Thirteen-week-old male SREBP1c-Tg and littermates were infected through the tail vein with Fbw7i or LacZi adenovirus (adenoviral dose of 2.5 × 10¹¹ viral particles per mouse). After 4 days of standard chow feeding, the mice were sacrificed in the nonfasted state. A, Fbw7a mRNA levels in the livers of SREBP1c-Tg and littermates infected with LacZi or Fbw7i. B, immunoblot analysis of the cleaved nuclear forms of SREBP-1 (nSREBP1), c-Jun, and lamin A/C as an internal control in nuclear extracts from the livers of five mice in each group indicated. Quantification results were obtained as described under “Experimental Procedures” and normalized by the internal control. Relative changes compared with controls (littermates or SREBP1c-Tg infected with LacZi) are displayed below each blot. mRNA expression of exogenous human SREBP-1c (hSREBP-1c) (C) and Fasn and Scd1 (D) in the livers of SREBP1c-Tg and littermates infected with LacZi or Fbw7i are shown. ND, not detected. E, liver TG contents of SREBP1c-Tg and littermates infected with LacZi or Fbw7i. F, mRNA levels of PPARγ2 in the livers of SREBP1c-Tg and littermates infected with LacZi or Fbw7i. mRNA quantities were determined by real time PCR and calculated as the ratio of the cyclophilin level in each cDNA sample. Data are shown as the expression ratio relative to the LacZi control group. n = 5 per group in all panels. Statistical analysis was performed using unpaired Student's t test; **, p < 0.01, and *, p < 0.05 (versus respective LacZi control group).
FIGURE 6.
Influence of Fbw7 knockdown on fatty acid uptake in mouse primary hepatocytes. Primary hepatocytes were isolated from C57BL/6J mice and infected with Fbw7i or LacZi adenovirus (1000 virus particles/cell) and cultured for 48 h. [1-14C]Palmitate uptake of the treated primary hepatocytes was measured, as indicated under “Experimental Procedures.” mRNA levels of Fbw7α (A), PPARγ2 (B), and Cd36 (C) in mouse primary hepatocytes infected with LacZi or Fbw7i are shown. The quantities of mRNA were determined by real time PCR and normalized by the cyclophilin level in each cDNA sample. mRNA levels are shown as the expression ratio relative to the LacZi control group. D, [1-14C]palmitate incorporation into cellular lipid in mouse primary hepatocytes infected with LacZi or Fbw7i. All experiments were performed using five sets of primary hepatocytes for each group. Statistical analysis was performed using unpaired Student's t test; **, p < 0.01 (versus LacZi control group).
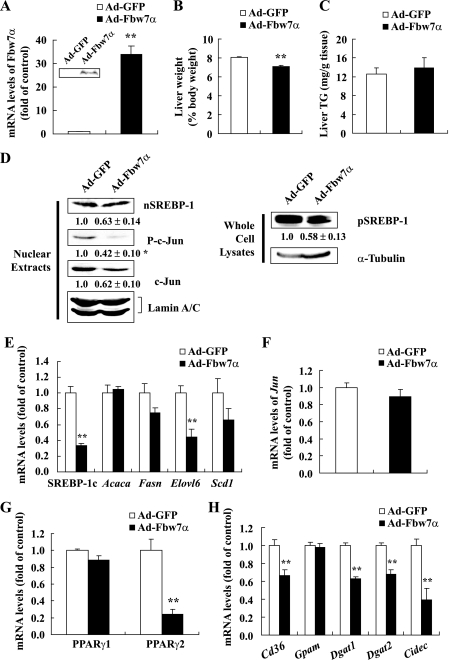
Conversely, the effects of Fbw7α overexpression were tested (Fig. 7). After the adenoviral overexpression of Fbw7α, liver weight was slightly but significantly reduced, although the change in liver TG content was not significant (Fig. 7, A–C). Adenoviral overexpression of Fbw7α decreased c-Jun and its phosphorylated protein, but not its mRNA, confirming the enhancement of Fbw7 activity. Meanwhile, Fbw7α overexpression caused parallel decreases in SREBP-1c mRNA as well as precursor and nuclear proteins (Fig. 7, D–F). This finding does not support the enhancement of SREBP-1c protein degradation by Fbw7α in vivo. In contrast, Fbw7α overexpression suppressed the expression of PPARγ2 and its target genes Cd36, Dgat1/2, and Cidec but not mitochondrial glycerol-3-phosphate acyltransferase (Gpam) as an SREBP-1 target (Fig. 7, G and H). mRNA levels of Hmgcr and Ldlr genes were not affected (data not shown). Overall, the effects of Fbw7 overexpression were consistently opposed to its inhibition, including the absence of an impact on SREBP-1c.
FIGURE 7.
In vivo effects of Fbw7α overexpression in the livers of C57BL/6J mice. Fourteen-week-old male C57BL/6J mice were infected through the tail vein with adenovirus encoding GFP (Ad-GFP) as the control or mouse Fbw7α (Ad-Fbw7α) (adenoviral dose of 1.5 × 10¹¹ viral particles per mouse). After 6 days of standard chow feeding, the mice were sacrificed in the nonfasted state. A, mouse Fbw7α mRNA levels in livers of mice infected with Ad-GFP or Ad-Fbw7α determined by real time PCR (graph) and Fbw7α protein levels, examined by immunoblot analysis (inset). Liver weights (B) and liver TG contents (C) of the mice infected with Ad-GFP or Ad-Fbw7α are shown. D, immunoblot analysis of cleaved nuclear forms of SREBP-1 (nSREBP-1), c-Jun, P-c-Jun, and lamin A/C as an internal control in nuclear extracts and precursor forms of SREBP-1 (pSREBP-1) and α-tubulin as an internal control in whole cell lysates from mouse livers. Each protein sample was obtained from three to five mice infected with Ad-GFP or Ad-Fbw7α. Protein levels of the Ad-Fbw7α group displayed below each blot are shown as the mean ± S.E. of the relative quantity ratios to the Ad-GFP control group in three independent experiments. The protein quantities were determined as described under “Experimental Procedures” and normalized by the respective internal control. The mRNA levels of SREBP-1c, Acaca, Fasn, Elovl6, and Scd1 (E), Jun (F), PPARγ1 and PPARγ2 (G), and Cd36, Gpam, Dgat1/2, and Cidec (H) in the livers of mice infected with Ad-GFP or Ad-Fbw7α are shown. The quantities of mRNA were determined by real time PCR and normalized by the cyclophilin level in each cDNA sample. The mRNA levels are shown as the expression ratio relative to the Ad-GFP control group. n = 3 per group in D and n = 5 per group in all other panels. Statistical analysis was performed using one sample t test in A and unpaired Student's t test in all other panels; **, p < 0.01 and *, p < 0.05 (versus Ad-GFP control group).
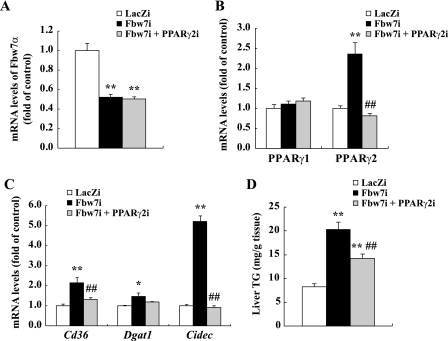
To confirm that PPARγ2 was responsible for the Fbw7α-mediated regulation of hepatic TG metabolism, PPARγ2 knockdown was superimposed onto Fbw7α knockdown in fatty liver (Fig. 8). In double-knockdown animals, the induction of PPARγ2 expression by Fbw7α knockdown (roughly 50% inhibition) was completely suppressed to the base-line level of the LacZi control (Fig. 8, A and B). As a result, the elevation of PPARγ2 target genes such as Cd36, Dgat1, and Cidec by Fbw7α knockdown was also inhibited completely by PPARγ2 knockdown, and the elevation of hepatic TG content by Fbw7 knockdown decreased considerably (Fig. 8, C and D). These data indicated that PPARγ2-mediated hepatic TG accumulation in the absence of Fbw7α.
FIGURE 8.
Effects of Fbw7 and PPARγ2 double knockdown on gene expression and TG contents in the livers of C57BL/6J mice. Nine-week-old male C57BL/6J mice were infected through the tail vein with adenovirus encoding RNAi targeting PPARγ2 (PPARγ2i), Fbw7 (Fbw7i), and/or LacZ (LacZi) sequence (adenoviral dose of 2.5 × 10¹¹ viral particles per mouse). After 4 days of standard chow feeding, the mice were sacrificed in the nonfasted state. The mRNA levels of Fbw7α (A), PPARγ1 and PPARγ2 (B), and Cd36, Dgat1, and Cidec (C) in livers of mice treated with LacZi alone (LacZi), Fbw7i, and LacZi (Fbw7i) or Fbw7i and PPARγ2i (Fbw7i + PPARγ2i) are shown. D, liver TG contents of these three groups are as described above. The quantities of mRNA were determined by real time PCR and normalized by the cyclophilin level in each cDNA sample. mRNA levels are shown as the expression ratio relative to the LacZi control group. n = 4 or 5 per group in all panels. Statistical analysis was performed using two-way analysis of variance followed by Tukey's procedure; **, p < 0.01, and *, p < 0.05 (versus LacZi), and ##, p < 0.01 (versus Fbw7i).
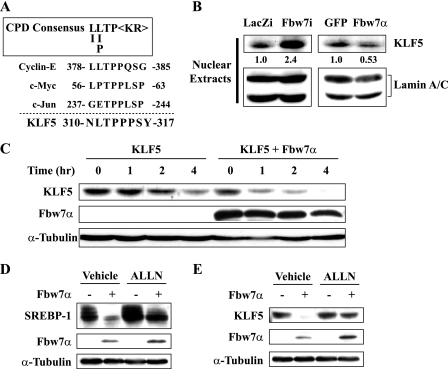
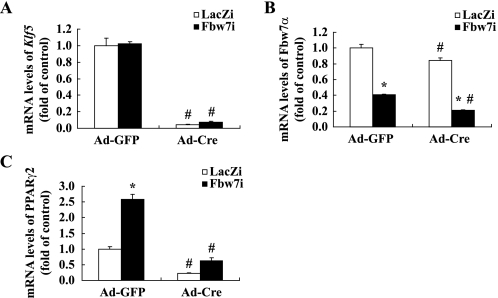
PPARγ2 is not regarded as a direct target protein of Fbw7-mediated degradation because its expression is repressed by Fbw7α at the transcriptional level. Moreover, the protein lacks the Cdc4 phosphodegron consensus (2) in its amino acid sequence as an Fbw7 target. CCAAT/enhancer-binding protein (C/EBP) β and KLF5 are known as the transcription factors involved in PPARγ2 expression (41, 42). KLF5 has been reported as a new target of Fbw7 (43, 44) and KLF5, but not C/EBPβ, which has the Cdc4 phosphodegron consensus in its amino acid sequence (Fig. 9A). Adenoviral knockdown or overexpression of Fbw7α consistently up-regulated or suppressed KLF5, respectively (Fig. 9B), but not C/EBPβ, as estimated by immunoblot analysis of mouse hepatic proteins (data not shown). Fbw7α-mediated degradation of KLF5 was investigated using the cycloheximide chase assay in COS-7 cells. Fbw7α enhanced the degradation of the KLF5 protein (Fig. 9C). This degradation of the KLF5 protein by Fbw7α was inhibited by the proteasome inhibitor ALLN in a way similar to the degradation of the SREBP-1 protein by Fbw7α (Fig. 9, D and E). These data confirmed KLF5 as an Fbw7 target. Finally, the contribution of KLF5 to the Fbw7-PPARγ2 pathway was estimated using primary hepatocytes from Klf5 flox mice (Fig. 10). Treatment of Klf5 flox hepatocytes with recombinant adenovirus expressing Cre recombinase (Ad-Cre) led to the essential deletion of Klf5 mRNA (Fig. 10A). Klf5-deleted hepatocytes decreased PPARγ2 expression, establishing KLF5 as an upstream transcription factor of PPARγ2. In control hepatocytes infected with Ad-GFP, PPARγ2 expression was increased by Fbw7i, as observed in vivo, and returned to the basal level with Klf5 deletion (Fig. 10, B and C). These findings demonstrated that KLF5 mediates the Fbw7-PPARγ2 pathway.
FIGURE 9.
Fbw7α-mediated degradation of Krüppel-like factor 5 (KLF5). A, amino acid sequence alignment of the Cdc4 phosphodegron (CPD) in cyclin E, c-Myc, c-Jun, and KLF5. B, immunoblot analysis of KLF5 and lamin A/C as an internal control in nuclear extracts from the livers of four or five mice infected with LacZi, Fbw7i, Ad-GFP (GFP), or Ad-Fbw7α (Fbw7α). Quantification results were obtained as described under “Experimental Procedures” and normalized by the internal control. The changes relative to the controls (LacZi or GFP) are displayed below each blot. C, COS-7 cells were transfected with Klf5 in the presence or absence of Fbw7α. Thirty-six hours after transfection, the cells were either lysed directly or incubated in the presence of cycloheximide (100 μg/ml) for the time period indicated to determine KLF5 turnover. The levels of KLF5 were determined by immunoblot analysis. D, COS-7 cells were transfected with the SREBP-1c expression plasmid in the presence or absence of Fbw7α. Thirty six hours after transfection, the cells were treated with vehicle alone (DMSO) or the proteosome inhibitor N-acetyl-Leu-Leu-norleucinal-CHO (ALLN) (50 μg/ml) for 4 h prior to cell lysis. The protein levels of SREBP-1c, Fbw7α, and α-tubulin were determined by immunoblot analysis. E, COS-7 cells were transfected with the Klf5 expression plasmid in the presence or absence of Fbw7α. Thirty six hours after transfection, the cells were treated with vehicle alone (DMSO) or N-acetyl-Leu-Leu-norleucinal-CHO (ALLN) (50 μg/ml) for 4 h prior to cell lysis. The protein levels of KLF5, Fbw7α, and α-tubulin were determined by immunoblot analysis.
FIGURE 10.
Contribution of KLF5 to Fbw7-mediated inhibition of PPARγ2. Primary hepatocytes prepared from Klf5 flox mice were seeded in 6-cm plates and infected with Fbw7i or LacZi (1000 virus particles/cell) and Ad-GFP as the control or Ad-Cre recombinase encoding adenovirus (Ad-Cre) (300 virus particles/cell). Infected hepatocytes were cultured for 48 h, and the mRNA levels in treated hepatocytes were determined by real time PCR. The mRNA levels of Klf5 (A), Fbw7α (B), and PPARγ2 (C) in mouse primary hepatocytes infected with LacZi or Fbw7i and Ad-GFP or Ad-Cre are shown. The quantities of mRNA were determined by real time PCR and normalized by the cyclophilin level in each cDNA sample. mRNA levels are shown as the expression ratio relative to both the LacZi- and Ad-GFP-infected control groups. All experiments were performed using four sets of primary hepatocytes for each group. Statistical analyses were performed using two-way analysis of variance followed by Tukey's procedure; *, p < 0.05 (versus LacZi of each group), and #, p < 0.05 (versus LacZi or Fbw7i of Ad-GFP group).
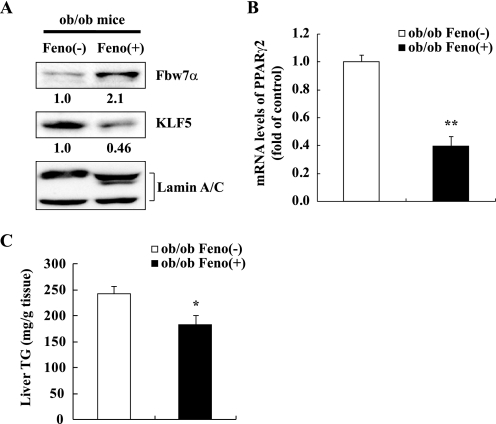
To reveal the pathophysiological situation where Fbw7α regulates PPARγ2, we tested the effect of PPARα activation on pathological fatty liver. Obese mice such as db/db or ob/ob mice with leptin deficiency exhibited severe hepatosteatosis with marked induction of PPARγ2 (42, 45). Fibrates that have a PPARα agonist action ameliorate fatty liver associated with a reduction in PPARγ2. The mechanism for this action has yet to be determined (46). In db/db mice, the level of nuclear Fbw7 protein was low, whereas KLF5 protein level was high compared with the control C57BL/6 mice. This suggests that Fbw7 contributes to PPARγ2 regulation (data not shown). Furthermore, ob/ob mice were treated with fenofibrate, and this system was examined (Fig. 11). Interestingly, the PPARα agonist caused strong induction of the nuclear Fbw7 protein, accompanied by a reduction in the KLF5 protein (Fig. 11A). This explains the suppression of PPARγ2 and TG content by PPARα activation (Fig. 11, B and C).
FIGURE 11.
Effects of fenofibrate administration on gene expression and TG contents in the livers of ob/ob mice. Eight-week-old male ob/ob mice were fed a control diet (ob/ob Feno(−)) or 0.1% fenofibrate diet (ob/ob Feno(+)) for 7 days. All mice were sacrificed in the nonfasted state. A, immunoblot analysis of Fbw7α, KLF5, and lamin A/C as an internal control in nuclear extracts from the livers of five mice in each group indicated. Quantification results were obtained as described under “Experimental Procedures” and normalized by the internal control. The changes relative to the controls (ob/ob Feno(−)) are displayed below each blot. B, PPARγ2 mRNA levels in livers of ob/ob mice treated with control or 0.1% fenofibrate diet. The quantities of mRNA were determined by real time PCR and normalized by the cyclophilin level in each cDNA sample. mRNA levels are shown as the expression ratio relative to the ob/ob Feno(−) control group. C, liver TG contents of ob/ob mice treated with control or 0.1% fenofibrate diet. n = 8 or 9 per group in B and n = 5 per group in C. Statistical analysis was performed using unpaired Student's t test; **, p < 0.01, and *, p < 0.05 (versus ob/ob Feno(−)).
DISCUSSION
Previous in vitro studies have suggested that Fbw7 is involved in the degradation of the nuclear SREBP protein (14). This study was conducted to estimate the role of Fbw7 on the SREBP-1c system for lipogenesis in vivo. Unexpectedly, neither knockdown nor overexpression of Fbw7α contributed to SREBP-1c protein levels in livers, although our experimental settings on Fbw7 perturbation were strong enough for c-Jun, another target of Fbw7α. No impact of Fbw7α was observed on the nuclear SREBP-1c protein in the liver for a wide range of amounts of nuclear SREBP-1c protein in both wild-type and SREBP-1c transgenic mouse livers. This finding discounts the possibility of Fbw7α contributing to in vivo regulation of liver SREBP-1c. The precise molecular mechanism for this discrepancy between in vitro and in vivo data is currently unknown. It has been proposed that the regulation of SREBP-1a stability by Fbw7α in cultured cells may be related to the cell cycle and growth (14). In our experimental setting of COS-7 cells, the impacts of Fbw7α and the proteasome inhibitor ALLN on SREBP-1 proteins were also observed (Fig. 9D). However, the cell growth-linked Fbw7α/SREBP system may not work in the liver, considering the long doubling time of hepatocytes.
The present findings demonstrated that Fbw7α regulated TG metabolism in the liver. The gene expression pattern in Fbw7α-knockdown livers indicated that Fbw7 regulated fatty acid uptake and TG synthesis but not fatty acid synthesis or degradation, thereby highlighting the linkage of PPARγ2 and its target genes Cd36, Dgat1, and Cidec. In addition, this study emphasized the physiological role of hepatic PPARγ2 in normal nutrition. In contrast to adipose tissue, PPARγ2 expression is low in the livers of mice on a normal diet. The suppression of PPARγ2 by Fbw7α may contribute to this regulation and prevent unnecessary accumulation of hepatosteatosis during a normal energy state.
PPARγ2 is induced and involved in liver TG content in pathological fatty liver such as in ob/ob and diet-induced obesity mice (47–50). However, hepatic Fbw7α expression increased slightly under these conditions of overnutrition (data not shown). Fbw7α overexpression had no effect on fatty liver in ob/ob mice. Fbw7α did not appear to have a crucial effect on the regulation of liver TG content in overnutrition, where PPARγ2 induction occurs mainly through the trans-activation of C/EBPα and -β (42). In contrast, PPARα ameliorated fatty liver in these mice with a reduction in PPARγ2. Our data indicated that Fbw7 may mediate this inhibitory action of PPARα on PPARγ2 and hepatosteatosis.
PPARγ2 is related to insulin resistance in ob/ob and diet-induced obesity mice (48, 49). Overexpression of PPARγ2 in livers ameliorated insulin resistance and decreased plasma levels of glucose and insulin in diet-induced obesity mice, whereas ablation of PPARγ2 in ob/ob mice resulted in severe insulin resistance and an increase in plasma glucose levels. In this study, significant decreases in plasma glucose and insulin were observed in Fbw7 knockdown mice, indicating that insulin sensitivity may be enhanced by up-regulation of hepatic PPARγ2 expression (Table 1).
Furthermore, our findings indicated that KLF5 was a direct target of Fbw7 in vivo and in vitro. Based on the data from Klf5-deleted hepatocytes, KLF5 could at least partially explain PPARγ2 up-regulation by suppression of hepatic Fbw7α. As shown in Fig. 10, the induction of PPARγ2 by Fbw7 knockdown was markedly impaired but slightly remained in Klf5-deleted hepatocytes. This indicates that there could be some KLF5-independent mechanism. Careful interpretation of this molecular process is required as KLF5 may have various biological effects on cell growth (51, 52) and secondary metabolic disturbances. Based on previous reports that Myc overexpression in transgenic mice contributed to glucose metabolism (53, 54), it is possible that c-Myc, potentially induced by Fbw7i, could be involved in steatosis in Fbw7-knockdown livers.
Fbw7 is thought to be a cell growth regulator. This study demonstrated an association of Fbw7 with hepatic fatty acid uptake and TG synthesis through PPARγ2 and not with lipogenesis through SREBP-1c. Further investigations are necessary to elucidate the precise roles of this versatile factor in light of the association between the nutritional regulation of lipid metabolism and regulation of cell growth.
Supplementary Material
Acknowledgments
We are grateful to Prof. Oike for the helpful discussions. We also thank Dr. Tomotaka Yokoo and Motoki Mikami for the beneficial discussion and support.
This work was supported by grants-in-aid from the Ministry of Education, Culture, Sports, Science and Technology of Japan.

The on-line version of this article (available at http://www.jbc.org) contains supplemental Table 1.
M. Ema, manuscript in preparation.
- SREBP
- sterol regulatory element-binding protein
- PPAR
- proliferator-activated receptor
- C/EBP
- CCAAT/enhancer-binding protein
- TC
- total cholesterol
- Fbw7
- F-box and WD repeat domain-containing 7
- KLF5
- Krüppel-like factor 5
- TG
- triglyceride
- ob/ob
- B6.V-Lepob/J.
REFERENCES
- 1. Cardozo T., Pagano M. (2004) Nat. Rev. Mol. Cell Biol. 5, 739–751 [DOI] [PubMed] [Google Scholar]
- 2. Nash P., Tang X., Orlicky S., Chen Q., Gertler F. B., Mendenhall M. D., Sicheri F., Pawson T., Tyers M. (2001) Nature 414, 514–521 [DOI] [PubMed] [Google Scholar]
- 3. Koepp D. M., Schaefer L. K., Ye X., Keyomarsi K., Chu C., Harper J. W., Elledge S. J. (2001) Science 294, 173–177 [DOI] [PubMed] [Google Scholar]
- 4. Nateri A. S., Riera-Sans L., Da Costa C., Behrens A. (2004) Science 303, 1374–1378 [DOI] [PubMed] [Google Scholar]
- 5. Oberg C., Li J., Pauley A., Wolf E., Gurney M., Lendahl U. (2001) J. Biol. Chem. 276, 35847–35853 [DOI] [PubMed] [Google Scholar]
- 6. Welcker M., Orian A., Jin J., Grim J. E., Grim J. A., Harper J. W., Eisenman R. N., Clurman B. E. (2004) Proc. Natl. Acad. Sci. U.S.A. 101, 9085–9090 [DOI] [PMC free article] [PubMed] [Google Scholar]
- 7. Yada M., Hatakeyama S., Kamura T., Nishiyama M., Tsunematsu R., Imaki H., Ishida N., Okumura F., Nakayama K., Nakayama K. I. (2004) EMBO J. 23, 2116–2125 [DOI] [PMC free article] [PubMed] [Google Scholar]
- 8. Ekholm-Reed S., Spruck C. H., Sangfelt O., van Drogen F., Mueller-Holzner E., Widschwendter M., Zetterberg A., Reed S. I., Reed S. E. (2004) Cancer Res. 64, 795–800 [DOI] [PubMed] [Google Scholar]
- 9. Rajagopalan H., Jallepalli P. V., Rago C., Velculescu V. E., Kinzler K. W., Vogelstein B., Lengauer C. (2004) Nature 428, 77–81 [DOI] [PubMed] [Google Scholar]
- 10. Spruck C. H., Strohmaier H., Sangfelt O., Müller H. M., Hubalek M., Müller-Holzner E., Marth C., Widschwendter M., Reed S. I. (2002) Cancer Res. 62, 4535–4539 [PubMed] [Google Scholar]
- 11. Strohmaier H., Spruck C. H., Kaiser P., Won K. A., Sangfelt O., Reed S. I. (2001) Nature 413, 316–322 [DOI] [PubMed] [Google Scholar]
- 12. Matsumoto A., Onoyama I., Nakayama K. I. (2006) Biochem. Biophys. Res. Commun. 350, 114–119 [DOI] [PubMed] [Google Scholar]
- 13. Punga T., Bengoechea-Alonso M. T., Ericsson J. (2006) J. Biol. Chem. 281, 25278–25286 [DOI] [PubMed] [Google Scholar]
- 14. Sundqvist A., Bengoechea-Alonso M. T., Ye X., Lukiyanchuk V., Jin J., Harper J. W., Ericsson J. (2005) Cell Metab. 1, 379–391 [DOI] [PubMed] [Google Scholar]
- 15. Brown M. S., Ye J., Rawson R. B., Goldstein J. L. (2000) Cell 100, 391–398 [DOI] [PubMed] [Google Scholar]
- 16. Brown M. S., Goldstein J. L. (1999) Proc. Natl. Acad. Sci. U.S.A. 96, 11041–11048 [DOI] [PMC free article] [PubMed] [Google Scholar]
- 17. Brown M. S., Goldstein J. L. (1997) Cell 89, 331–340 [DOI] [PubMed] [Google Scholar]
- 18. Hua X., Yokoyama C., Wu J., Briggs M. R., Brown M. S., Goldstein J. L., Wang X. (1993) Proc. Natl. Acad. Sci. U.S.A. 90, 11603–11607 [DOI] [PMC free article] [PubMed] [Google Scholar]
- 19. Tontonoz P., Kim J. B., Graves R. A., Spiegelman B. M. (1993) Mol. Cell. Biol. 13, 4753–4759 [DOI] [PMC free article] [PubMed] [Google Scholar]
- 20. Yokoyama C., Wang X., Briggs M. R., Admon A., Wu J., Hua X., Goldstein J. L., Brown M. S. (1993) Cell 75, 187–197 [PubMed] [Google Scholar]
- 21. Horton J. D. (2002) Biochem. Soc. Trans. 30, 1091–1095 [DOI] [PubMed] [Google Scholar]
- 22. Shimano H. (2002) Vitam. Horm. 65, 167–194 [DOI] [PubMed] [Google Scholar]
- 23. Inoue N., Shimano H., Nakakuki M., Matsuzaka T., Nakagawa Y., Yamamoto T., Sato R., Takahashi A., Sone H., Yahagi N., Suzuki H., Toyoshima H., Yamada N. (2005) Mol. Cell. Biol. 25, 8938–8947 [DOI] [PMC free article] [PubMed] [Google Scholar]
- 24. Nakakuki M., Shimano H., Inoue N., Tamura M., Matsuzaka T., Nakagawa Y., Yahagi N., Toyoshima H., Sato R., Yamada N. (2007) FEBS J. 274, 4440–4452 [DOI] [PubMed] [Google Scholar]
- 25. Bengoechea-Alonso M. T., Punga T., Ericsson J. (2005) Proc. Natl. Acad. Sci. U.S.A. 102, 11681–11686 [DOI] [PMC free article] [PubMed] [Google Scholar]
- 26. Shimano H., Horton J. D., Shimomura I., Hammer R. E., Brown M. S., Goldstein J. L. (1997) J. Clin. Invest. 99, 846–854 [DOI] [PMC free article] [PubMed] [Google Scholar]
- 27. Shimano H., Shimomura I., Hammer R. E., Herz J., Goldstein J. L., Brown M. S., Horton J. D. (1997) J. Clin. Invest. 100, 2115–2124 [DOI] [PMC free article] [PubMed] [Google Scholar]
- 28. Matsuzaka T., Shimano H., Yahagi N., Kato T., Atsumi A., Yamamoto T., Inoue N., Ishikawa M., Okada S., Ishigaki N., Iwasaki H., Iwasaki Y., Karasawa T., Kumadaki S., Matsui T., Sekiya M., Ohashi K., Hasty A. H., Nakagawa Y., Takahashi A., Suzuki H., Yatoh S., Sone H., Toyoshima H., Osuga J., Yamada N. (2007) Nat. Med. 13, 1193–1202 [DOI] [PubMed] [Google Scholar]
- 29. Nakagawa Y., Shimano H., Yoshikawa T., Ide T., Tamura M., Furusawa M., Yamamoto T., Inoue N., Matsuzaka T., Takahashi A., Hasty A. H., Suzuki H., Sone H., Toyoshima H., Yahagi N., Yamada N. (2006) Nat. Med. 12, 107–113 [DOI] [PubMed] [Google Scholar]
- 30. Matsuzaka T., Shimano H., Yahagi N., Yoshikawa T., Amemiya-Kudo M., Hasty A. H., Okazaki H., Tamura Y., Iizuka Y., Ohashi K., Osuga J., Takahashi A., Yato S., Sone H., Ishibashi S., Yamada N. (2002) J. Lipid Res. 43, 911–920 [PubMed] [Google Scholar]
- 31. Kato T., Shimano H., Yamamoto T., Yokoo T., Endo Y., Ishikawa M., Matsuzaka T., Nakagawa Y., Kumadaki S., Yahagi N., Takahashi A., Sone H., Suzuki H., Toyoshima H., Hasty A. H., Takahashi S., Gomi H., Izumi T., Yamada N. (2006) Cell Metab. 4, 143–154 [DOI] [PubMed] [Google Scholar]
- 32. Yahagi N., Shimano H., Hasty A. H., Matsuzaka T., Ide T., Yoshikawa T., Amemiya-Kudo M., Tomita S., Okazaki H., Tamura Y., Iizuka Y., Ohashi K., Osuga J., Harada K., Gotoda T., Nagai R., Ishibashi S., Yamada N. (2002) J. Biol. Chem. 277, 19353–19357 [DOI] [PubMed] [Google Scholar]
- 33. Kumadaki S., Matsuzaka T., Kato T., Yahagi N., Yamamoto T., Okada S., Kobayashi K., Takahashi A., Yatoh S., Suzuki H., Yamada N., Shimano H. (2008) Biochem. Biophys. Res. Commun. 368, 261–266 [DOI] [PubMed] [Google Scholar]
- 34. Li L. O., Mashek D. G., An J., Doughman S. D., Newgard C. B., Coleman R. A. (2006) J. Biol. Chem. 281, 37246–37255 [DOI] [PubMed] [Google Scholar]
- 35. Bligh E. G., Dyer W. J. (1959) Can. J. Biochem. Physiol. 37, 911–917 [DOI] [PubMed] [Google Scholar]
- 36. Ide T., Shimano H., Yahagi N., Matsuzaka T., Nakakuki M., Yamamoto T., Nakagawa Y., Takahashi A., Suzuki H., Sone H., Toyoshima H., Fukamizu A., Yamada N. (2004) Nat. Cell Biol. 6, 351–357 [DOI] [PubMed] [Google Scholar]
- 37. Shimano H., Yahagi N., Amemiya-Kudo M., Hasty A. H., Osuga J., Tamura Y., Shionoiri F., Iizuka Y., Ohashi K., Harada K., Gotoda T., Ishibashi S., Yamada N. (1999) J. Biol. Chem. 274, 35832–35839 [DOI] [PubMed] [Google Scholar]
- 38. Matsusue K., Kusakabe T., Noguchi T., Takiguchi S., Suzuki T., Yamano S., Gonzalez F. J. (2008) Cell Metab. 7, 302–311 [DOI] [PMC free article] [PubMed] [Google Scholar]
- 39. Nishino N., Tamori Y., Tateya S., Kawaguchi T., Shibakusa T., Mizunoya W., Inoue K., Kitazawa R., Kitazawa S., Matsuki Y., Hiramatsu R., Masubuchi S., Omachi A., Kimura K., Saito M., Amo T., Ohta S., Yamaguchi T., Osumi T., Cheng J., Fujimoto T., Nakao H., Nakao K., Aiba A., Okamura H., Fushiki T., Kasuga M. (2008) J. Clin. Invest. 118, 2808–2821 [DOI] [PMC free article] [PubMed] [Google Scholar]
- 40. Puri V., Konda S., Ranjit S., Aouadi M., Chawla A., Chouinard M., Chakladar A., Czech M. P. (2007) J. Biol. Chem. 282, 34213–34218 [DOI] [PubMed] [Google Scholar]
- 41. Oishi Y., Manabe I., Tobe K., Tsushima K., Shindo T., Fujiu K., Nishimura G., Maemura K., Yamauchi T., Kubota N., Suzuki R., Kitamura T., Akira S., Kadowaki T., Nagai R. (2005) Cell Metab. 1, 27–39 [DOI] [PubMed] [Google Scholar]
- 42. Schroeder-Gloeckler J. M., Rahman S. M., Janssen R. C., Qiao L., Shao J., Roper M., Fischer S. J., Lowe E., Orlicky D. J., McManaman J. L., Palmer C., Gitomer W. L., Huang W., O'Doherty R. M., Becker T. C., Klemm D. J., Jensen D. R., Pulawa L. K., Eckel R. H., Friedman J. E. (2007) J. Biol. Chem. 282, 15717–15729 [DOI] [PMC free article] [PubMed] [Google Scholar]
- 43. Liu N., Li H., Li S., Shen M., Xiao N., Chen Y., Wang Y., Wang W., Wang R., Wang Q., Sun J., Wang P. (2010) J. Biol. Chem. 285, 18858–18867 [DOI] [PMC free article] [PubMed] [Google Scholar]
- 44. Zhao D., Zheng H. Q., Zhou Z., Chen C. (2010) Cancer Res. 70, 4728–4738 [DOI] [PubMed] [Google Scholar]
- 45. Rahimian R., Masih-Khan E., Lo M., van Breemen C., McManus B. M., Dubé G. P. (2001) Mol. Cell. Biochem. 224, 29–37 [DOI] [PubMed] [Google Scholar]
- 46. Carmona M. C., Louche K., Nibbelink M., Prunet B., Bross A., Desbazeille M., Dacquet C., Renard P., Casteilla L., Penicaud L. (2005) Int. J. Obes. 29, 864–871 [DOI] [PubMed] [Google Scholar]
- 47. Matsusue K., Haluzik M., Lambert G., Yim S. H., Gavrilova O., Ward J. M., Brewer B., Jr., Reitman M. L., Gonzalez F. J. (2003) J. Clin. Invest. 111, 737–747 [DOI] [PMC free article] [PubMed] [Google Scholar]
- 48. Medina-Gomez G., Gray S. L., Yetukuri L., Shimomura K., Virtue S., Campbell M., Curtis R. K., Jimenez-Linan M., Blount M., Yeo G. S., Lopez M., Seppänen-Laakso T., Ashcroft F. M., Oresic M., Vidal-Puig A. (2007) PLoS Genet. 3, e64 [DOI] [PMC free article] [PubMed] [Google Scholar]
- 49. Uno K., Katagiri H., Yamada T., Ishigaki Y., Ogihara T., Imai J., Hasegawa Y., Gao J., Kaneko K., Iwasaki H., Ishihara H., Sasano H., Inukai K., Mizuguchi H., Asano T., Shiota M., Nakazato M., Oka Y. (2006) Science 312, 1656–1659 [DOI] [PubMed] [Google Scholar]
- 50. Vidal-Puig A., Jimenez-Liñan M., Lowell B. B., Hamann A., Hu E., Spiegelman B., Flier J. S., Moller D. E. (1996) J. Clin. Invest. 97, 2553–2561 [DOI] [PMC free article] [PubMed] [Google Scholar]
- 51. Nandan M. O., Chanchevalap S., Dalton W. B., Yang V. W. (2005) FEBS Lett. 579, 4757–4762 [DOI] [PMC free article] [PubMed] [Google Scholar]
- 52. Nandan M. O., Yoon H. S., Zhao W., Ouko L. A., Chanchevalap S., Yang V. W. (2004) Oncogene 23, 3404–3413 [DOI] [PMC free article] [PubMed] [Google Scholar]
- 53. Riu E., Ferre T., Hidalgo A., Mas A., Franckhauser S., Otaegui P., Bosch F. (2003) FASEB J. 17, 1715–1717 [DOI] [PubMed] [Google Scholar]
- 54. Riu E., Bosch F., Valera A. (1996) Proc. Natl. Acad. Sci. U.S.A. 93, 2198–2202 [DOI] [PMC free article] [PubMed] [Google Scholar]
Associated Data
This section collects any data citations, data availability statements, or supplementary materials included in this article.


