

Background: Conditional gene targeting methods were used to investigate the role of melanocortin-3 receptors (MC3Rs).
Results: MC3Rs expressed in the brain are not sufficient to defend against diet-induced obesity but can improve metabolic homeostasis.
Conclusion: The role of MC3Rs in energy homeostasis involves central and peripheral actions.
Significance: This is the first evidence suggesting a role for central and peripheral MC3Rs in energy homeostasis.
Keywords: Hypothalamus, Insulin Resistance, Liver, Metabolic regulation, Neuroscience, Diabetes, Energy Homeostasis, Entrainment, Leptin, Melanocortin
Abstract
The melanocortin-3 receptor (MC3R) gene is pleiotropic, influencing body composition, natriuresis, immune function, and entrainment of circadian rhythms to nutrient intake. MC3Rs are expressed in hypothalamic and limbic regions of the brain and in peripheral tissues. To investigate the roles of central MC3Rs, we inserted a “lox-stop-lox” (LoxTB) 5′ of the translation initiation codon of the mouse Mc3r gene and reactivated transcription using neuron-specific Cre transgenic mice. As predicted based on earlier observations of Mc3r knock-out mice, Mc3rTB/TB mice displayed reduced lean mass, increased fat mass, and accelerated diet-induced obesity. Surprisingly, rescuing Mc3r expression in the nervous system using the Nestin-Cre transgene only partially rescued obesity in chow-fed conditions and had no impact on the accelerated diet-induced obesity phenotype. The ventromedial hypothalamus (VMH), a critical node in the neural networks regulating feeding-related behaviors and metabolic homeostasis, exhibits dense Mc3r expression relative to other brain regions. To target VMH MC3R expression, we used the steroidogenic factor-1 Cre transgenic mouse. Although restoring VMH MC3R signaling also had a modest impact on obesity, marked improvements in metabolic homeostasis were observed. VMH MC3R signaling was not sufficient to rescue the lean mass phenotype or the regulation of behaviors anticipating food anticipation. These results suggest that actions of MC3Rs impacting on energy homeostasis involve both central and peripheral sites of action. The impact of central MC3Rs on behavior and metabolism involves divergent pathways; VMH MC3R signaling improves metabolic homeostasis but does not significantly impact on the expression of behaviors anticipating nutrient availability.
Introduction
MC3Rs3 are a component of the melanocortin system composed of genes encoding the endogenous melanocortin receptor agonists (proopiomelanocortin), antagonists (agouti signaling protein, agouti-related peptide), and a family of five seven-transmembrane G-protein coupled receptors (1, 2). The phenotype of Mc3r knock-out (−/−) mice suggests a role in energy homeostasis. Mc3r−/− mice exhibit reduced lean mass, increased fat mass and accelerated DIO, and attenuated behavioral and metabolic adaptation to restricted feeding during the daytime (3–10). The impact of MC3Rs on energy homeostasis is thought to involve actions in the brain. Melanocortin neurons form a nutrient-sensing network that functions to coordinate the regulation of feeding-related behaviors, deposition of energy reserved as triglyceride in adipocytes, and glucose metabolism (1, 2, 9, 11–16). MC3Rs are expressed in the hypothalamus and limbic structures of the brain that regulate feeding-related behaviors and autonomic function (17, 18).
Obesity of Mc3r−/− mice is independent of hyperphagia and is thought to result from altered metabolism. However, whether MC3Rs regulate appetite remains unclear. Several groups have reported that inhibition of food intake by non-selective melanocortin agonists or activation of melanocortin neurons using serotonergic drugs does not require functional MC3Rs (6, 19–22). However, hyperphagia induced by melanocortin receptor antagonists may involve MC3Rs (23, 24). In other situations, activation of MC3R has been reported to either stimulate (25, 26) or inhibit (24) feeding behavior. Analyzing feeding behavior of Mc3r−/− mice has also yielded inconsistent results, with reports of hypophagia (6), normal food intake (3), or hyperphagia during the lights-on period (4). There is also evidence suggesting that MC3R in the periphery may regulate food intake (27, 28). A consensus on the role of MC3Rs in appetite regulation has not been established.
MC3Rs regulate feeding-associated behaviors, modulating the expression of food anticipatory activity (FAA) (8, 10, 29). FAA involves a timing mechanism that triggers increased food seeking behaviors anticipating nutrient availability. Although FAA exhibits characteristics suggesting a circadian mechanism, the location and molecular mechanisms of the putative “food-entrainable oscillators” governing the expression of this behavior remain enigmatic and controversial (29, 30).
To further investigate the functions of MC3Rs expressed in the brain and periphery in the control energy homeostasis, we inserted a lox-stop-lox (LoxTB) sequence to block Mc3r transcription. Homozygous carriers of the LoxTB MC3R allele (Mc3rTB/TB) display an obese phenotype similar to that observed in Mc3r−/− mice (13, 16). LoxTB MC3R mice can be used in conjunction with transgenic strains expressing Cre recombinase for cell type-specific reactivation to map functions associated with receptors expressed in discrete regions (31). Transgenic mice expressing Cre controlled by the rat nestin promoter and enhancer (Nes-Cre) were initially used to rescue expression in the nervous system (32). Surprisingly, the obese phenotype is only partially rescued in Nes-Cre;Mc3rTB/TB mice, suggesting that functions of peripheral MC3Rs impact on adiposity. The VMH, and in particular the dorsomedial VMH, exhibits dense Mc3r expression (3). VMH neurons impact on adiposity by regulating ingestive behaviors and the autonomic nervous system (33, 34) and modulate the expression of FAA (30). We therefore investigated the impact of restoring MC3R signaling in the VMH on energy homeostasis using steroidogenic factor-1 (SF-1) Cre transgenic mice (35). Analysis of SF1-Cre;Mc3rTB/TB mice indicates that the action of VMH MC3R results in a partial rescue of the body composition phenotype, attenuating the change in fat mass while not affecting lean mass, and markedly improves metabolic homeostasis. However, actions of MC3R in neurons residing outside the VMH are required for the expression of food anticipatory activity.
EXPERIMENTAL PROCEDURES
Gene Targeting and Animal Husbandry
A targeting vector was generated using recombineering within SW106 cells (36). A mouse Bacterial Artificial Chromosome DNA (RP23 386 B9, BACPAC Resources Center at Children's Hospital Oakland Research Institute) was used to retrieve the murine Mc3r gene. The LoxP-flanked transcriptional blocker sequence, provided generously by Dr. Joel Elmquist (University of Texas Southwestern (UT Southwestern, Dallas, TX) and Dr. Bradford Lowell (Beth Israel Deaconess Medical Center, Boston, MA) (31), was inserted between the transcriptional start site (148 bp) and translation start site (140 bp); an IRES-AcGFP1 cassette from pIRES2-AcGFP1-Nuc (Clontech) was inserted into the 3′-untranslated region. The final targeting construct consisted of the loxP-TB-loxP; MC3R open reading frame; and IRES-AcGFP1 flanked by 5′ end homology arm (5.5 kb) and 3′ end arm (2.0 kb), which was electroporated into C57BL/6J (B6) ES cell line Bruce 4 (a gift from the NCI, National Institutes of Health). Correct targeting was confirmed using high fidelity PCR analyses and DNA sequencing. ES cells were injected into the blastocysts of female albino B6 strain C57BL/6J-Tyrc-2J obtained from The Jackson Laboratory. Chimeras were then crossed with the albino B6 strain to screen for heterozygous carriers of the modified allele. Studies analyzing the phenotype of Mc3rTB/TB mice were performed using mice congenic on the B6 background.
For Cre-mediated excision of the transcriptional block, we used three transgenic strains. B6.FVB-Tg(EIIa-cre)C5379Lmgd/J mice were used to generate Mc3rΔ/Δ mice (mice with a single LoxP site in the 5′-UTR) and are on a mixed C57BL/6J;C57BL/6N background. B6.Cg-Tg(Nes-Cre)1Kln/J mice used to generate Nes-Cre;Mc3rTB/TB mice are on the C57BL/6J background. The FVB-Tg(Nr5a1-Cre)2Lowl/J strain used to generate SF1-Cre;Mc3rTB/TB mice is on the FVB/NJ background. Note that for all studies, the correct controls were used (i.e. the SF1-Cre(+ve) and SF1-Cre(−ve) controls for SF1-Cre;Mc3rTB/TB mice were littermates derived from mating SF1-Cre;Mc3rTB/+ and Mc3rTB/+ parents on a mixed FVB;B6 background).
Assessment of Movement, Food Intake, and Energy Expenditure
Assessment of food intake, movement in the x axis, energy expenditure (24 h, resting and non-resting), and the respiratory exchange ratio (RER, an indicator of whole body substrate preference) involved a 16-chamber comprehensive laboratory animal monitoring system housed as described previously (5, 10). FAA was assessed using running wheels as described previously (10). The impact of Mc3rTB genotype on DIO was studied used a purified high fat diet (HFD, 60% kJ/fat).
In Situ Hybridization Histochemistry
Fresh frozen brains were collected and processed for in situ hybridization as described previously (37). Coronal sections (20 μm) were cut on a cryostat and thaw-mounted onto Superfrost Plus slides (VWR Scientific, West Chester, PA). Hypothalamic sections were collected in a 1:6 series from the diagonal band of Broca (bregma 0.50 mm) caudally through the mammillary bodies (bregma −5.00 mm). Antisense 33P-labeled rat MC3R riboprobe (corresponding to bases 808–1204; GenBank accession number NM_008561.3) (0.2 pmol/ml) was denatured, dissolved in hybridization buffer along with tRNA (1.7 mg/ml), and applied to slides. Controls used to establish the specificity of the MC3R riboprobe included slides incubated with an equivalent concentration of radiolabeled sense MC3R riboprobe or radiolabeled antisense probe in the presence of excess (1000×) unlabeled antisense probe. Slides were covered with glass coverslips, placed in a humid chamber, and incubated overnight at 55 °C. The following day, slides were treated with RNase A and washed under conditions of increasing stringency. Slides were dipped in 100% ethanol, air-dried, and then dipped in NTB-2 liquid emulsion (Eastman Kodak Co.). Slides were developed 16 days later and covered with glass coverslips.
Blood Chemistries
Insulin and blood glucose were measured in fed mice as described previously (9). Leptin, Mcp1, interleukin-6 (Il-6), and resistin were measured using a multiplex MAP magnetic-based immunoassay (Millipore, Billerica, MA). Triglyceride and β-hydroxybutyrate were measured using a GM7 MicroStat analyzer (Analox Instruments USA, Inc., Lunenburg, MA).
Gene Expression Analysis
RNA isolated from liver tissue using TRIzol was converted to biotin-labeled cDNA using the Ambion Illumina total prep RNA amplification kit. Pooled samples were hybridized on 24 arrays using three MouseRef-8 v2 Expression BeadChips for the analysis of 18,138 genes based on RefSeq release 22 and supplemented with MEEBO and RIKEN FANTOM2 content. Each probe is represented with an average of 30-fold redundancy (5-fold minimum). The resultant array data (gene level data) were preprocessed by GenomeStudio software version 1.0.6 (Illumina Inc., San Diego, CA) to give quantile-normalized gene level data. Each record in the subject-level data file represented a single gene with columns providing the expression intensity for each of 24 subjects and the p value for each gene on the array. The expression of candidate genes of interest was assessed using a 7900HT fast real-time PCR system and total RNA samples from individual mice as described previously (9, 10).
RESULTS
Targeting the Mc3r Locus
Insertion of the LoxTB sequence into the 5′-UTR of the mouse Mc3r gene (Fig. 1A) suppressed hypothalamic expression assessed by in situ hybridization (Fig. 1, B and C) or quantitative RT-PCR (Mc3r expression in the mediobasal hypothalamus as arbitrary units normalized to cyclophilin E for wild type (WT), 1.04 ± 0.14, n = 5; for Mc3rTB/TB, 0.02 ± 0.01, n = 4, p < 0.0001). Male and female Mc3rTB/TB mice weaned onto standard chow exhibited normal body weight at 8 weeks (Fig. 1C, n = 6–11/group). However, analysis of body composition by NMR revealed reduced fat-free mass (FFM) and increased fat mass (FM) (Fig. 1D). Accumulation of FM in females fed an HFD was more pronounced in Mc3rTB/TB mice (Fig. 1E). Mc3rTB/TB mice thus display altered body composition and accelerated DIO observed previously for Mc3r−/− mice (3–7).
FIGURE 1.

Gene targeting strategy and assessment of the obese phenotype of Mc3rTB/TB mice (data in this and subsequent figures are presented as mean ± S.E.). A, schematic showing insertion of the LoxP-flanked transcriptional blocker (LoxTB) into the mouse Mc3r gene. An IRES-acGFP cassette inserted 3′ of the MC3R open reading frame (ORF) is not shown. B, analysis of hypothalamic Mc3r expression by in situ hybridization in Mc3rΔ/Δ, Mc3rTB/TB, and SF1-Cre;Mc3rTB/TB mice. Mc3r expression is observed in the VMH and arcuate nucleus of the hypothalamus (ARC) of Mc3rΔ/Δ mice, but not in Mc3rTB/TB mice. SF1-Cre;Mc3rTB/TB mice exhibit diffuse signal in the VMH but not in the arcuate nucleus of the hypothalamus. 3V, third ventricle. C–D, body weight and analysis of fat-free mass and fat mass in female and male WT and Mc3rTB/TB mice aged 8–10 weeks (n = 6–11/group). Mc3rTB/TB mice had normal body weight but exhibited reduced FFM and increased FM. *, p < 0.05 versus WT. E, accelerated DIO in female Mc3rTB/TB mice. Mice were fed a purified low fat diet (LFD, 10% kJ/fat) or HFD (60% kJ/fat) for 6 weeks. Body weight (left panel) was significantly affected by genotype in the HFD-fed group but not in mice fed low fat diet. The right panel shows body composition. The difference in body weight after HFD feeding was due to increased FM. *, p < 0.05 versus WT.
To test whether removal of the LoxTB sequence restores expression and function, we removed the LoxTB sequence globally using EIIa-Cre mice (38). Mc3rΔ/Δ mice retained a single LoxP site and exhibited normal Mc3r expression in the mediobasal hypothalamus (Fig. 1B). Body weight and composition of Mc3rΔ/Δ mice fed standard chow were normal (body weight: for WT, 20.8 ± 1.3 g; Mc3rΔ/Δ, 20.9 ± 0.7 g; FM as a percentage of body weight: WT, 7.0 ± 1.1%; for Mc3rΔ/Δ, 9.9 ± 1.4%; n = 5 for WT, n = 6 for Mc3rΔ/Δ). Mc3rΔ/Δ mice also exhibited normal weight gain when fed an HFD (body weight: for WT, 33.9 ± 2.7 g; for Mc3rΔ/Δ, 31.2 ± 2.2 g; FM as a percentage of body weight: for WT, 33.7 ± 2.7%, for Mc3rΔ/Δ, 29.7 ± 2.7%).
Partial Rescue of Obesity in Nes-Cre;Mc3rTB/TB Mice
To investigate whether the actions of MC3R in neurons are sufficient to rescue the obesity phenotype, Mc3rTB/TB mice were crossed with Nes-Cre transgenic mice. Evidence for recombination in genomic DNA isolated from the mediobasal hypothalamus and restoration of Mc3r expression was observed in the central nervous system of Nes-Cre;Mc3rTB/TB mice (data not shown).
In chow-fed conditions, the increase in FM associated with loss of MC3Rs was attenuated in Nes-Cre;Mc3rTB/TB mice (Fig. 2, A–C, n = 5/group). The effects of the Nes-Cre and Mc3rTB genotypes on body composition was assessed using two-way analysis of variance. FFM was significantly reduced by the Nes-Cre transgene (p < 0.05), with no effect of Mc3rTB genotype (p = 0.30). An effect of the Nes-Cre transgene on body composition has been reported (39) and may have masked the impact of the Mc3rTB genotype on FFM. Mc3rTB genotype had a significant impact on FM (p < 0.05) and adiposity (FM as percentage of total weight, p < 0.005). There was no significant effect of the Nes-Cre transgene on either parameter. There was a trend (p = 0.06) for an effect of Mc3rTB genotype on body weight that was not observed in Nes-Cre;Mc3rTB/TB mice.
FIGURE 2.
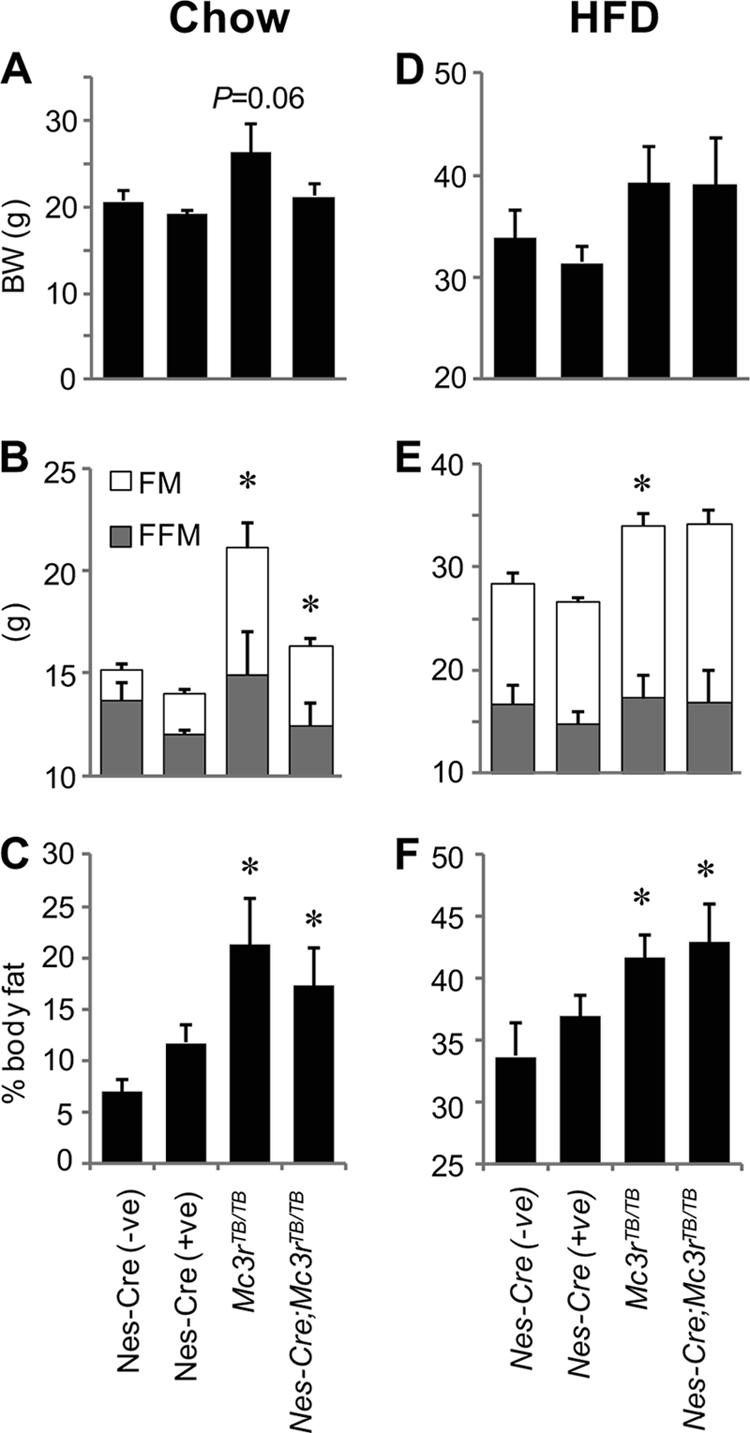
Comparison of the obesity phenotype in Nes-Cre;Mc3rTB/TB mice and Mc3rTB/TB mice in chow-fed mice (A–C) and after HFD feeding for 6 weeks (D–F) suggests that actions of MC3R in peripheral tissues impact on obesity. The impact of Mc3rTB genotype on body weight (BW) (A and D) and FM (B and E) was attenuated by the Nes-Cre transgene in chow-fed conditions (A and B); however, with HFD feeding, this difference was lost (D and E). FFM was not affected by either genotype, irrespective of diet (B and E). Analysis of adiposity (FM as a percentage of body weight) indicated a minimal impact of the Nes-Cre transgene in chow-fed (C) and no impact in HFD-fed (F) conditions. *, p < 0.05 versus Nes-Cre(+ve) or Nes-Cre(−ve), n = 5/group. Female mice were used for this study.
In mice fed HFD for 6 weeks, the Nes-Cre transgene had no impact on the obese phenotype of Mc3rTB/TB mice (Fig. 2, D–F). Analysis of the impact of Nes-Cre and Mc3rTB genotype on body weight and composition using two-way analysis of variance suggested a significant effect of Mc3rTB genotype on FM (p < 0.05) and adiposity (p < 0.01). There was a also a trend for an impact of Mc3rTB genotype on body weight (p = 0.06). However, the Nes-Cre genotype had no effect on any of these parameters, irrespective of the Mc3rTB genotype.
Partial Rescue of the Obesity Phenotype in SF1-Cre;Mc3rTB/TB Mice
Analysis of Mc3r expression by in situ hybridization indicated diffuse staining in the VMH of SF1-Cre;Mc3rTB/TB mice; no expression was observed in other hypothalamic and extra-hypothalamic regions (Fig. 1D and data not shown). We examined whether the SF1-Cre transgene had an effect on body weight and composition. SF1-Cre mice had normal body weight and composition (body weight: for WT, 29.1 ± 0.8 g; for SF1-Cre, 31.1 ± 1.2 h; percentage of body fat: for WT, 7.4 ± 0.8%; for SF1-Cre, 8.3 ± 1.4%; n = 9 for SF1-Cre(−ve) mice, n = 13 for SF1-Cre(+ve) mice).
We assessed the impact of restoring VMH MC3R on adiposity using male WT (n = 22), Mc3rTB/TB (n = 24), and SF1-Cre;Mc3rTB/TB mice (n = 19). SF1-Cre;Mc3rTB/TB mice did not exhibit a modest increase body weight observed in this group of Mc3rTB/TB mice (Fig. 3A). The increase in FM and adiposity observed in Mc3rTB/TB mice was also attenuated in SF1-Cre;Mc3rTB/TB mice (Fig. 3, B and C). However, a significant reduction in FFM was still observed in SF1-Cre;Mc3rTB/TB mice (Fig. 3B).
FIGURE 3.

Impact of the SF1-Cre transgene on body composition of Mc3rTB/TB mice. Body weight and composition were analyzed using 10–12-week-old male WT mice (n = 22), Mc3rTB/TB mice (n = 24), and SF1-Cre;Mc3rTB/TB mice (n = 19). A, increased body weight observed of Mc3rTB/TB mice is not observed in SF1-Cre;Mc3rTB/TB mice (*, p < 0.05). B, SF1-Cre;Mc3rTB/TB mice exhibit an attenuated increase in FM, but the reduction in FFM is not affected. C, increased adiposity (percentage of body fat) observed in Mc3rTB/TB mice was attenuated by 40% in SF1-Cre;Mc3rTB/TB mice. Values with different letters are significantly different at the p < 0.01 level for fat mass and at the p < 0.05 level for fat-free mass. Values with the same letters are not significantly different. D, hyperinsulinemia observed in obese Mc3rTB/TB mice is not observed in SF1-Cre;Mc3rTB/TB mice (*, p < 0.05 versus WT, SF1-Cre;Mc3rTB/TB mice). E, blood glucose is not affected by genotype. F, hyperleptinemia observed with obesity in Mc3rTB/TB mice is attenuated n SF1-Cre;Mc3rTB/TB mice. Sera used for the measurement of insulin, glucose, and leptin were collected from fed mice.
Obesity in Mc3r−/− mice is associated with hyperinsulinemia and hyperleptinemia, interpreted to be due to increased FM (3, 6). Mc3rTB/TB mice also exhibited fasting hyperinsulinemia (Fig. 3D) with euglycemia (Fig. 3E), suggesting insulin resistance. Hyperinsulinemia was not observed in SF1-Cre;Mc3rTB/TB mice (Fig. 3D). Mc3rTB/TB mice displayed hyperleptinemia corresponding with increased adiposity; this was moderately attenuated in Sf1-Cre;Mc3rTB/TB mice consistent with attenuated obesity (Fig. 3F).
The SF1-Cre Transgene Modifies the Impact of Mc3rTB Genotype on Whole Body Substrate Metabolism
We next assessed the metabolic phenotype of Mc3rTB/TB and SF1-Cre;Mc3rTB/TB mice. Food intake, activity, and energy expenditure were measured simultaneously in WT (n = 16), Mc3rTB/TB (n = 8), and SF1-Cre;Mc3rTB/TB mice (n = 8). Note that the “WT group” consisted of eight SF1-Cre transgenic and eight normal littermates; because the SF1-Cre genotype had no significant effect on any of the parameter, these data were pooled for statistical analysis. Body weight and composition for the mice used are shown in Fig. 4A. Food intake was not affected by genotype (Fig. 4B). Presentation and interpretation of energy expenditure data have been recently discussed (40, 41). Energy expenditure data are thus presented per mouse and normalized for either FFM or total body weight (Fig. 4, C–J). Energy expenditure expressed in kJ/h per mouse was lower in Mc3rTB/TB mice in the mid-dark period (Fig. 4C), although this effect was subtle and did not translate into significant differences in 24-h energy expenditure (Fig. 4D). Energy expenditure expressed per kg of fat-free mass was also not significantly different between genotype. However, when expressed per kg of body weight, there was a significant reduction in Mc3rTB/TB mice, but not in SF1-Cre;Mc3rTB/TB mice (Fig. 4, G and H). Further evidence for a modifier effect of the SF1-Cre transgene on the energy expenditure phenotype of Mc3rTB/TB mice came from regression analysis of energy expenditure data as a function of body weight (5) and from analyzing the respiratory exchange ratio (RER). Resting energy expenditure and total energy expenditure correlated with body weight in Mc3rTB/TB and in SF1-Cre;Mc3rTB/TB mice; the regression line for Mc3rTB/TB mice was lower when compared with SF1-Cre;Mc3rTB/TB mice (Fig. 4, I and J). The RER is an indicator of energy derived from oxidizing glucose or fatty acids (42) and was lower in Mc3rTB/TB mice when compared with WT and SF1-Cre;Mc3rTB/TB mice (Fig. 4, K and L). This observation is surprising given that our previously published results from studies analyzing the RER of melanocortin receptor knock-out mice (4, 10, 43). The differences in RER were not due to altered food intake (Fig. 4B), whereas the mice were also in a positive energy balance (weight gain in grams: for WT, 0.5 ± 0.1 g/day; for Mc3rTB/TB mice, 0.4 ± 0.1 g/day; and for SF1-Cre;Mc3rTB/TB mice, 0.4 ± 0.1 g/day).
FIGURE 4.

Impact of altered Mc3r expression on whole body metabolic activity. A, body weight and composition of the WT (n = 16), Mc3rTB/TB (n = 8), and SF1-Cre;Mc3rTB/TB mice were used to assess whole body energy metabolism using indirect calorimetry. The difference in body weight of Mc3rTB/TB mice and WT was significant (*, p < 0.05). There was no statistically significant difference in FFM in the smaller cohort of mice used in these experiments. FM was significantly increased in Mc3rTB/TB mice; this was attenuated in SF1-Cre;Mc3rTB/TB mice. Values not sharing letters are significantly different, p < 0.05. The difference in fat mass of Mc3rTB/TB and SF1-Cre;Mc3rTB/TB mice did not achieve significance (p = 0.074). B, food intake was not affected by genotype (these data represent the average of 3 days of measurements). C and D, energy expenditure expressed as kJ/h. C, analysis of data expressed in 1-h bins indicated significantly lower energy expenditure of Mc3rTB/TB mice when compared with WT during a short period in the dark (*, p < 0.05). D, averaged energy expenditure over 24 h, in the dark or lights-on periods. E and F, energy expenditure normalized to fat-free mass (kJ/kgFFM/h). G and H, energy expenditure normalized to total body weight (kJ/kgFFM/h) was significantly lower in Mc3rTB/TB mice when compared with both WT and SF1-Cre;Mc3rTB/TB mice (*, p < 0.01). I and J, regression analysis of resting energy expenditure (REE) (I) or total 24-h energy expenditure (TEE) (J) as a function of body weight. K and L, the RER (an indicator of the ratio of energy derived from oxidizing glucose or fatty acids) is significantly higher in SF1-Cre;Mc3rTB/TB mice relative to Mc3rTB/TB mice.
A hallmark of the Mc3r-deficient phenotype is reduced physical activity (3, 4, 6, 10, 44). Activity measured using either cross-beam breaks or running wheels was reduced in Mc3rTB/TB mice during the dark period (Fig. 5, A–D). The physical activity phenotype associated with Mc3r deficiency was only partially rescued in SF1-Cre;Mc3rTB/TB mice (Fig. 5, A–C), indicating that actions of MC3R expressed in SF1(+ve) neurons are not sufficient to completely restore locomotor behavior to normal levels. Changes in physical activity could impact on energy expenditure. Non-resting energy expenditure, the portion of energy expenditure attributable to movement and feeding, is reduced in Mc3r−/− mice (5), and in this study, it was reduced by 30% in Mc3rTB/TB mice but was normal in SF1-Cre;Mc3rTB/TB mice (Fig. 5E). Resting energy expenditure was not significantly affected by genotype (Fig. 5E).
FIGURE 5.

Impact of altered Mc3r expression on locomotor activity (A–D) and non-resting energy expenditure (E). A and B, assessment of locomotor activity using cross-beam breaks (X-beam breaks) in WT (n = 16), Mc3rTB/TB (n = 8), and SF1-Cre;Mc3rTB/TB mice (n = 8). A shows movement in bins of 1 h, with each point being the mean of 3 days of measurements, whereas B shows movement expressed as total 24-h activity, activity during the dark period, and activity during the lights-on period. Mc3rTB/TB mice exhibit periods of reduced activity during the dark period (*, p < 0.05 versus WT). This phenotype is attenuated in SF1-Cre;Mc3rTB/TB mice. C and D, wheel-running activity of WT (n = 12), Mc3rTB/TB (n = 14), and SF1-Cre;Mc3rTB/TB mice (n = 13). C, activity in 1-h bins; each bin was an average of 2 days of measurements (*, p < 0.05 WT versus Mc3rTB/TB; †, p < 0.05 WT versus Mc3rTB/TB,SF1-Cre;Mc3rTB/TB). D, analysis of the data expressed as total 24-h activity, activity during the dark period, and activity during the lights-on period. Mc3rTB/TB and SF1-Cre;Mc3rTB/TB mice are less active in the dark period when compared with WT controls (*, p < 0.05 versus WT). E, reduced non-resting energy expenditure observed in Mc3rTB/TB mice is not observed in SF1-Cre;Mc3rTB/TB mice (*, p < 0.05 versus WT); resting energy expenditure was not significantly affected by genotype.
Improved Metabolic Profile of SF1-Cre;Mc3rTB/TB Mice
Obesity and insulin resistance are associated with fatty liver disease and altered expression of lipogenic enzymes (45). To assess the impact of Mc3r deficiency and obesity on liver metabolism, we performed a microarray analysis of gene expression. This analysis indicated that changes due to MC3R signaling and obesity were attenuated in SF1-Cre;Mc3rTB/TB mice (Fig. 6, A and B). Using a 1.5-fold up- or down-regulation as a threshold, 219 genes met the criteria in Mc3rTB/TB mice, whereas 117 met the criteria in SF1-Cre;Mc3rTB/TB mice. Use of a more stringent criteria (2-fold change) resulted in a more stark difference, with 63 genes meeting the criteria in Mc3rTB/TB mice and only 23 meeting the criteria in SF1-Cre;Mc3rTB/TB mice. Using pathway analysis indicated an enrichment for genes involved in the metabolism of xenobiotics by cytochrome P450 (19 genes, p < 0.0001), arachidonic acid metabolism (12 genes, p < 0.0001), linoleic acid metabolism (eight genes, p < 0.0001), glutathione metabolism (eight genes, p < 0.001), peroxisome proliferator-activated receptor signaling (eight genes, p < 0.005), and biosynthesis of unsaturated fatty acids/fatty acid metabolism (six genes, p < 0.001). We assessed changes in expression of selected genes using quantitative RT-PCR (Fig. 6C). Analysis of serum lipids indicated significantly lower levels of total triglycerides TG in Mc3rTB/TB mice. However, a similar effect was observed in SF1-Cre;Mc3rTB/TB mice (Fig. 6D). Although the pattern of gene expression and RER suggests altered fat oxidation, β-hydroxybutyrate levels were not affected by genotype (Fig. 6D).
FIGURE 6.

Microarray analysis of liver gene expression indicates that relaxed control of metabolic homeostasis in Mc3rTB/TB mice is improved in SF1-Cre;Mc3rTB/TB mice. A, scatter plot comparing the densities of gene expression in livers of Mc3rTB/TB or SF1-Cre;Mc3rTB/TB mice with WT. SF1-Cre;Mc3rTB/TB mice (red circles) exhibit reduced variability in gene expression relative to WT when compared with Mc3rTB/TB mice (blue circles). B, heat map comparing genes that exhibited >1.5-fold change in expression in Mc3rTB/TB (TB/WT) with SF1-Cre;Mc3rTB/TB (SF1/TB) mice. Red indicates up-regulation; green indicates down-regulation. C, assessment of genes selected from the microarray results by quantitative RT-PCR confirmed the effect of genotype on genes exhibiting large -fold changes in expression (Cidec, Cidea, Pdk4, and Apoa4). For Cidec, the presence of different letters indicates significance at the p < 0.05 level; for other genes, * indicates significance when compared with WT values at the p < 0.05 level. D, serum triglycerides (TG) and β-hydroxybutyrate (BHB). *, p < 0.05 when compared with WT. E–G, measurements of inflammatory cytokines in serum. *, p < 0.05 when compared with WT.
Obesity is associated with a mild state of inflammation that contributes to the insulin-resistant phenotype (46). Inspection of the microarray results suggested that induction of inflammatory processes altered in Mc3rTB/TB mice was attenuated in SF1-Cre;Mc3rTB/TB mice. We therefore measured secreted factors linked to inflammatory processes. Significant increases in the serum levels of monocyte chemoattractant protein-1 (Mcp1) and resistin, but not in Il-6, were observed in Mc3rTB/TB mice (Fig. 6E). This aspect of the metabolic phenotype was improved in SF1-Cre;Mc3rTB/TB mice (Fig. 6E).
FAA Is Not Rescued in SF1-Cre;Mc3rTB/TB Mice
FAA was assessed using the restricted feeding (RF) protocol previously employed by our laboratory (10). Based on the recommendations of our Institutional Animal Care and Use Committee, the amount of food provided, although initially reduced to induce the behavior, was then modified to “clamp” weight loss at 10–15% (10). Weight loss was therefore not significantly different between groups (WT, 3.8 ± 0.4 g; Mc3rTB/TB, 5.7 ± 1.0 g; and SF1-Cre;Mc3rTB/TB, 3.9 ± 0.6 g). However, on average, more food was required to protect both Mc3rTB/TB and SF1-Cre;Mc3rTB/TB mice from weight loss exceeding 15% of initial body weight (food intake: for WT, 60.1 ± 0.1 kJ/day; for Mc3rTB/TB, 63.8 ± 0.3 kJ/day; and for SF1-Cre;Mc3rTB/TB, 63.3 ± 0.2 kJ/day; WT versus SF1-Cre;Mc3rTB/TB and Mc3rTB/TB mice, p < 0.001).
WT mice subjected to RF, where food is provided during the lights-on period to mice housed in a light-dark cycle, displayed FAA (Fig. 7). A reduction in total activity was observed, consistent with an effect of reduced caloric intake (Fig. 7, A and B). This reduction was most severe particularly during the dark period (Fig. 7, C and D) as activity in the lights-on period was increased by RF (Fig. 7, E and F). FAA, which is the amount of activity during the 2-h period prior to food presentation, was also increased relative to activity at the same time during ad libitum feeding (Fig. 7, G–I).
FIGURE 7.

Attenuated expression of FAA and altered locomotor response of Mc3rTB/TB mice to restricted feeding are not rescued in SF1-Cre;Mc3rTB/TB mice. After a 2-week acclimation period, Mc3rTB/TB mice weighed 10% more than WT and SF1-Cre;Mc3rTB/TB mice (body weight: for WT, 26.7 ± 0.8 g; for Mc3rTB/TB, 30.1 ± 1.1 g; and for SF1-Cre;Mc3rTB/TB, 27.7 ± 0.9; Mc3rTB/TB versus WT, p < 0.01; versus SF1-Cre;Mc3rTB/TB, p < 0.05). Note that for A, C, E, and G, the x axis is the same; activity during ad libitum feeding (AL) is in the blue shaded region. All mice were subject to 19 days of restricted feeding (RF). After 5 days of RF, the amount of food provided was increased incrementally to protect mice from excessive weight loss. A and B, restricted feeding results in reduced 24-h activity in WT mice, but not in Mc3rTB/TB mice (**, p < 0.01 versus WT). A shows daily activity during the course of RF, whereas B shows the averaged percentage of change in activity associated with RF. The behavioral phenotype may be partially improved in SF1-Cre;Mc3rTB/TB mice, with an intermediate change in activity. C and D, activity during the dark period was reduced in WT, but not in Mc3rTB/TB or SF1-Cre;Mc3rTB/TB mice, after 4–5 days of RF (*, p < 0.05 WT versus SF1-Cre;Mc3rTB/TB mice, **, p < 0.01 WT versus Mc3rTB/TB mice). E and F, RF was associated with increased activity in the lights-on phase in WT mice, and this response was attenuated in Mc3rTB/TB and SF1-Cre;Mc3rTB/TB mice. G and H, assessment of activity in the lights-on phase expressed as a percentage of total 24 h activity. RF increased the proportion of activity during the lights-on phase in WT mice only; note that this effect was attenuated when mice were presented more food to prevent excess weight loss. *, p < 0.05 versus WT and SF1-Cre;Mc3rTB/TB. The level of activity in the daytime as a proportion of total 24 h activity was higher in Mc3rTB/TB mice fed ad libitum. *, p < 0.05 versus WT, ** p < 0.01 versus WT. I, expression of FAA as a percentage of total activity; the data are averaged values during the course of RF. *, p < 0.05 versus WT.
As predicted based on our earlier observation using Mc3r−/− mice, the reduction of activity in the dark period, stimulation of activity in the lights-on period, and expression of FAA during RF were attenuated in Mc3rTB/TB mice (Fig. 7, A–I). Indeed, activity of Mc3rTB/TB mice was actually moderately increased during RF when compared with baseline values (Fig. 7, A and B). In contrast, the increase in activity during the lights-on period, and more specifically during the 2-h period preceding food presentation, during RF was attenuated in Mc3rTB/TB mice (Fig. 7, E–I). This behavioral deficit in the response to RF was not significantly modified in SF1-Cre;Mc3rTB/TB mice (Fig. 7, A–I). Mc3r−/− mice subject to RF exhibit an altered rhythmicity in the expression of clock genes in the cortex (10). Altered expression of clock genes in the cortex was observed in both Mc3rTB/TB and SF1-Cre;Mc3rTB/TB mice subject to RF (Fig. 8) (n = 5–6/group).
FIGURE 8.

Expression of clock genes in the cortex of WT, Mc3rTB/TB, and SF1-Cre;Mc3rTB/TB mice subject to RF. On the final day of RF, food was not provided. Brain samples were collected at 2400 (AM) or 1200 (PM), and total RNA was extracted to measure the expression of clock genes using quantitative RT-PCR.
DISCUSSION
These experiments had three objectives. The first was to generate and validate the LoxTB MC3R mouse strain as a model for the genetic dissection of MC3R function. This strategy using Cre-mediated recombination to reactivate transcription was successfully used for the conditional targeting of the mouse Mc4r gene (31, 47). Homozygous carriers of the LoxTB MC3R allele (Mc3rTB/TB) mice displayed loss of Mc3r expression and altered body composition and behavioral characteristics previously reported to be associated with loss of MC3Rs by our laboratory (4, 5, 10) and others (3, 6, 7, 48). We determined that removing the lox-stop-lox sequence globally using EIIa-Cre rescued the obese phenotype. Collectively, these results indicated the successful inhibition of Mc3r transcription through insertion of the LoxTB sequence and indicated that removing this sequence using Cre-mediated recombination restores functionality. Although we had inserted an IRES-acGFP sequence downstream of the MC3R open reading frame, the level of expression was insufficient for detecting GFP immunoreactivity. This model will be an important genetic tool for the dissection of neural circuits involved in the expression of feeding-related behaviors and may also be useful for investigating the functions of this receptor in non-neural cell types.
Mc3rTB/TB mice exhibited an obese phenotype associated with hyperinsulinemia, hyperleptinemia, and evidence of a mild inflammatory condition associated with obesity (46). The obese phenotype appears to be metabolic as food intake is normal. Analysis of liver gene expression indicated the effects of loss of MC3R signaling and obesity on fatty acid metabolism and suggested altered immune function. Of note, Mc3rTB/TB mice exhibited a marked increase in the expression of proteins belonging to the cell death-inducing DFF45-like effector (CIDE) family that localize to lipid droplets and the endoplasmic reticulum; up-regulation correlates with obesity, hepatic steatosis, and insulin resistance (49, 50).
A Role for Peripheral MC3Rs in Protecting against Obesity?
Melanocortin neurons form a critical node in the nutrient sensing networks governing the expression of ingestive behaviors and maintaining metabolic homeostasis in response to internal signals of metabolic status (1, 8). These actions are thought to be mediated primarily by the two melanocortin receptors that are expressed in the central nervous system (MC3R and MC4R). Loss of MC4R function causes hyperphagia, increased lean mass, and obesity; restoring MC4R expression in the nervous system using the same approach described for these experiments was sufficient to rescue this phenotype (31). These results imply that the functions of MC4R expressed outside the nervous system have a minimal impact on the obese phenotype.
Loss of MC3R function is also associated with obesity, although this phenotype is more dependent on dietary fat content. In chow-fed conditions, loss of MC3R function has a subtle impact on body weight, increasing adiposity by reducing lean mass and increasing fat mass. When exposed to high fat diets, MC3R-deficient mice display accelerated weight gain. Our initial hypothesis was that the impact of MC3Rs on energy homeostasis and protection from obesity involved actions in the central nervous system. However, the results of the current study are surprising and important in suggesting that the impact of the interaction between Mc3r genotype and diet on obesity may result from actions outside the central nervous system. Although neural MC3R can compensate for loss of peripheral actions in chow-fed conditions, neural MC3R had no impact on obesity in situations of increased dietary fat consumption.
How the actions of peripheral MC3Rs impact on obesity is not clear. However, MC3Rs are expressed in the periphery. For example, MC3Rs expressed in the renal cortex and medulla regulate natriuresis and salt-sensitive hypertension (51). MC3Rs expressed by the immune system regulate inflammation (52). Whether and how MC3Rs expressed in these organ systems impact on increased propensity for diet-induced obesity is not clear. One possibility is that the regulation of inflammation by MC3Rs impacts on obesity. Obesity is associated with a mild inflammatory condition (46); whether inhibiting inflammation prevents obesity is less clear, although cases where inhibiting the inflammatory responses protects against DIO have been reported (53, 54). Another possibility is evidence for a role for peripheral melanocortin receptors in regulating some food intake (19, 27, 28). Intraperitoneal injections of high doses of the melanocortin analog melanotan-II in Mc4r−/− mice reduces food intake, whereas central administration has the opposite effect (28). Moreover, melanotan-II administered peripherally poorly penetrates the central nervous system, suggesting that the site (or sites) of action may be peripheral (27, 55). Peripheral administration of melanocortin analogs also improves glucose homeostasis in Mc4r−/− mice, suggesting actions at receptors that may reside in peripheral tissues (19). The relevance of these data to our findings is, however, not clear. Future studies involving a more thorough investigation of the impact of Cre transgenes expressed in neural and non-neural tissues on the obesity syndrome observed in Mc3rTB/TB mice are clearly warranted and could yield important information on the roles of melanocortins in periphery that impact on obesity and diabetes.
VMH MC3Rs Regulate Systems Involved in Metabolic Homeostasis but Not in the Expression of Anticipatory Behaviors
Another objective was to investigate the functions of MC3R expressed in the VMH. Neurons residing in the VMH regulate appetite and protect against obesity (34, 56). As restoring expression in the nervous system had no impact on the accelerated DIO phenotype, we considered it unlikely that VMH MC3R signaling would alter the accelerated DIO phenotype associated with loss of MC3R. Our experiments therefore focused on studies using mice maintained on a low fat diet, investigating the role of VMH MC3R in the body composition phenotype and the expression of feeding-related behaviors.
The analysis of body composition and metabolic phenotype of SF1-Cre;Mc3rTB/TB mice produced two important observations. First, VMH MC3R signaling had a modest impact on fat mass and had no effect on the lean mass phenotype. This result suggests that altered body composition observed with loss of MC3R involves SF1(−ve) neurons outside the VMH. Indeed, based on our observations of Nes-Cre;Mc3rTB/TB mice, the actions of receptors expressed in the periphery may be important. Resolving this issue will require further analysis using other neuron-selective Cre transgenics that are free of the body composition phenotype observed in Nes-Cre mice. Second, the analysis of whole body energy expenditure using indirect calorimetry indicates that VMH MC3R signaling is involved in regulating metabolism. Mc3rTB/TB mice exhibited a reduction in non-resting energy expenditure, which we have observed previously in Mc3r−/− mice (5). Although the impact of Mc3rTB genotype on non-resting energy expenditure may result from reduced activity-based energy expenditure, the impact on the RER suggests that the VMH MC3Rs regulate whole body substrate preference. The impact of Mc3rTB genotype on the RER was not due to reduced food intake; food intake was not affected by genotype, and the mice all gained weight while housed in metabolic chambers. Possible factors impacting on substrate preference include impaired insulin action, indicated by hyperinsulinemia in Mc3rTB/TB mice but not in SF1-Cre;Mc3rTB/TB mice. The liver expression profile also suggests altered fatty acid metabolism in Mc3rTB/TB mice, with SF1-Cre;Mc3rTB/TB mice exhibiting a significant attenuation of this response.
Previous studies reported that the RER in Mc3r−/− mice is increased (3, 4). However, in these studies, the Mc3rTB genotype appeared to have an inhibitory effect. The reasons for this discrepancy are not clear. As discussed above, differences in food intake are not a factor. One difference between this and the reported studies is genetic background. The current study used mice on a mixed FVB;B6 background when compared with previous experiments using Mc3r−/− mice backcrossed more than seven generations onto the B6 background. The analysis of triglycerides and β-hydroxybutyrate, although displaying changes due to Mc3rTB genotype, also yielded results that were not anticipated and differed markedly from that previously reported. Again, this could be due to the effects of genetic background and/or from the state of the mice when the samples were collected (fasted versus fed). Another consideration when using genetic tools is the issue of compensation. Reactivation of MC3Rs in this model involves spatial and temporal variability in the expression of Cre recombinase. The possibility that developmental compensation has altered the timing and pattern of MC3R expression and has in some way affected the phenotype of the mice being studied cannot be excluded. Future studies may involve the use of transgenics where Cre expression can be manipulated temporally.
Finally, results from the analysis of FAA in SF1-Cre;Mc3rTB/TB mice suggest that VMH MC3R signaling is not sufficient, in of itself, to regulate the expression of this complex behavior. The attenuated expression of FAA in Mc3r−/− mice was associated with abnormal clock activity in the cortex, indicated by the analysis of clock gene expression (10). We observed that the expression of the clock gene is also altered in the cortex Mc3rTB/TB mice and in SF1-Cre;Mc3rTB/TB mice. The role of the known clock in the expression of rhythms anticipating food intake is uncertain (57). The significance of this result in explaining the FAA phenotype is thus unclear. However, it does suggest abnormal rhythmicity in the activity of clocks expressed in the cortex and suggests that this phenotype is not rescued by VMH MC3R signaling. These results, although negative, nevertheless are an important first step in mapping the MC3R-dependent neural pathways involved in the regulation of anticipatory activity.
In summary, we report the development a new genetic model for investigating of the functions of MC3Rs. We have used this model to analyze functions of MC3R expressed in SF1(+ve) neurons in the VMH. Our data suggest that the actions of MC3R in these neurons significantly impact on metabolic homeostasis but are not sufficient to restore body composition to normal or for regulating expression of complex behaviors associated with food anticipation. This strain will be important for future experiments mapping the MC3R signaling pathways in the CNS regulating the expression of food anticipatory behavior and body weight homeostasis.
Acknowledgments
We thank Dr. Ganesh Karunakaran, Ramani Singh Rasille, and Dr. Alicia Faruzzi Brantley (Murine Behavioral Assessment Core) for technical assistance. Dr. Jeffrey Zigman (UT Southwestern, Dallas, TX) provided the SF1-Cre mice.
This work was supported, in whole or in part, by National Institutes of Health Grant DK073189 (to A. A. B.). This work was also supported by a grant from the Pennington Biomedical Research Foundation (to A. A. B. and R. L. M.).
- MC3R
- melanocortin-3 receptor
- DIO
- diet-induced obesity
- VMH
- ventromedial hypothalamus
- FAA
- food anticipatory activity
- IRES
- internal ribosomal entry site
- HFD
- high fat diet
- FM
- fat mass
- FFM
- fat-free mass
- RER
- respiratory exchange ratio
- RF
- restricted feeding.
REFERENCES
- 1. Garfield A. S., Lam D. D., Marston O. J., Przydzial M. J., Heisler L. K. (2009) Trends Endocrinol. Metab. 20, 203–215 [DOI] [PubMed] [Google Scholar]
- 2. Cone R. D. (2006) Endocr. Rev. 27, 736–749 [DOI] [PubMed] [Google Scholar]
- 3. Butler A. A., Kesterson R. A., Khong K., Cullen M. J., Pelleymounter M. A., Dekoning J., Baetscher M., Cone R. D. (2000) Endocrinology 141, 3518–3521 [DOI] [PubMed] [Google Scholar]
- 4. Butler A. A. (2006) Peptides 27, 281–290 [DOI] [PMC free article] [PubMed] [Google Scholar]
- 5. Sutton G. M., Trevaskis J. L., Hulver M. W., McMillan R. P., Markward N. J., Babin M. J., Meyer E. A., Butler A. A. (2006) Endocrinology 147, 2183–2196 [DOI] [PMC free article] [PubMed] [Google Scholar]
- 6. Chen A. S., Marsh D. J., Trumbauer M. E., Frazier E. G., Guan X. M., Yu H., Rosenblum C. I., Vongs A., Feng Y., Cao L., Metzger J. M., Strack A. M., Camacho R. E., Mellin T. N., Nunes C. N., Min W., Fisher J., Gopal-Truter S., MacIntyre D. E., Chen H. Y., Van der Ploeg L. H. (2000) Nat. Genet. 26, 97–102 [DOI] [PubMed] [Google Scholar]
- 7. Ellacott K. L., Murphy J. G., Marks D. L., Cone R. D. (2007) Endocrinology 148, 6186–6194 [DOI] [PubMed] [Google Scholar]
- 8. Begriche K., Sutton G. M., Butler A. A. (2011) Physiol. Behav. 104, 546–554 [DOI] [PMC free article] [PubMed] [Google Scholar]
- 9. Sutton G. M., Begriche K., Kumar K. G., Gimble J. M., Perez-Tilve D., Nogueiras R., McMillan R. P., Hulver M. W., Tschöp M. H., Butler A. A. (2010) FASEB J. 24, 862–872 [DOI] [PMC free article] [PubMed] [Google Scholar]
- 10. Sutton G. M., Perez-Tilve D., Nogueiras R., Fang J., Kim J. K., Cone R. D., Gimble J. M., Tschöp M. H., Butler A. A. (2008) J. Neurosci. 28, 12946–12955 [DOI] [PMC free article] [PubMed] [Google Scholar]
- 11. O'Rahilly S. (2009) Nature 462, 307–314 [DOI] [PubMed] [Google Scholar]
- 12. Farooqi I. S., O'Rahilly S. (2008) Nat. Clin. Pract. Endocrinol. Metab. 4, 569–577 [DOI] [PubMed] [Google Scholar]
- 13. Perez-Tilve D., Hofmann S. M., Basford J., Nogueiras R., Pfluger P. T., Patterson J. T., Grant E., Wilson-Perez H. E., Granholm N. A., Arnold M., Trevaskis J. L., Butler A. A., Davidson W. S., Woods S. C., Benoit S. C., Sleeman M. W., DiMarchi R. D., Hui D. Y., Tschöp M. H. (2010) Nat. Neurosci. 13, 877–882 [DOI] [PMC free article] [PubMed] [Google Scholar]
- 14. Nogueiras R., Wiedmer P., Perez-Tilve D., Veyrat-Durebex C., Keogh J. M., Sutton G. M., Pfluger P. T., Castaneda T. R., Neschen S., Hofmann S. M., Howles P. N., Morgan D. A., Benoit S. C., Szanto I., Schrott B., Schürmann A., Joost H. G., Hammond C., Hui D. Y., Woods S. C., Rahmouni K., Butler A. A., Farooqi I. S., O'Rahilly S., Rohner-Jeanrenaud F., Tschöp M. H. (2007) J. Clin. Invest. 117, 3475–3488 [DOI] [PMC free article] [PubMed] [Google Scholar]
- 15. Gutiérrez-Juárez R., Obici S., Rossetti L. (2004) J. Biol. Chem. 279, 49704–49715 [DOI] [PubMed] [Google Scholar]
- 16. Obici S., Feng Z., Tan J., Liu L., Karkanias G., Rossetti L. (2001) J. Clin. Invest. 108, 1079–1085 [DOI] [PMC free article] [PubMed] [Google Scholar]
- 17. Roselli-Rehfuss L., Mountjoy K. G., Robbins L. S., Mortrud M. T., Low M. J., Tatro J. B., Entwistle M. L., Simerly R. B., Cone R. D. (1993) Proc. Natl. Acad. Sci. U.S.A. 90, 8856–8860 [DOI] [PMC free article] [PubMed] [Google Scholar]
- 18. Gantz I., Konda Y., Tashiro T., Shimoto Y., Miwa H., Munzert G., Watson S. J., DelValle J., Yamada T. (1993) J. Biol. Chem. 268, 8246–8250 [PubMed] [Google Scholar]
- 19. Kumar K. G., Sutton G. M., Dong J. Z., Roubert P., Plas P., Halem H. A., Culler M. D., Yang H., Dixit V. D., Butler A. A. (2009) Peptides 30, 1892–1900 [DOI] [PMC free article] [PubMed] [Google Scholar]
- 20. Chen A. S., Metzger J. M., Trumbauer M. E., Guan X. M., Yu H., Frazier E. G., Marsh D. J., Forrest M. J., Gopal-Truter S., Fisher J., Camacho R. E., Strack A. M., Mellin T. N., MacIntyre D. E., Chen H. Y., Van der Ploeg L. H. (2000) Transgenic Res. 9, 145–154 [DOI] [PubMed] [Google Scholar]
- 21. Marsh D. J., Hollopeter G., Huszar D., Laufer R., Yagaloff K. A., Fisher S. L., Burn P., Palmiter R. D. (1999) Nat. Genet. 21, 119–122 [DOI] [PubMed] [Google Scholar]
- 22. Heisler L. K., Jobst E. E., Sutton G. M., Zhou L., Borok E., Thornton-Jones Z., Liu H. Y., Zigman J. M., Balthasar N., Kishi T., Lee C. E., Aschkenasi C. J., Zhang C. Y., Yu J., Boss O., Mountjoy K. G., Clifton P. G., Lowell B. B., Friedman J. M., Horvath T., Butler A. A., Elmquist J. K., Cowley M. A. (2006) Neuron 51, 239–249 [DOI] [PubMed] [Google Scholar]
- 23. Marsh D. J., Miura G. I., Yagaloff K. A., Schwartz M. W., Barsh G. S., Palmiter R. D. (1999) Brain Res. 848, 66–77 [DOI] [PubMed] [Google Scholar]
- 24. Irani B. G., Xiang Z., Yarandi H. N., Holder J. R., Moore M. C., Bauzo R. M., Proneth B., Shaw A. M., Millard W. J., Chambers J. B., Benoit S. C., Clegg D. J., Haskell-Luevano C. (2011) Eur. J. Pharmacol. 660, 80–87 [DOI] [PMC free article] [PubMed] [Google Scholar]
- 25. Marks D. L., Hruby V., Brookhart G., Cone R. D. (2006) Peptides 27, 259–264 [DOI] [PMC free article] [PubMed] [Google Scholar]
- 26. Lee M., Kim A., Conwell I. M., Hruby V., Mayorov A., Cai M., Wardlaw S. L. (2008) Peptides 29, 440–447 [DOI] [PMC free article] [PubMed] [Google Scholar]
- 27. Trivedi P., Jiang M., Tamvakopoulos C. C., Shen X., Yu H., Mock S., Fenyk-Melody J., Van der Ploeg L. H., Guan X. M. (2003) Brain Res. 977, 221–230 [DOI] [PubMed] [Google Scholar]
- 28. Navarro M., Lerma-Cabrera J. M., Carvajal F., Lowery E. G., Cubero I., Thiele T. E. (2011) Alcohol Clin. Exp. Res. 35, 1058–1066 [DOI] [PMC free article] [PubMed] [Google Scholar]
- 29. Mistlberger R. E. (2011) Physiol. Behav. 104, 535–545 [DOI] [PubMed] [Google Scholar]
- 30. Blum I. D., Lamont E. W., Abizaid A. (2011) Neurosci. Biobehav. Rev., in press [DOI] [PubMed] [Google Scholar]
- 31. Balthasar N., Dalgaard L. T., Lee C. E., Yu J., Funahashi H., Williams T., Ferreira M., Tang V., McGovern R. A., Kenny C. D., Christiansen L. M., Edelstein E., Choi B., Boss O., Aschkenasi C., Zhang C. Y., Mountjoy K., Kishi T., Elmquist J. K., Lowell B. B. (2005) Cell 123, 493–505 [DOI] [PubMed] [Google Scholar]
- 32. Tronche F., Kellendonk C., Kretz O., Gass P., Anlag K., Orban P. C., Bock R., Klein R., Schütz G. (1999) Nat. Genet. 23, 99–103 [DOI] [PubMed] [Google Scholar]
- 33. Kim K. W., Zhao L., Donato J., Jr., Kohno D., Xu Y., Elias C. F., Lee C., Parker K. L., Elmquist J. K. (2011) Proc. Natl. Acad. Sci. U.S.A. 108, 10673–10678 [DOI] [PMC free article] [PubMed] [Google Scholar]
- 34. Kim K. W., Sohn J. W., Kohno D., Xu Y., Williams K., Elmquist J. K. (2011) Mol. Cell Endocrinol. 336, 219–223 [DOI] [PMC free article] [PubMed] [Google Scholar]
- 35. Dhillon H., Zigman J. M., Ye C., Lee C. E., McGovern R. A., Tang V., Kenny C. D., Christiansen L. M., White R. D., Edelstein E. A., Coppari R., Balthasar N., Cowley M. A., Chua S., Jr., Elmquist J. K., Lowell B. B. (2006) Neuron 49, 191–203 [DOI] [PubMed] [Google Scholar]
- 36. Liu P., Jenkins N. A., Copeland N. G. (2003) Genome Res. 13, 476–484 [DOI] [PMC free article] [PubMed] [Google Scholar]
- 37. Scarlett J. M., Jobst E. E., Enriori P. J., Bowe D. D., Batra A. K., Grant W. F., Cowley M. A., Marks D. L. (2007) Endocrinology 148, 4217–4225 [DOI] [PubMed] [Google Scholar]
- 38. Lakso M., Pichel J. G., Gorman J. R., Sauer B., Okamoto Y., Lee E., Alt F. W., Westphal H. (1996) Proc. Natl. Acad. Sci. U.S.A. 93, 5860–5865 [DOI] [PMC free article] [PubMed] [Google Scholar]
- 39. Briancon N., McNay D. E., Maratos-Flier E., Flier J. S. (2010) Diabetes 59, 3074–3084 [DOI] [PMC free article] [PubMed] [Google Scholar]
- 40. Butler A. A., Kozak L. P. (2010) Diabetes 59, 323–329 [DOI] [PMC free article] [PubMed] [Google Scholar]
- 41. Kaiyala K. J., Schwartz M. W. (2011) Diabetes 60, 17–23 [DOI] [PMC free article] [PubMed] [Google Scholar]
- 42. Elia M., Livesey G. (1988) Am. J. Clin. Nutr. 47, 591–607 [DOI] [PubMed] [Google Scholar]
- 43. Albarado D. C., McClaine J., Stephens J. M., Mynatt R. L., Ye J., Bannon A. W., Richards W. G., Butler A. A. (2004) Endocrinology 145, 243–252 [DOI] [PubMed] [Google Scholar]
- 44. Marks D. L., Butler A. A., Turner R., Brookhart G., Cone R. D. (2003) Endocrinology 144, 1513–1523 [DOI] [PubMed] [Google Scholar]
- 45. Perlemuter G., Bigorgne A., Cassard-Doulcier A. M., Naveau S. (2007) Nat. Clin. Pract. Endocrinol. Metab. 3, 458–469 [DOI] [PubMed] [Google Scholar]
- 46. Hotamisligil G. S., Erbay E. (2008) Nat. Rev. Immunol. 8, 923–934 [DOI] [PMC free article] [PubMed] [Google Scholar]
- 47. Rossi J., Balthasar N., Olson D., Scott M., Berglund E., Lee C. E., Choi M. J., Lauzon D., Lowell B. B., Elmquist J. K. (2011) Cell Metab. 13, 195–204 [DOI] [PMC free article] [PubMed] [Google Scholar]
- 48. Zhang Y., Kilroy G. E., Henagan T. M., Prpic-Uhing V., Richards W. G., Bannon A. W., Mynatt R. L., Gettys T. W. (2005) FASEB J. 19, 1482–1491 [DOI] [PubMed] [Google Scholar]
- 49. Gong J., Sun Z., Li P. (2009) Curr. Opin. Lipidol. 20, 121–126 [DOI] [PubMed] [Google Scholar]
- 50. Greenberg A. S., Coleman R. A., Kraemer F. B., McManaman J. L., Obin M. S., Puri V., Yan Q. W., Miyoshi H., Mashek D. G. (2011) J. Clin. Invest. 121, 2102–2110 [DOI] [PMC free article] [PubMed] [Google Scholar]
- 51. Humphreys M. H., Ni X. P., Pearce D. (2011) Eur. J. Pharmacol. 660, 43–52 [DOI] [PMC free article] [PubMed] [Google Scholar]
- 52. Getting S. J. (2006) Pharmacol. Ther. 111, 1–15 [DOI] [PubMed] [Google Scholar]
- 53. Weisberg S. P., Hunter D., Huber R., Lemieux J., Slaymaker S., Vaddi K., Charo I., Leibel R. L., Ferrante A. W., Jr. (2006) J. Clin. Invest. 116, 115–124 [DOI] [PMC free article] [PubMed] [Google Scholar]
- 54. Stienstra R., Joosten L. A., Koenen T., van Tits B., van Diepen J. A., van den Berg S. A., Rensen P. C., Voshol P. J., Fantuzzi G., Hijmans A., Kersten S., Müller M., van den Berg W. B., van Rooijen N., Wabitsch M., Kullberg B. J., van der Meer J. W., Kanneganti T., Tack C. J., Netea M. G. (2010) Cell Metab. 12, 593–605 [DOI] [PMC free article] [PubMed] [Google Scholar]
- 55. Hatziieremia S., Kostomitsopoulos N., Balafas V., Tamvakopoulos C. (2007) Rapid Commun. Mass Spectrom. 21, 2431–2438 [DOI] [PubMed] [Google Scholar]
- 56. King B. M. (2006) Physiol. Behav. 87, 221–244 [DOI] [PubMed] [Google Scholar]
- 57. Storch K. F., Weitz C. J. (2009) Proc. Natl. Acad. Sci. U.S.A. 106, 6808–6813 [DOI] [PMC free article] [PubMed] [Google Scholar]