Background: The operon structure of the C. elegans genome was used to identify functional interaction partners for the chloride channel ICln.
Results: Human ICln and HSPC038 functionally interact, and this interaction between the two proteins was also identified on a molecular level.
Conclusion: The functional interaction between ICln and HSPC038 modulates the regulation of the cellular volume.
Significance: The operon structure of the C. elegans genome can be used to identify unknown interaction partners including those of membrane proteins, and the summarized experiments provide further insight into the interactome of the connector hub ICln.
Keywords: Chloride Transport, Gene Regulation, Membrane, Protein Assembly, Protein Translocation
Abstract
Identifying functional partners for protein/protein interactions can be a difficult challenge. We proposed the use of the operon structure of the Caenorhabditis elegans genome as a “new gene-finding tool” (Eichmüller, S., Vezzoli, V., Bazzini, C., Ritter, M., Fürst, J., Jakab, M., Ravasio, A., Chwatal, S., Dossena, S., Bottà, G., Meyer, G., Maier, B., Valenti, G., Lang, F., and Paulmichl, M. (2004) J. Biol. Chem. 279, 7136–7146) that could be functionally translated to the human system. Here we show the validity of this approach by studying the predicted functional interaction between ICln and HSPC038. In C. elegans, the gene encoding for the ICln homolog (icln-1) is embedded in an operon with two other genes, Nx (the human homolog of Nx is HSPC038) and Ny. ICln is a highly conserved, ubiquitously expressed multifunctional protein that plays a critical role in the regulatory volume decrease after cell swelling. Following hypotonic stress, ICln translocates from the cytosol to the plasma membrane, where it has been proposed to participate in the activation of the swelling-induced chloride current (IClswell). Here we show that the interaction between human ICln and HSPC038 plays a role in volume regulation after cell swelling and that HSPC038 acts as an escort, directing ICln to the cell membrane after cell swelling and facilitating the activation of IClswell. Assessment of the NMR structure of HSPC038 showed the presence of a zinc finger motif. Moreover, NMR and additional biochemical techniques enabled us to identify the putative ICln/HSPC038 interacting sites, thereby explaining the functional interaction of both proteins on a molecular level.
Introduction
ICln (nucleotide-sensitive chloride current-inducing protein) is a highly conserved, ubiquitously expressed protein cloned from an epithelial canine cell line (1). A variety of studies have identified ICln as an important player in regulatory volume decrease, the process that enables a cell to regain its original volume after swelling (2–4). Overexpression of ICln in Xenopus laevis oocytes (1) or in mammalian cells (5, 6) is followed by the up-regulation of chloride currents resembling those elicited by cell swelling (IClswell)6 (2, 7, 8). Furthermore, ICln-specific antibodies (9) or antisense oligodeoxynucleotides (10, 11) leading to a specific knockdown of ICln protein expression impair regulatory volume decrease in native cells. ICln is water-soluble, and in isotonic conditions the majority of the protein is located within the cytosol, whereas only a small fraction is associated with the cell membrane; nevertheless, ICln transposes from the cytosol to the cell membrane in hypotonic conditions (12–16). These studies suggest that ICln could be a molecular entity or part of the molecular arrangement determining IClswell. This hypothesis was challenged by others (17, 18); however, it is further supported because (i) purified ICln can induce ion channel activity following insertion into artificial lipid bilayers from aqueous solutions (5, 19–22), and (ii) the ion permeability observed in the presence of purified ICln protein in the extracellular solution of NIH 3T3 fibroblasts (15) and Sf9 insect cells (22) is increased. Detailed studies revealed additional functions of ICln in addition to its role in regulatory volume decrease, i.e. regulation of cellular morphology (23), platelet activation (24), angiogenesis (25), cell migration (26), and RNA processing (27). The role of ICln in the different functional modules was recognized either by observing a special phenotype (i.e. ion currents across the membrane) or by identifying its specific interactome using biochemical methods (28). So far, a variety of proteins within different cellular compartments have been identified to interact with ICln (28). For this, different “tools” were used to screen for partner proteins, i.e. yeast two-hybrid system, coimmunoprecipitation, affinity assays (28), and FRET (16). Because of the lack of more “rational” tools to identify functional protein partners, we set out to utilize the operon structure of the Caenorhabditis elegans genome to prospectively predict functionally interacting protein partners (29). We successfully used this approach for the first time and identified two possible protein partners of ICln (icln-1), i.e. Nx (CO1F6.9) and Ny (lpl-1) (5, 28–30). The human homolog of Nx is HSPC038, a small (molecular mass = 8498 Da), basic (pI = 10.02), hydrophilic protein whose function was unknown. We observed that as a consequence of coreconstituting Nx together with the IClnN2 splice variant in artificial lipid membranes, the current induced by IClnN2 was no longer voltage-sensitive, thereby revealing a functional interaction between the two C. elegans proteins (5). Nx and its human homolog HSPC038 have a similar amino acid sequence (29). However, in contrast to the nematode system, the human ICln (CLNS1A, chromosome 11, position 11q13.5) and HSPC038 (chromosome 8, position 8q22.3) genes are not in close genomic proximity to each other, and no data in the literature suggested an interaction between the corresponding proteins. Nevertheless, as our data show, both human gene products establish a molecular interaction in vivo similarly to the C. elegans counterparts. These findings underscore the use of the operon structure of the nematode genome as an extremely powerful tool for the identification of partner proteins, which can be successfully translated to the human system.
EXPERIMENTAL PROCEDURES
Cloning Procedures and Plasmid Constructs
The ORFs of full-length HSPC038 and ICln were amplified by PCR using standard protocols. The PCR products were cloned in frame into the mammalian expression vectors pECFPC1, pEYFPC1, pECFPN1, or pEYFPN1 (Clontech) to produce fusion proteins suitable for FRET experiments.
For electrophysiology experiments, HSPC038 and ICln ORFs were cloned into the bicistronic mammalian expression vector pIRES2-EGFP (Clontech). Control experiments were conducted in cells transfected with the pIRES2-EGFP-EGFP vector, where an additional EGFP coding sequence was cloned into the pIRES2-EGFP (Clontech) expression vector. Consequently, a single control vector contains two EGFP coding sequences (one in the multiple cloning site and one downstream of the IRES sequence). For electrophysiology experiments where HSPC038-ICln dimerization was drug-induced, the HSPC038 ORF was subcloned into the pC4-RHE vector (ARGENTTM-regulated heterodimerization kit, version 2.0; Ariad Pharmaceuticals, Cambridge, MA; now iDimerize, Clontech). Then the HSPC038-FRB or FRB-HSPC038 coding sequences were subcloned into the pIRES2dsREDexpress vector (Clontech). The final constructs allowed for the coexpression of the dsREDexpress protein with either (i) HSPC038 with the FRB domain fused to the C terminus (HSPC038-FRB) or (ii) HSPC038 with the FRB domain fused to the N terminus (FRB-HSPC038). A similar procedure was adopted for ICln: the ICln ORF was subcloned into the pC4EN-F1 and pC4M-F2E vectors and then into pIRES2-EGFP. The final constructs allowed for the coexpression of the EGFP protein with either (i) ICln with a single FKBP domain fused to the C terminus (ICln-FKBP) or (ii) ICln with two FKBP domains fused to the C terminus and a myristoylation sequence fused to the N terminus (myr-ICln-FKBP-FKBP). The myristoylation sequence enabled the fusion protein to be targeted to the plasma membrane. The use of vectors bearing the internal ribosome entry site (IRES) allows for the simultaneous expression of two individual proteins (HSPC038 or ICln and EGFP or the dsRedExpress protein) from a single bicistronic mRNA without the production of fusion proteins (31). Therefore, because EGFP or dsRedExpress expression occurs only if preceded by HSPC038 or ICln expression, the single transfected cells can be individuated optically by detecting the fluorescent light emitted by EGFP (excitation maximum, 488 nm; emission maximum, 507 nm) or dsRedExpress (excitation maximum, 557 nm; emission maximum, 579 nm). HSPC038 was also cloned into the mammalian expression plasmid pFLAG-CMV4 (Sigma) for overexpression of the N-terminally FLAG (DYKDDDDK)-tagged protein.
For protein purification, the ORFs of ICln and its deletion mutants (19, 32), as well as HSPC038, were cloned in frame with a hexahistidine tag (coding for MHHHHHHLE) into the bacterial expression vector pET3-His (33), allowing for the expression of N-terminal His6-tagged proteins in Escherichia coli strains. All of the plasmid inserts were sequenced prior to use in experiments (Microsynth AG).
Cell Culture and Transient Transfection
Standard procedures were utilized for culturing the respective cells and for transfection. A detailed description of the procedures is given in the supplemental materials.
Patch Clamp Recordings
HEK293 Phoenix cells were transfected with the bicistronic mammalian expression vector pIRES2-EGFP coding for EGFP only (controls; pIRES2-EGFP-EGFP) or EGFP and ICln (or EGFP and HSPC038) as separate proteins. Single cells expressing EGFP were selected by fluorescence microscopy and voltage-clamped using the whole cell patch clamp technique. The resistance of the glass pipettes was 3–8 MΩ when filled with the pipette solution (125 mm CsCl, 5 mm MgCl2, 11 mm EGTA, 50 mm raffinose, 2 mm ATP, 10 mm HEPES, pH 7.2 (adjusted with CsOH)). The hypertonic bath solution was composed of 125 mm NaCl, 2.5 mm CaCl2, 2.5 mm MgCl2, 10 mm HEPES, 100 mm mannitol, pH 7.4 (adjusted with NaOH). Fast exchange of the hypertonic bath solution with a hypotonic bath solution (125 mm NaCl, 2.5 mm CaCl2, 2.5 mm MgCl2, 10 mm HEPES, pH 7.4) was obtained using a perfusion system with a flow rate of 5 ml/min and a bath volume of ∼300 μl. For the experiments where purified proteins were added to the pipette filling (intracellular) solution, 15 μg/ml ICln (0.57 μm), 15 μg/ml HSPC038 (1.76 μm), or equimolar amounts of ICln and HSPC038 (1.76 μm each, 46 μg/ml and 15 μg/ml, respectively; the use of equimolar amount of proteins does not imply a 1:1 stoichiometry of the putative ICln-HSPC038 complex) were used. For the control experiments, an adequate volume of the appropriate elution buffer was added to the pipette filling solution. The diffusion of substances from the pipette filling solution to the intracellular milieu was verified with 10 μg/ml fluorescent dextrans (molecular mass = 40,000 Da; Molecular Probes) after the establishment of the whole cell configuration. All of the experiments were carried out at room temperature. Additional details regarding data acquisition are given in the supplemental materials.
FRET Measurements
FRET studies were performed as described earlier (15). Briefly, the cells were double transfected with pECFP-mem (Clontech) and pEYFPN1-HSPC038 or pECFPN1-ICln and pEYFPN1-HSPC038. Transfected cells were perfused at room temperature with an isotonic solution containing 90 mm NaCl, 5 mm KCl, 2 mm CaCl2, 2 mm MgCl2, 5 mm glucose, 80 mm mannitol, 10 mm HEPES, pH 7.4). After recording the fluorescent signals under isotonic conditions, the cells were perfused with a hypotonic solution (90 mm NaCl, 5 mm KCl, 2 mm CaCl2, 2 mm MgCl2, 5 mm glucose, 10 mm HEPES, pH 7.4), and ECFP, EYFP, and FRET images were recorded after 5, 15, and 30 min following hypotonic shock. Additional details are given in the supplemental materials.
Protein Expression and Purification
All of the proteins were overexpressed as N-terminal His6-tagged fusion proteins in E. coli BL21 (DE3) or BL21 (DE3) pLys bacteria. Bacterial cells were grown in LB medium at 37 °C until an A600 of 0.8. Protein overexpression was induced by adding isopropyl-1-thio-β-d-galactopyranoside to the bacterial culture to a final concentration of 0.3 mm. Bacterial cells were harvested 4 h after induction. His6-tagged fusion proteins were purified using standard protocols described in detail in the supplemental materials.
Native PAGE Experiments
50 μg of purified recombinant HSPC038, 50 μg of ICln, or a mixture of the two proteins were incubated in a buffer containing 25 mm K2HPO4, 150 mm NaCl, 5% glycerol, pH 7.2, for 2 h at 4 °C and subsequently separated on 10% native PAGE gels.
Affinity Chromatography Experiments
Purified recombinant HSPC038 was coupled to CNBr-activated Sepharose 4B beads (Sigma) according to the manufacturer's instructions. Control beads were prepared by coupling ethanolamine instead of protein to CNBr-activated Sepharose 4B beads. Aliquots of either HSPC038-coupled resin or control beads were then incubated with purified ICln or its mutants (final concentration, 1 mg/ml) in a buffer containing 25 mm MOPS, 150 mm NaCl, pH 7.2, for 2 h at 4 °C. After extensive washing, bound ICln proteins were eluted by low pH buffer (500 mm Tris, pH 2.5), and elution fractions were neutralized by the addition of 500 mm Tris, pH 8.0, and then separated by SDS-PAGE.
NMR Spectroscopy
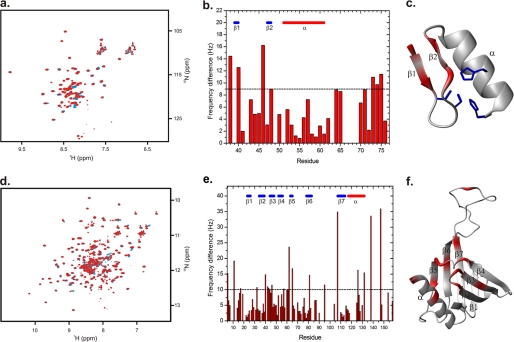
All of the NMR experiments were acquired at 25 °C on a Bruker DRX 600 MHz spectrometer equipped with a 5-mm triple resonance z-gradient cryoprobe. NMR data were processed and visualized using the NMRPipe software (34) and ANSIG for Windows (35). Resonance assignments of HSPC038 was accomplished with three-dimensional 15N NOESY-HSQC and 15N total total correlation spectroscopy-HSQC experiments from the Bruker program library. Partial backbone resonance assignments of ICln 1–159 were made based on published assignments (36). To map the interaction interfaces upon interaction between HSPC038 and ICln 1–159, two protein samples were prepared: one with 15N labeled HSPC038 (0.8 mm) and unlabeled ICln 1–159 (0.9 mm), and the second with 15N-labeled ICln 1–159 (1 mm) and unlabeled HSPC038 (3 mm). The chemical shift perturbations following complex formation were small, and assignments of the complexes were based on the assignments of the free proteins. Perturbations in resonance frequency (Δν) resulting from complex formation was analyzed using Equation 1,
 |
where ΔνH and ΔνN are perturbations in 1H and 15N resonance frequency, respectively.
Homology Modeling of the HSPC038 Zinc Finger Motif
A homology model of the zinc finger motif of HSPC038 was generated with Swiss model (37, 38) using the first zinc finger motif of conformer number one in Protein Data Bank code 2GHF as the template.
RNA Interference
siRNAs for knocking down the expression of HSPC038 (core sequence: 5′-GAA ACA AGG ACA UGA CCA A-3′) were designed with the siRNA Design Tool of Microsynth CH. HEK293 Phoenix cells seeded into Ø 30-mm Petri dishes were transfected with 180 pmol of siRNAs and 12 μl of Metafectene SI (Biontex) following the manufacturer's instruction. Control cells were transfected with the following negative control siRNA (Microsynth CH): 5′-AGGUAGUGUAAUCGCCUUG-3′. Functional (patch clamp) or expression (semiquantitative reverse transcription-PCR) assays were performed 48–56 h after transfection.
Semiquantitative Reverse Transcription-PCR
Extraction of total RNA was performed with the All Prep DNA/RNA mini kit (Qiagen). 1 μg of total RNA was used for the reverse transcription reaction with the QuantiTect® reverse transcription kit for cDNA synthesis with integrated removal of genomic DNA contamination (Qiagen). For detecting the HSPC038 transcript, the following primers were used: forward, 5′-CGT GGA CAG CAG AAG ATT CAG-3′; and reverse, 5′-AGT GGA GCT TTA GGG TGC TTG-3′. The HSPC038 signal was normalized to the β-actin signal, detected by using the following primers: forward, 5′-GGCATGGGTCAGAAGGATTC-3′; and reverse, 5′-AGAGGCGTACAGGGATAGCAC-3′. These primers span an intron-exon boundary and would disclose an eventual contamination from genomic DNA as a band at 700 bp, which was not detected (see Fig. 8a). Densitometric analysis was done with the ImageJ 1.38x program.
FIGURE 8.
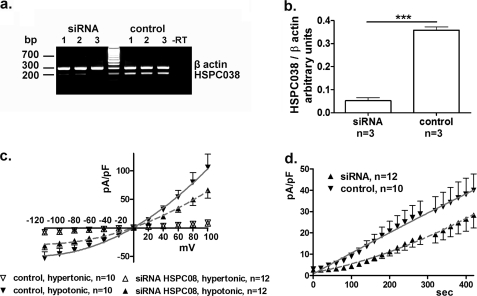
HSPC038 knockdown impairs IClswell. HSPC038 knockdown was realized by using specific siRNAs in HEK293 Phoenix cells. a, the levels of the transcripts of HSPC038 and of the housekeeping gene β-actin were detected by RT-PCR in three independent samples of siRNA or control-siRNA (control)-treated cells. −RT, as a control, the PCR was conducted on a sample of total RNA that was not subjected to the reverse transcription reaction, to exclude genomic DNA contamination. b, densitometric analysis of the HSPC038 signal normalized to the β-actin signal. ***, p < 0.001 between siRNA-treated cells and control siRNA-treated cells, unpaired t test. IClswell activation was monitored after hypotonic shock in siRNA-treated cells or in control cells. c and d, the experiments were done in the whole cell configuration; the current density-to-voltage (c) and the current density-to-time (d) relationships are shown. The data were fitted with second order polynomials following application of the extra sum of squares F test (c and d: siRNA versus control: p < 0.0001).
Western Blot
Standard protocols described in detail in the supplemental materials were used.
Salts, Chemicals, and Drugs
All salts and chemicals used were of “pro analysis” grade.
Statistical Analysis
All of the data are expressed as arithmetic means ± S.E. For statistical analysis, GraphPad Prism software (version 4.00 for Windows; GraphPad Software, San Diego, CA) was used. Significant differences between means were tested by paired Student's t test or ANOVA. Statistically significant differences were assumed at p < 0.05 (*, p < 0.05; **, p < 0.01; ***, p < 0.001); n corresponds to the number of independent experiments. The current density-to-time and current density-to-voltage relationships were fitted with second order polynomials (Y = A + BX + CX2). For detecting significant differences between those data, the extra sum of squares F test was applied. Statistically significant differences were assumed at p < 0.01.
RESULTS
ICln or HSPC038 Overexpression Activates IClswell
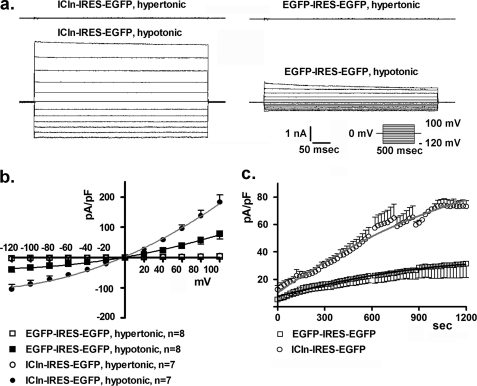
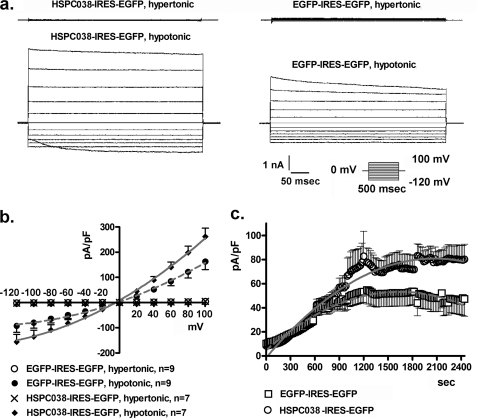
As previously described for the C. elegans IClnN1 (5), the expression of the human ICln isoform in HEK293 Phoenix cells also leads to an increased IClswell (Fig. 1). Cells were transiently transfected with either the pIRES2-EGFP vector encoding for ICln or with the control vector pIRES2-EGFP-EGFP; for electrophysiological measurements, cells were initially kept in extracellular hypertonic solution. After the seal was realized and the whole cell configuration was obtained, IClswell activation was monitored following reduction of the extracellular osmolarity by 100 mm via omission of mannitol. Hypotonic shock induced the activation of a large chloride current with the biophysical fingerprints of IClswell (outward rectification, slow voltage- and time-dependent inactivation at positive potentials; Fig. 1a) in both control and ICln-overexpressing cells. The current density-to-voltage (Fig. 1b) relation determined after a 10-min exposure to extracellular hypotonic solution and the current density-to-time relation (Fig. 1c) both showed a higher increase of IClswell in ICln-overexpressing cells with respect to the control cells (p < 0.0001). A similar effect was observed in cells overexpressing HSPC038 (Fig. 2). The current density-to-voltage relation (Fig. 2b) measured at the maximal current activation and the current density-to-time relation (Fig. 2c) both clearly show that IClswell was increased in HSPC038 transfected cells with respect to the control cells (p < 0.0001). It is important to mention that the described experiments were conducted on single transfected cells selected by detecting the EGFP fluorescence; the constructs used allow the simultaneous expression of the protein of interest (ICln or HSPC038) and EGFP as separate proteins in the same cell; EGFP expression can only occur if ICln or HSPC038 is also expressed.
FIGURE 1.
ICln overexpression increases IClswell. IClswell activation was monitored in HEK293 Phoenix overexpressing both ICln and the transfection marker EGFP as separate proteins. Experiments were done in whole cell configuration. a, original recordings obtained in hypertonic (upper traces) or hypotonic conditions (lower traces) in ICln transfected (ICln-IRES-EGFP) or control (EGFP-IRES-EGFP) cells with voltage increments of 20 mV from −120 to +100 mV applied at a holding potential of 0 mV. b and c, the current density-to-voltage relationship measured 10 min following hypotonic shock (b) and the current density-to-time relationship (c) show up-regulation of IClswell. The data were fitted with second order polynomials following application of the extra sum of squares F test (EGFP-IRES-EGFP versus ICln-IRES-EGFP: p < 0.0001).
FIGURE 2.
HSPC038 overexpression increases IClswell. IClswell activation was monitored in HEK293 Phoenix cells overexpressing both HSPC038 and the transfection marker EGFP as separate proteins. Experiments were done in the whole cell configuration. a, original recordings obtained in hypertonic (upper traces) or hypotonic conditions (lower traces) in HSPC038 transfected (HSPC038-IRES-EGFP) or control (EGFP-IRES-EGFP) cells with voltage increments of 20 mV from −120 to +100 mV applied at a holding potential of 0 mV. b and c, the current density-to-voltage (b) and the current density-to-time relationships (c) showing an up-regulation of IClswell. The data were fitted with second order polynomials following application of the extra sum of squares F test (EGFP-IRES-EGFP versus HSPC038-IRES-EGFP in hypertonicity: not significant; in hypotonicity: p < 0.0001).
Purified ICln and/or HSPC038 Protein Activates IClswell
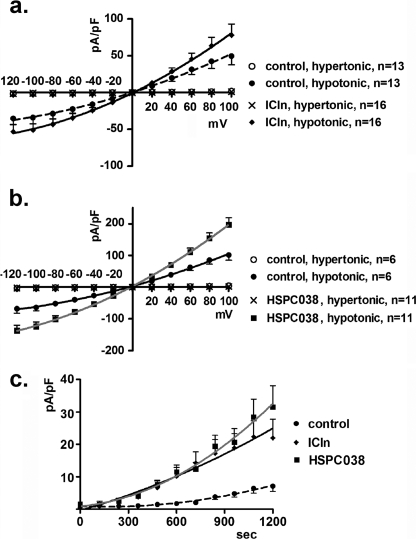
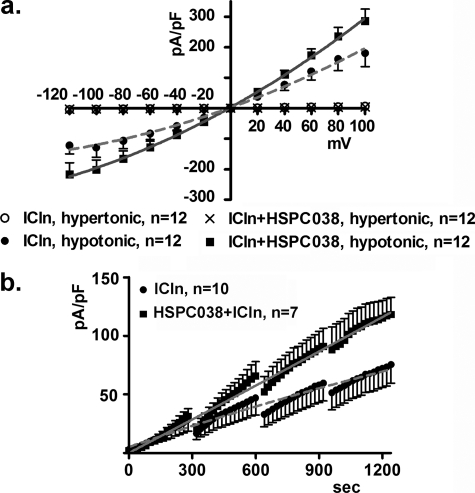
Similar experiments were performed in which purified ICln or HSPC038 proteins were added to the pipette filling solution (after establishing whole cell configuration, the purified protein will access the intracellular space). For these experiments, nontransfected cells were used. IClswell activation was elicited and measured as previously described. The current density-to-voltage relation was measured at the maximal current activation with either purified ICln (15 μg/ml; Fig. 3a) or purified HSPC038 (15 μg/ml; Fig. 3b). These data and the respective current density-to-time relations (Fig. 3c) show a clear current increase with respect to the control (p < 0.0001). Control experiments were done by addition of an appropriate volume of vehicle (immobilized metal ion affinity chromatography elution buffer) to the pipette solution. Patch clamp experiments were also performed in which both purified ICln and HSPC038 proteins (in an equimolar concentration of 1.76 μm each) were added to the pipette filling solution (native cells were used). IClswell activation was elicited and measured as already described. The current density-to-voltage relation determined 15 min after the establishment of hypotonic conditions (Fig. 4a), and the respective current density-to-time relations (Fig. 4b) clearly show that in the presence of both ICln and HSPC038 in the pipette solution, IClswell activation was higher compared with the addition of ICln alone (p < 0.0001).
FIGURE 3.
Purified ICln or HSPC038 increase IClswell. IClswell activation was monitored in HEK293 Phoenix cells in the whole cell patch clamp configuration. The current density-to-voltage relationships of IClswell (at maximal activation) measured with 15 μg/ml of purified ICln (0.57 μm) (a) or HSPC038 (1.76 μm) (b) in the pipette filling (intracellular) solution and the respective current density-to-time graph (c) are shown. The data were fitted with second order polynomials following application of the extra sum of squares F test (ICln versus control or HSPC038 versus control: p < 0.0001).
FIGURE 4.
Purified ICln and HSPC038 increase IClswell. IClswell activation was monitored in HEK293 Phoenix cells in the whole cell patch clamp configuration. The current density-to voltage relationship (15 min after hypotonic shock) (a) and the respective current density-to-time graph (b) of IClswell were measured with 1.76 μm of purified ICln alone or with an equimolar (1.76 μm each) amount of both ICln and HSPC038 proteins in the pipette filling solution. The data were fitted with second order polynomials following application of the extra sum of squares F test (ICln and HSPC038 versus ICln alone: p < 0.0001).
HSPC038 Interacts with ICln in Vitro
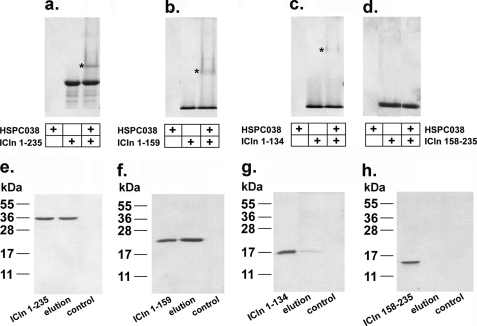
To assess whether HSPC038 can interact with ICln and to identify the potential ICln binding site for HSPC038, native PAGE experiments were performed (Fig. 5, a–d). Purified recombinant ICln or ICln truncation mutants were incubated with purified recombinant HSPC038 (see “Experimental Procedures”) and separated by native PAGE. HSPC038 is a basic protein that migrates toward the cathode and does not enter the gel matrix; it will only enter the gel if it is bound to a negatively charged protein (for example, ICln). Thus, a band of a higher molecular mass with respect to ICln can appear only when an interaction between the two proteins occurs and therefore indicates the presence of a complex. A complex was detected for full-length ICln (ICln 1–235) and ICln 1–159, (Fig. 5, a and b), but not for ICln 158–235 (Fig. 5d). HSPC038 bound only weakly to ICln 1–134 (Fig. 5c). These results indicate that the main binding site(s) for HSPC038 on ICln are located between residues 1 and 159. The interaction between HSPC038 and ICln or its truncation mutants was also studied by affinity chromatography (Fig. 5, e–h). Purified HSPC038 was coupled to CNBr-activated Sepharose 4B beads (see “Experimental Procedures”) and then incubated with ICln or its truncation mutants; eluates were then subjected to SDS-PAGE. HSPC038 interacted with full-length ICln (ICln 1–235) and ICln 1–159 and showed a faint interaction with ICln 1–134 (Fig. 5, e–g) but not with ICln 158–235 (Fig. 5h). The weak interaction of HSPC038 for ICln 1–134 compared with the strong interaction for ICln 1–159 suggests that the region 135–159 is important for complex formation, although the main interacting sites are located upstream. ICln 116–235 still shows a good interaction with HSPC038, whereas ICln 135–235 only shows a weak interaction (supplemental Fig. S1). Because ICln 158–235 does not show any interaction, we conclude that the amino acids 135–159 have a role in stabilizing the ICln-HSPC038 complex.
FIGURE 5.
Molecular interaction between ICln and HSPC038. For each panel, HSPC038, ICln and its truncation mutants or a mix of HSPC038 and ICln or its truncation mutants separated by native PAGE are shown in the first, second, and third lanes, respectively. A band of higher molecular mass (asterisk), indicating the presence of a complex between ICln and HSPC038, was detected for full-length ICln (ICln 1–235, n = 5) (a), ICln 1–159 (n = 5) (b), and ICln 1–134 (n = 4) (c), but not for ICln 158–235 (n = 2) (d). Affinity chromatography eluates separated by SDS-PAGE of ICln 1–235 (e), ICln 1–159 (f), ICln 1–134 (g), and ICln 158–235 (h). For each panel, first lane, input; second lane, elution; and third lane, control (i.e. the elution fraction from beads with no HSPC038 bound to the resin). The presence of a band in the elution fraction indicates that full-length ICln or its truncation mutants interacted with HSPC038. No interaction was detected for ICln 158–235 (h); 2 ≤ n ≤ 4.
Hypotonic Shock Induces HSPC038 Translocation toward the Cell Membrane in Spatial Proximity to ICln
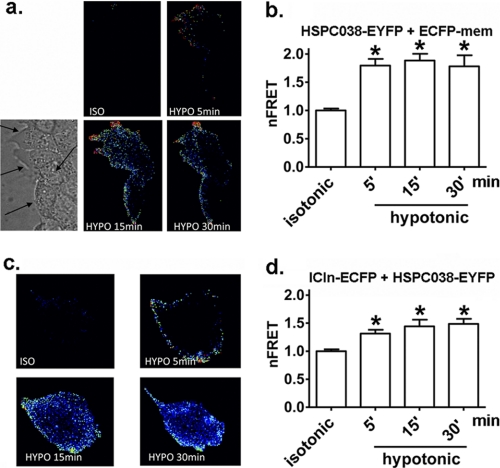
Knowing that (i) the ICln and HSPC038 homologs of C. elegans are able to establish a functional interaction in vitro (5), (ii) human ICln and HSPC038 establish a molecular interaction in vitro (see above) and in vivo under isotonic conditions (29), and (iii) ICln translocates to the cell membrane after hypotonic shock (12–16), we asked whether (i) HSPC038 also translocates to the cell membrane following hypotonic shock and (ii) the interaction between ICln and HSPC038 is influenced by hypotonicity. For this reason, we initiated FRET experiments in principal collecting duct M1 cells transfected with HSPC038 and a membrane label (pECFP-mem; Fig. 6, a and b) or ICln and HSPC038 (Fig. 6, c and d) cloned in the suitable vectors for FRET (15). Fig. 6a shows that the FRET signal between HSPC038 and the membrane label pECFP-mem significantly increased after hypotonic shock (the data are normalized for the FRET emission determined in isotonic conditions; the normalized netFRET was 1.00 ± 0.03 in isotonic conditions, 1.79 ± 0.11 5 min after hypotonic conditions were established, 1.88 ± 0.12 after 15 min, and 1.78 ± 0.19 after 30 min, n = 28; p < 0.05; Fig. 6b). These results indicate a close proximity between HSPC038 and the membrane label in hypotonic conditions, and are therefore suggestive of a translocation of HSPC038 toward the plasma membrane after hypotonic shock. Fig. 6c shows that the FRET signal between HSPC038 and ICln significantly increased after hypotonic shock; the normalized netFRET was: 1.00 ± 0.03 in isotonic conditions, 1.31 ± 0.07 5 min after hypotonic conditions were established, 1.44 ± 0.12 after 15 min and 1.49 ± 0.09 after 30 min, n = 27 (p < 0.05; Fig. 6d). These results suggest that the interaction between HSPC038 and ICln significantly increases after hypotonic shock. The presence of the fluorescent tags used for the FRET experiments (small hydrophilic proteins) do not influence the subcellular localization and redistribution of ICln after hypotonic shock (13–15).
FIGURE 6.
FRET between HSPC038 and the plasma membrane and between HSPC038 and ICln following hypotonic shock. a, FRET signal in principal collecting duct M1 cells transfected with the HSPC038-EYFP fusion protein and a membrane label (ECFP-mem) in isotonic conditions and after 5, 15, and 30 min of hypotonic shock; the lower left panel shows the transmission image of the same cells as indicated by the arrows. b, netFRET normalized to the value measured in isotonic conditions (netFRET, nFRET); summary of the experiments shown in a; n = 28. *, p < 0.05 versus isotonic. The data were statistically analyzed by a one-way ANOVA test followed by Tukey's multiple comparison test. c, FRET signal in cells transfected with the HSPC038-EYFP and ICln-ECFP fusion proteins in isotonic conditions and after 5, 15, and 30 min of hypotonic shock. d, netFRET; summary of the experiments shown in c; n = 27. *, p < 0.05 versus isotonic, Student's t test. n indicates the number of cells.
HSPC038 Improves the Translocation of ICln to the Cell Membrane after Hypotonic Shock
To assess whether ICln abundance at the membrane level is modified by HSPC038, Western blots were performed in total membrane protein extracts from cells transfected with HSPC038 (FLAG HSPC038) or with the empty vector (FLAG empty) in isotonic conditions (0 min) or after 5, 15, and 30 min of hypotonic shock (supplemental Fig. S2a). Densitometry of the endogenous ICln signal normalized to the Na+/K+-ATPase signal shows that, following hypotonic shock, the amount of ICln in total cell membranes was significantly higher in HSPC038 transfected cells compared with mock transfected (FLAG empty) controls (supplemental Fig. S2b; FLAG HSPC038: 0.15 ± 0.02 n = 19 (isotonic conditions, 0 min); 0.36 ± 0.07, n = 20 (5 min after hypotonic shock); 0.29 ± 0,07, n = 20 (15 min after hypotonic shock); 0.38 ± 0.09, n = 18 (30 min after hypotonic shock); FLAG empty: 0.13 ± 0.03 n = 20 (isotonic conditions, 0 min); 0.11 ± 0.02, n = 19 (5 min after hypotonic shock); 0.15 ± 0.03, n = 20 (15 min after hypotonic shock); and 0.12 ± 0.02, n = 20 (30 min after hypotonic shock); p < 0.001, two-way ANOVA).
HSPC038 Does Not Modify ICln Expression
To test whether or not the increase in IClswell measured after exogenous HSPC038 expression is induced by an increased expression of endogenous ICln, Western blots in cells transfected with HSPC038 (pIRES2-HSPC038-EGFP) or with control vectors (pIRES2-EGFP-EGFP and pIRES2-EGFP) were performed. Supplemental Fig. S3a shows the endogenous ICln expression in total cell lysates. Densitometry of the ICln signal normalized for the tubulin signal showed no statistical differences between the groups (supplemental Fig. S3b; pIRES2-HSPC038-EGFP, 1.649 ± 0.18, n = 6; pIRES2-EGFP-EGFP, 1.4 ± 0.1, n = 8; pIRES2-EGFP, 1.5 ± 0.13, n = 8; not significant versus pIRES2-HSPC038-EGFP, one-way ANOVA).
The Drug-induced HSPC038-ICln Interaction Also Activates IClswell
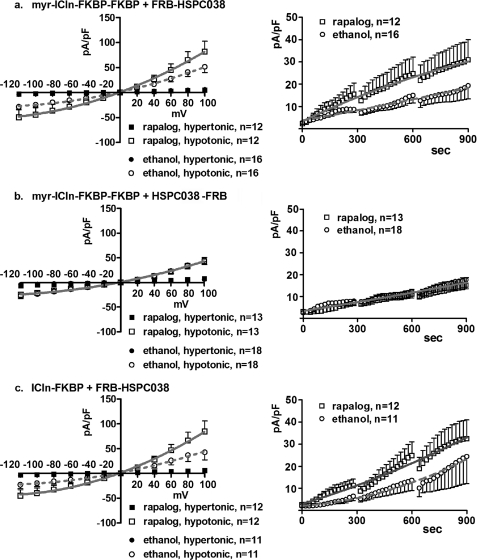
To gather more information regarding the effect of a putative ICln-HSPC038 interaction on IClswell, both proteins were expressed with epitopes suitable for inducing their dimerization following treatment with a “dimerizer” agent (rapalog; final concentration, 500 nm). ICln was fused with either one or two FK506-binding proteins (FKBP), whereas HSPC038 was fused to the PI3K homolog FRAP-binding domain (FRB). The FKBP fusion protein binds the rapalog, which in turn becomes a binding target for the FRB fusion protein. This system is based on the model of the immunosuppressive drug rapamycin that binds the intracellular FKBP and FRAP targets (39, 40). However, the FKBP and rapalog used for these studies have been engineered so that they no longer recognize either endogenous target. In Fig. 7, the IClswell current density-to-voltage relationships after 10 min of hypotonic shock (Fig. 7, left panels) and time courses (Fig. 7, right panels) are shown in cells expressing ICln with a myristoyl (membrane-targeting) tag fused to the N terminus and 2 FKBP domains fused to the C terminus (myr-ICln-FKBP-FKBP) or with one FKBP domain fused to the C terminus (ICln-FKBP) together with HSPC038 fused to one FRB domain located on either the N or C terminus (FRB-HSPC038 or HSPC038-FRB). The data show that following rapalog exposure, IClswell activation is faster when the FRB domain is fused to the N terminus of HSPC038 (p < 0.0001; Fig. 7, a and c). These experiments show that drug-induced HSPC038-ICln dimerization up-regulates IClswell, although the position (N or C terminus) of the FRB domain on HSPC038 seems to influence the effect on IClswell activation and presumably on dimerization, because no effect on IClswell was observed when the FRB domain was fused to the C terminus of HSPC038 (Fig. 7b).
FIGURE 7.
Effects of HSPC038-ICln induced dimerization on IClswell activation. IClswell activation was monitored after hypotonic shock in HEK293 Phoenix cells overexpressing HSPC038, ICln, and the transfection markers as separate proteins (EGFP and dsRed). The experiments were done in the whole cell configuration; the current density-to-voltage (left) and the current density-to-time (right) relationships are shown. ICln was expressed with one (c) or two (a and b) FKBP epitopes fused to the C terminus, with (a and b) or without (c) a myristoylation signal at the N terminus; HSPC038 was expressed with one FRB epitope fused to the N terminus (a and c) or to the C terminus (b). FKBP and FRB epitopes are suitable for inducing the heterodimerization between the two proteins following overnight incubation with the rapalog (AP21967, 500 nm). Controls were done with an appropriate amount of vehicle (ethanol). The data were fitted with second order polynomials following application of the extra sum of squares F test (a and c: rapalog versus ethanol: p < 0.0001 in hypotonicity; in hypertonicity the current measured after incubation with rapalog is not increased with respect to the current measured after incubation with ethanol; in b, no statistical differences between the two conditions were detected).
HSPC038 Knockdown Impairs IClswell
As previously described by us (41) and others (6), ICln knockdown suppress IClswell activation. Here we show that the knockdown of HSPC038 similarly leads to a decreased IClswell (Fig. 8). HSPC038 knockdown was obtained in HEK293 Phoenix cells by using siRNAs as described under “Experimental Procedures” and verified by semiquantitative RT-PCR (Fig. 8a). Densitometry comparing the HSPC038 signal with a housekeeping transcript (β-actin) revealed that the efficiency of the HSPC038 knockdown was ≈85% (Fig. 8b; p < 0.001, n = 3). IClswell activation was elicited and measured as previously described in cells where the knockdown of HSPC038 was induced and compared with the current measured under control conditions. The current density-to-voltage relation measured 5 min after hypotonic shock (Fig. 8c) and the respective current density-to-time relation (Fig. 8d) show that HSPC038 knockdown induces a significant current decrease (≈40%) with respect to the control (p < 0.0001).
Structure of HSPC038
Our HSPC038 construct contains 85 amino acid residues including a N-terminal polyhistidine sequence for protein purification. Based on sequence alignment comparisons, HSPC038 is found to contain a C2H2 zinc finger motif comprising residues 39–62. We were able to assign the non-proline backbone NH groups of amino acids 37 through 76 with the exception of leucine 67 by using sequential NOE connectivities. A cluster of peaks exist in the random coil region of the 1H-15N HSQC spectrum that belong to the N-terminal sequence of HSPC038 (residues 2–36). This segment is rich in charged amino acid residues, which is a hallmark for unstructured segments in proteins. These residues could not be assigned using sequential NOE connectivities. A homology model of HSPC038 was generated based on the NMR structure of the first zinc finger motif in human ZHX1 (42) (Fig. 9c). The structural model was validated by analyzing sequential NOE contacts expected for the zinc finger ββα topology (data not shown).
FIGURE 9.
Structural mapping of the HSPC038-ICln 1–159 interaction interfaces. a, overlay of 1H-15N HSQC NMR spectra of free HSPC038 (blue contours) and the HSPC038-ICln 1159 complex (red contours). b, absolute difference in resonance frequency (Equation 1) between free HSPC038 and the HSPC038-ICln 1–159 complex displayed against the primary sequence. Secondary structure elements are indicated in blue (β-strands) and in red (α-helix). c, HSPC038 residues with a frequency difference exceeding 9 Hz (dotted line in b) upon complex formation with ICln 1–159 are colored in red on the HSPC038 homology model. The zinc coordinating cysteine and histidine residues are shown as blue sticks. d, overlay of 1H-15N HSQC NMR spectra of free ICln 1–159 (blue contours) and the ICln 1–159-HSPC038 complex (red contours). e, absolute difference in resonance frequency (Equation 1) between free ICln 1–159 and the ICln 1–159-HSPC038 complex displayed against the primary sequence. Secondary structure elements are indicated in blue (β-strands) and in red (α-helix). f, ICln 1–159 residues with a frequency difference exceeding 10 Hz (dotted line in e) upon complex formation with HSPC038 are colored in red on conformer number one in Protein Data Bank code 1ZYI. Secondary structure elements defined previously (32) are indicated on the structure.
Interaction Interfaces from NMR Spectroscopy
NMR chemical shifts represent a sensitive method for probing changes in the local electronic environment that occur as the result of protein-protein interactions. To probe the potential direct interaction between HSPC038 and ICln 1–159, we mixed labeled 15N ICln 1–159, with an excess of unlabeled HSPC038 and followed 1H and 15N chemical shift perturbations in 1H-15N HSQC spectra (Fig. 9d). By comparing spectra of free and complexed ICln 1–159, it is obvious that a number of residues show small but significant chemical shift changes (Fig. 9e). Strikingly, when displayed on the structure of ICln (32), most of these residues (highlighted in red in Fig. 9f) face one side of the molecule, suggesting a binding interface with HSPC038 centered on two loops connecting β-strand 2 with 3 and β-strand 4 with 5. In addition, also Ala-126 and Ala-132 (both located in the α-helix; Fig. 9f) and Glu-138, and Gly-147 (both located outside the folded core of the protein; Fig. 9e) do show chemical sift changes upon complex formation. These findings fully support the results of affinity chromatography experiments indicating that the region 135–159 is important in stabilizing the ICln-HSPC038 complex. We also performed a similar experiment in the reverse direction where 15N-labeled HSPC038 was mixed with unlabeled ICln 1–159. As before, small but significant chemical shift perturbations upon complex formation (Fig. 9, a and b) were observed. The residues displaying the largest perturbations (highlighted in red in Fig. 9c) were centered on the N-terminal part of the zinc finger motif, suggesting that this face of the molecule is interacting with ICln 1–159. A few residues C-terminal to the zinc finger motif also showed chemical shift perturbations; these residues were not displayed on the homology model (which is restricted to the zinc finger motif). The magnitude of the chemical shift perturbations in both experiments were smaller than what would be expected for a stoichiometric high affinity protein-protein complex. This indicates that the dissociation constant between the proteins is larger than the millimolar concentrations used in the experiments.
DISCUSSION
HSPC038 was first identified in CD34+ hematopoietic stem progenitor cells (HSPC) (43) and shown to be a differentially expressed gene in leukocytes. Its physiological role(s) are still poorly defined. We have shown in earlier studies that the C. elegans homologs for ICln and HSPC038, i.e. IClnN2 (icln-1; CO1F6.8b) and Nx (CO1F6.9), functionally interact (5), and that human ICln and HSPC038 bind to each other (29). Interaction of HSPC038 with ICln suggests a role in cell volume regulation. Indeed, overexpression of HSPC038 (Fig. 2) or ICln (Fig. 1) in human cells by transient transfection markedly up-regulates IClswell. Similarly, knockdown of HSPC038 (Fig. 8) or ICln (6, 11) significantly reduces IClswell activation. Moreover, the presence of purified ICln and/or purified HSPC038 in the intracellular solution during whole cell patch clamp recordings (Figs. 3 and 4) leads, as expected, to an up-regulation of IClswell. These last observations indicate that the effects of ICln or HSPC038 may not require the effect of second messengers or intracellular components that may undergo dialysis after establishment of the whole cell configuration. These experiments do not confirm whether a molecular interaction between HSPC038 and ICln occurs or whether the two proteins act by independent mechanisms leading to the same effect. For this reason, the molecular interaction between HSPC038 and ICln was verified and demonstrated in vitro, as shown by native PAGE, affinity chromatography (Fig. 5 and supplemental Fig. S1) and NMR (Fig. 9) experiments. FRET experiments showed that after hypotonic shock, HSPC038 travels to the cell membrane (Fig. 6, a and b); moreover, the spatial distance between HSCP038 and ICln decreases (Fig. 6, c and d). This latter result can be explained by a molecular interaction between HSCP038 and ICln or between the two proteins and a common structure, i.e. another molecular partner or the cell membrane. Knowing that a similar behavior (translocation to the cell membrane) is well demonstrated for ICln (12–16) and that it is associated with IClswell activation (15, 44), we hypothesized that HSPC038 could promote IClswell activation by facilitating the transposition of ICln to the cell membrane. Accordingly, Western blot experiments show that ICln abundance at the membrane level is increased in HSPC038-overexpressing cells (supplemental Fig. S2). We exclude the possibility that HSPC038 mediates its effect on IClswell and ICln abundance at the plasma membrane by increasing ICln protein expression because HSPC038 overexpression did not modify the total amount of ICln (supplemental Fig. S3). Patch clamp experiments using purified HSPC038 in the intracellular solution also excluded this hypothesis (Figs. 3 and 4).
As already reported by Ritter et al. (15), ICln transposes to the cell membrane after hypotonic shock; here we demonstrate for the first time that HSPC038 shows a similar behavior (Fig. 6, a and b). Although already existing under isotonicity (29), the ICln/HSPC038 interaction increases following hypotonic shock (Fig. 6, c and d). We hypothesize that HSPC038 promotes IClswell activation, thereby promoting the localization of ICln to the membrane. Accordingly, Western blot data (supplemental Fig. S2) show that, following hypotonic shock, HSPC038 increases the membrane abundance of ICln. HSPC038 does not disassociate from ICln after reaching the membrane (the FRET signal does not decrease within 30 min after hypotonic shock; Fig. 6b). Indeed, HSPC038 remains associated with ICln (Fig. 6d) at the cell membrane (Fig. 6b), at least in the time frame explored in these experiments.
Moreover, patch clamp experiments designed to measure IClswell activation in cells cotransfected with HSPC038 and ICln fused with epitopes suitable for inducing protein dimerization (Fig. 7) confirmed that the formation of an HSPC038-ICln complex improves IClswell activation. The evidence that the activation of IClswell is related to the ICln transposition to the cell membrane is reported elsewhere (15). Accordingly, when ICln transposition to the cell membrane is impaired, IClswell activation is reduced (45).
As previously reported (29), the interaction between ICln and HSPC038 already exists in isotonic conditions; however, following hypotonic stress the interaction increases (Fig. 6b), ICln translocates to the cell membrane (supplemental Fig. S2), and IClswell is activated (Fig. 1). Accordingly, there is no current activation in hypertonic conditions despite the HSPC038 overexpression (Fig. 2) or induced dimerization by incubation with the rapalog (Fig. 7). We conclude that the HSPC038/ICln interaction is necessary but not per se sufficient for the activation of IClswell.
By using NMR we were able to (i) reveal the structure of HSPC038 and (ii) show that both proteins (ICln and HSPC038) indeed interact on a molecular level, fully supporting the results we obtained in native PAGE experiments and by affinity chromatography (Fig. 5 and supplemental Fig. S1). The interaction between ICln and HSPC038 occurs under isotonicity (29) and increases under hypotonicity in vivo. In intact cells, we assume that a mechanism of volume sensing, not yet identified (46), triggers the homeostatic response of volume regulation after cell swelling, promoting, and regulating, among other processes, the increase of HSPC038/ICln interaction and ICln translocation to the cell membrane. We assume that the HSPC038/ICln interaction occurs in vitro as well (as shown by native PAGE, Fig. 5; affinity chromatography, Fig. 5 and supplemental Fig. S1; and NMR, Fig. 9), because both proteins are purified and are present at high concentration. This would reveal an interaction also in the absence of any regulatory mechanism.
The NMR experiments further suggest that the interacting site on HSPC038 is centered on the N-terminal part of the zinc finger motif (Fig. 9, a–c). The corresponding binding site on the ICln protein was allocated on one side of the molecule, centered on two loops connecting β-strand 2 with 3 and β-strand 4 with 5 (Fig. 9, d–f), with the amino acids 135–159 having a role in stabilizing the complex (supplemental Fig. S1). We conclude that HSPC038 is important for the regulation of regulatory volume decrease and furthermore that HSPC038 may act as an escort, facilitating the transposition of ICln to the cell membrane following hypotonic shock and therefore facilitating the activation of IClswell.
Supplementary Material
This work was supported in part by Fonds zur Forderung der Wissenschaftlichen Forschung Grants P18608 (to M. P.) and P17119 (to J. F.).

The on-line version of this article (available at http://www.jbc.org) contains supplemental text and Figs. S1–S3.
- IClswell
- swelling-activated chloride current
- ECFP
- enhanced cyan fluorescent protein
- EYFP
- enhanced yellow fluorescent protein
- EGFP
- enhanced green fluorescent protein
- FKBP
- FK506-binding protein
- IRES
- internal ribosome entry site
- MOPS
- 3-(N-morpholino)propanesulfonic acid
- HSQC
- heteronuclear single quantum coherence
- ANOVA
- analysis of variance
- FRAP
- FKB12/rapamycin-associated protein
- FRB
- FKBP12/rapamycin-binding.
REFERENCES
- 1. Paulmichl M., Li Y., Wickman K., Ackerman M., Peralta E., Clapham D. (1992) Nature 356, 238–241 [DOI] [PubMed] [Google Scholar]
- 2. Fürst J., Gschwentner M., Ritter M., Bottà G., Jakab M., Mayer M., Garavaglia L., Bazzini C., Rodighiero S., Meyer G., Eichmüller S., Wöll E., Paulmichl M. (2002) Pflugers Arch. 444, 1–25 [DOI] [PubMed] [Google Scholar]
- 3. Gschwentner M., Fürst J., Ritter M., Bazzini C., Wöll E., Dienstl A., Jakab M., König M., Scandella E., Rudzki J., Botta G., Meyer G., Lang F., Deetjen P., Paulmichl M. (1999) Exp. Physiol. 84, 1023–1031 [PubMed] [Google Scholar]
- 4. Gschwentner M., Susanna A., Schmarda A., Laich A., Nagl U. O., Ellemunter H., Deetjen P., Frick J., Paulmichl M. (1996) J. Allergy Clin. Immunol. 98, S98–S106 [PubMed] [Google Scholar]
- 5. Fürst J., Ritter M., Rudzki J., Danzl J., Gschwentner M., Scandella E., Jakab M., König M., Oehl B., Lang F., Deetjen P., Paulmichl M. (2002) J. Biol. Chem. 277, 4435–4445 [DOI] [PubMed] [Google Scholar]
- 6. Hubert M. D., Levitan I., Hoffman M. M., Zraggen M., Hofreiter M. E., Garber S. S. (2000) Biochim. Biophys. Acta 1466, 105–114 [DOI] [PubMed] [Google Scholar]
- 7. Okada Y., Sato K., Numata T. (2009) J. Physiol. 587, 2141–2149 [DOI] [PMC free article] [PubMed] [Google Scholar]
- 8. Jakab M., Fürst J., Gschwentner M., Bottà G., Garavaglia M. L., Bazzini C., Rodighiero S., Meyer G., Eichmueller S., Wöll E., Chwatal S., Ritter M., Paulmichl M. (2002) Cell Physiol. Biochem. 12, 235–258 [DOI] [PubMed] [Google Scholar]
- 9. Krapivinsky G. B., Ackerman M. J., Gordon E. A., Krapivinsky L. D., Clapham D. E. (1994) Cell 76, 439–448 [DOI] [PubMed] [Google Scholar]
- 10. Chen L., Wang L., Jacob T. J. (1999) Am. J. Physiol. 276, C182–C192 [DOI] [PubMed] [Google Scholar]
- 11. Gschwentner M., Nagl U. O., Wöll E., Schmarda A., Ritter M., Paulmichl M. (1995) Pflügers Arch. 430, 464–470 [DOI] [PubMed] [Google Scholar]
- 12. Meyer G., Rodighiero S., Guizzardi F., Bazzini C., Bottà G., Bertocchi C., Garavaglia L., Dossena S., Manfredi R., Sironi C., Catania A., Paulmichl M. (2004) FEBS Lett. 559, 45–50 [DOI] [PubMed] [Google Scholar]
- 13. Musch M. W., Davis-Amaral E. M., Vandenburgh H. H., Goldstein L. (1998) Pflügers Arch. 436, 415–422 [DOI] [PubMed] [Google Scholar]
- 14. Musch M. W., Luer C. A., Davis-Amaral E. M., Goldstein L. (1997) J. Exp. Zool. 277, 460–463 [DOI] [PubMed] [Google Scholar]
- 15. Ritter M., Ravasio A., Jakab M., Chwatal S., Fürst J., Laich A., Gschwentner M., Signorelli S., Burtscher C., Eichmüller S., Paulmichl M. (2003) J. Biol. Chem. 278, 50163–50174 [DOI] [PubMed] [Google Scholar]
- 16. Tamma G., Procino G., Strafino A., Bononi E., Meyer G., Paulmichl M., Formoso V., Svelto M., Valenti G. (2007) Endocrinology 148, 1118–1130 [DOI] [PubMed] [Google Scholar]
- 17. Okada Y. (1997) Am. J. Physiol. 273, C755–C789 [DOI] [PubMed] [Google Scholar]
- 18. Strange K. (1998) J. Gen. Physiol. 111, 617–622 [DOI] [PMC free article] [PubMed] [Google Scholar]
- 19. Fürst J., Bazzini C., Jakab M., Meyer G., König M., Gschwentner M., Ritter M., Schmarda A., Bottà G., Benz R., Deetjen P., Paulmichl M. (2000) Pflügers Arch. 440, 100–115 [DOI] [PubMed] [Google Scholar]
- 20. Garavaglia M., Dopinto S., Ritter M., Fürst J., Saino S., Guizzardi F., Jakab M., Bazzini C., Vezzoli V., Dossena S., Rodighiero S., Sironi C., Bottà G., Meyer G., Henderson R. M., Paulmichl M. (2004) Cell Physiol. Biochem. 14, 231–240 [DOI] [PubMed] [Google Scholar]
- 21. Garavaglia M. L., Rodighiero S., Bertocchi C., Manfredi R., Fürst J., Gschwentner M., Ritter M., Bazzini C., Bottà G., Jakab M., Meyer G., Paulmichl M. (2002) Pflugers Arch. 443, 748–753 [DOI] [PubMed] [Google Scholar]
- 22. Li C., Breton S., Morrison R., Cannon C. L., Emma F., Sanchez-Olea R., Bear C., Strange K. (1998) J. Gen. Physiol. 112, 727–736 [DOI] [PMC free article] [PubMed] [Google Scholar]
- 23. Krapivinsky G., Pu W., Wickman K., Krapivinsky L., Clapham D. E. (1998) J. Biol. Chem. 273, 10811–10814 [DOI] [PubMed] [Google Scholar]
- 24. Larkin D., Murphy D., Reilly D. F., Cahill M., Sattler E., Harriott P., Cahill D. J., Moran N. (2004) J. Biol. Chem. 279, 27286–27293 [DOI] [PubMed] [Google Scholar]
- 25. Li S., Armstrong C. M., Bertin N., Ge H., Milstein S., Boxem M., Vidalain P. O., Han J. D., Chesneau A., Hao T., Goldberg D. S., Li N., Martinez M., Rual J. F., Lamesch P., Xu L., Tewari M., Wong S. L., Zhang L. V., Berriz G. F., Jacotot L., Vaglio P., Reboul J., Hirozane-Kishikawa T., Li Q., Gabel H. W., Elewa A., Baumgartner B., Rose D. J., Yu H., Bosak S., Sequerra R., Fraser A., Mango S. E., Saxton W. M., Strome S., Van Den Heuvel S., Piano F., Vandenhaute J., Sardet C., Gerstein M., Doucette-Stamm L., Gunsalus K. C., Harper J. W., Cusick M. E., Roth F. P., Hill D. E., Vidal M. (2004) Science 303, 540–543 [DOI] [PMC free article] [PubMed] [Google Scholar]
- 26. Jakab M., Ritter M. (2006) Contrib. Nephrol. 152, 161–180 [DOI] [PubMed] [Google Scholar]
- 27. Pu W. T., Krapivinsky G. B., Krapivinsky L., Clapham D. E. (1999) Mol. Cell Biol. 19, 4113–4120 [DOI] [PMC free article] [PubMed] [Google Scholar]
- 28. Fürst J., Bottà G., Saino S., Dopinto S., Gandini R., Dossena S., Vezzoli V., Rodighiero S., Bazzini C., Garavaglia M. L., Meyer G., Jakab M., Ritter M., Wappl-Kornherr E., Paulmichl M. (2006) Acta Physiol. 187, 43–49 [DOI] [PubMed] [Google Scholar]
- 29. Eichmüller S., Vezzoli V., Bazzini C., Ritter M., Fürst J., Jakab M., Ravasio A., Chwatal S., Dossena S., Bottà G., Meyer G., Maier B., Valenti G., Lang F., Paulmichl M. (2004) J. Biol. Chem. 279, 7136–7146 [DOI] [PubMed] [Google Scholar]
- 30. Blumenthal T., Evans D., Link C. D., Guffanti A., Lawson D., Thierry-Mieg J., Thierry-Mieg D., Chiu W. L., Duke K., Kiraly M., Kim S. K. (2002) Nature 417, 851–854 [DOI] [PubMed] [Google Scholar]
- 31. Morgan R. A., Couture L., Elroy-Stein O., Ragheb J., Moss B., Anderson W. F. (1992) Nucleic Acids Res. 20, 1293–1299 [DOI] [PMC free article] [PubMed] [Google Scholar]
- 32. Fürst J., Schedlbauer A., Gandini R., Garavaglia M. L., Saino S., Gschwentner M., Sarg B., Lindner H., Jakab M., Ritter M., Bazzini C., Botta G., Meyer G., Kontaxis G., Tilly B. C., Konrat R., Paulmichl M. (2005) J. Biol. Chem. 280, 31276–31282 [DOI] [PubMed] [Google Scholar]
- 33. Chen B. P., Hai T. (1994) Gene 139, 73–75 [DOI] [PubMed] [Google Scholar]
- 34. Delaglio F., Grzesiek S., Vuister G. W., Zhu G., Pfeifer J., Bax A. (1995) J. Biomol. NMR 6, 277–293 [DOI] [PubMed] [Google Scholar]
- 35. Helgstrand M., Kraulis P., Allard P., Härd T. (2000) J. Biomol. NMR 18, 329–336 [DOI] [PubMed] [Google Scholar]
- 36. Schedlbauer A., Kontaxis G., König M., Fürst J., Jakab M., Ritter M., Garavaglia L., Bottà G., Meyer G., Paulmichl M., Konrat R. (2003) J. Biomol. NMR 27, 399–400 [DOI] [PubMed] [Google Scholar]
- 37. Kiefer F., Arnold K., Künzli M., Bordoli L., Schwede T. (2009) Nucleic Acids Res. 37, D387–D392 [DOI] [PMC free article] [PubMed] [Google Scholar]
- 38. Arnold K., Bordoli L., Kopp J., Schwede T. (2006) Bioinformatics 22, 195–201 [DOI] [PubMed] [Google Scholar]
- 39. Ho S. N., Biggar S. R., Spencer D. M., Schreiber S. L., Crabtree G. R. (1996) Nature 382, 822–826 [DOI] [PubMed] [Google Scholar]
- 40. Choi J., Chen J., Schreiber S. L., Clardy J. (1996) Science 273, 239–242 [DOI] [PubMed] [Google Scholar]
- 41. Gschwentner M., Susanna A., Wöll E., Ritter M., Nagl U. O., Schmarda A., Laich A., Pinggera G. M., Ellemunter H., Huemer H., Deetjen P., Paulmichl M. (1995) Mol. Med. 1, 407–417 [PMC free article] [PubMed] [Google Scholar]
- 42. Wienk H., Lammers I., Hotze A., Wu J., Wechselberger R. W., Owens R., Stammers D. K., Stuart D., Kaptein R., Folkers G. E. (2009) Biochemistry 48, 4431–4439 [DOI] [PubMed] [Google Scholar]
- 43. Zhang Q. H., Ye M., Wu X. Y., Ren S. X., Zhao M., Zhao C. J., Fu G., Shen Y., Fan H. Y., Lu G., Zhong M., Xu X. R., Han Z. G., Zhang J. W., Tao J., Huang Q. H., Zhou J., Hu G. X., Gu J., Chen S. J., Chen Z. (2000) Genome Res. 10, 1546–1560 [DOI] [PMC free article] [PubMed] [Google Scholar]
- 44. Jakab M., Grundbichler M., Benicky J., Ravasio A., Chwatal S., Schmidt S., Strbak V., Fürst J., Paulmichl M., Ritter M. (2006) Cell Physiol Biochem. 18, 21–34 [DOI] [PubMed] [Google Scholar]
- 45. Gandini R., Dossena S., Vezzoli V., Tamplenizza M., Salvioni E., Ritter M., Paulmichl M., Furst J. (2008) Cell Physiol Biochem. 22, 579–590 [DOI] [PubMed] [Google Scholar]
- 46. Hoffmann E. K., Simonsen L. O. (1989) Physiol. Rev. 69, 315–382 [DOI] [PubMed] [Google Scholar]
Associated Data
This section collects any data citations, data availability statements, or supplementary materials included in this article.


