Background: Gluconeogenesis contributes to insulin resistance in type 1 and type 2 diabetes, but underlying molecular mechanisms remain unclear.
Results: CARHSP1 functions at the transcriptional level to negatively regulate gluconeogenic genes in the liver.
Conclusion: CARHSP1 inhibits hepatic gluconeogenic gene expression via repression of PPARα.
Significance: CARHSP1 is a negative regulator of hepatic gluconeogenesis and a potential molecular target for the treatment of diabetes.
Keywords: Diabetes, Gene Expression, Gluconeogenesis, Nuclear Receptors, Transcription Regulation
Abstract
Gluconeogenesis contributes to insulin resistance in type 1 and type 2 diabetes, but its regulation and the underlying molecular mechanisms remain unclear. Recently, calcium-regulated heat-stable protein 1 (CARHSP1) was identified as a biomarker for diabetic complications. In this study, we investigated the role of CARHSP1 in hepatic gluconeogenesis. We assessed the regulation of hepatic CARHSP1 expression under conditions of fasting and refeeding. Adenovirus-mediated CARHSP1 overexpression and siRNA-mediated knockdown experiments were performed to characterize the role of CARHSP1 in the regulation of gluconeogenic gene expression. Here, we document for the first time that CARHSP1 is regulated by nutrient status in the liver and functions at the transcriptional level to negatively regulate gluconeogenic genes, including the glucose-6-phosphatase catalytic subunit (G6Pc) and phosphoenolpyruvate carboxykinase 1 (PEPCK1). In addition, we found that CARHSP1 can physically interact with peroxisome proliferator-activated receptor-α (PPARα) and inhibit its transcriptional activity. Both pharmacological and genetic ablations of PPARα attenuate the inhibitory effect of CARHSP1 on gluconeogenic gene expression in hepatocytes. Our data suggest that CARHSP1 inhibits hepatic gluconeogenic gene expression via repression of PPARα and that CARHSP1 may be a molecular target for the treatment of diabetes.
Introduction
Gluconeogenesis maintains glucose homeostasis in humans, especially during prolonged fasting or starvation, but abnormal hepatic gluconeogenesis contributes to insulin resistance (1–3) with increased gluconeogenesis as a major contributor to fasting hyperglycemia in both type 1 and type 2 diabetes (4, 5). Gluconeogenesis is controlled by certain rate-limiting enzymes such as the glucose-6-phosphatase catalytic subunit (G6Pc)3 and phosphoenolpyruvate carboxykinase (PEPCK), and these genes are regulated by critical metabolism-related hormones including insulin, glucagon, and glucocorticoids. Although the important role of gluconeogenesis is known, the regulation of gluconeogenesis and its underlying mechanisms still remain to be further investigated.
Calcium-regulated heat-stable protein (CARHSP1) is a ubiquitously expressed phosphoprotein that is comprised of 147 amino acids with nearly 14% proline (6). CARHSP1 is serine-phosphorylated by Akt, SGK1 (serum- and glucocorticoid-induced protein kinase 1) and RSK (p90 ribosomal S6 kinase) in response to growth factors such as EGF and insulin-like growth factor-1 (IGF-1) (7). On the other hand, CARHSP1 can be dephosphorylated by Ca2+/calmodulin-regulated protein phosphatase calcineurin (PP2B) (8). Coordinated phosphorylation and dephosphorylation of CARHSP1 contribute to the multiple phosphorylated isoforms of CARHSP1 in acinar cells (9). Recently, CARHSP1 was discovered as a biomarker for diabetic retinopathy (10) and as a regulator of TNF-α mRNA stability in macrophages (11). CARHSP1 may be involved in oxidative stress via traffic between stress granules and processing bodies (12). Although posttranscriptional modification and the clinical relevance of CARHSP1 have been gradually recognized, there is an extremely limited understanding of the function of CARHSP1 in metabolism. Here, we demonstrate that CARHSP1 can potently inhibit the expression of gluconeogenic genes, including G6Pc and PEPCK1, when overexpressed in hepatocytes. Our data suggest that CARHSP1, via inhibition of PPARα, is of major importance in hepatic metabolism.
EXPERIMENTAL PROCEDURES
Animal Procedures
8- to 10-week-old male C57BL/6J mice and PPARα knockout (B6, 129S4-Pparatm1Gonz/J) mice were purchased from The Jackson Laboratory (Bar Harbor, ME). Adenovirus infections were performed by tail vein injection of 2 × 10⁹ adenoviral particles per mouse. Blood glucose was measured by tail bleeds using an Ascencia Elite (Bayer) meter. Wild-type and db/db mice were fasted for 18 h. At time 0, blood glucose was measured, and immediately thereafter, 2 g pyruvate (dissolved in PBS)/kg body weight were injected intraperitoneally. Blood glucose was measured at indicated time points. Mice were fed a standard diet (22.5% protein, 11.8% fat, and 52% carbohydrate by mass) and sacrificed by CO2 asphyxiation 4–5 days after adenovirus injection. All animal work was performed in accordance with the University of Michigan Animal Care and Use Committee.
Materials
Reagents were from the following sources. Forskolin, dexamethasone, insulin, GW6471, and an antibody against FLAG were purchased from Sigma-Aldrich (St. Louis, MO). Antibodies against CARHSP1, PPARα, β-actin, peroxisome proliferator-activated receptor γ coactivator 1-α (PGC-1α), GFP, HNF4α, and GAPDH were purchased from Santa Cruz Biotechnology, Inc. (Santa Cruz, CA). Antibodies against Myc-tag and phospho-Ser/Thr were from Cell Signaling Technology, Inc. and Spring Bioscience, respectively.
Cell Culture
Primary mouse hepatocytes and HepG2 cell lines were grown in DMEM high glucose supplemented with 10% FBS and 50 mg/ml of a Pen/Strep mix in a 37 °C/5% CO2 humidified incubator.
Construction of Plasmids and Transfections
Desired DNA fragments encoding different lengths of the G6Pc promoter region were PCR-amplified from human genomic DNA and inserted into the pGL4.11 luciferase reporter vector (Promega, Madison, WI). The inserts were positioned between KpnI and XhoI sites relative to the luciferase coding sequence. Proper insertion was verified by direct DNA sequencing. To construct a pGL4–159-Luc vector containing a mutation in the PPAR-responsive element (pGL4–159mut-Luc), site-directed mutagenesis of the pGL4–159-Luc vector was carried out using PCR methods according to the manufacturer's recommendations (Agilent Technologies). The synthetic oligonucleotide primers used for mutagenesis were 5′-CAAACGTGGTTTTTGGTTCCAACGAGCAGGGCTGGGTTGACCTG-3′ (sense) and 5′-CAGGTCAACCCAGCCCTGCTCGTTGGAACCAAAACCACGTTTG-3′ (antisense). The coding region sequences corresponding to human CARHSP1-GFP and FLAG-PPARα (full-length and different-length fragments), as well as human HFN4α, were amplified from human cDNA by high-fidelity pfu polymerase (Agilent Technologies). PCR products were sequenced and cloned into pcDNA3.1. HepG2 cells were seeded 24 h before transfection at 50–60% confluence and then cotransfected with plasmids with Lipofectamine 2000 (Invitrogen). Luciferase activity was detected with a luciferase substrate kit (Promega).
siRNA-mediated Gene Knockdown
Primary mouse hepatocytes were reverse-transfected with siRNA-CARHSP1 (s78866, Ambion, Inc.) using Lipofectamine RNAiMAX Reagent (Invitrogen) according to the manufacturer's recommendations. Regarding adenovirus infection, hepatocytes were infected with adenoviruses in 10% FBS DMEM for 4 h and then changed to fresh 10% FBS DMEM.
Construction of Adenoviruses
To generate adenoviral vectors for overexpressing CARHSP1 or PPARα, the coding region sequences corresponding to human CARHSP1 and PPARα were amplified from human cDNA by high-fidelity pfu polymerase (Agilent Technologies). PCR products were sequenced and cloned into AdTrack-CMV from Agilent Technologies. Next, the gene coding sequences were cloned from Ad-track to the Ad-Easy vector by homologous recombination in Escherichia coli. To package the adenoviruses, adenoviral vectors were linearized with the restriction enzyme, PacI, and transfected into HEK293 cells using Lipofectamine 2000. After propagation, the recombinant adenoviruses were purified by CsCl2 density gradient ultracentrifugation. Adenovirus genomic DNA was purified with the NucleoSpin virus kit (Macherey Nagel), and adenovirus titration was performed using the Adeno-Xtm quantitative PCR titration kit (Clontech).
Coimmunoprecipitation
HepG2 cells were lysed in lysis buffer (50 mm Tris-HCl (pH 7.8), 137 mm NaCl, 1 mm EDTA) containing 0.1% Triton-X-100 and a protease inhibitor mixture (Roche). After centrifugation at 12,000 rpm for 15 min at 4 °C, the supernatants were collected for an immunoprecipitation (IP) assay. Cellular extracts were precleared with protein G plus agarose for 1 h at 4 °C and then incubated with an anti-CARHSP1 or anti-PPARα (Santa Cruz Biotechnology, Inc.) antibody overnight at 4 °C. Normal IgG was used for a negative control. The immunocomplexes were pulled down by incubation with protein G-agarose for 1 h at 4 °C and washed four times with wash buffer (20 mm, 0.2 mm EDTA, 100 mm KCl, 2 mm MgCl2, 0.1% Tween 20, 10% glycerol). The samples were separated by SDS-PAGE and analyzed by immunoblotting using an anti-PPARα or -CARHSP1 antibody.
Total RNA Preparation and RT Quantitative PCR Analysis
Total RNA from liver samples of individual animals was extracted using TRIzol reagent (Invitrogen) according to the manufacturer's instructions. Total RNA from cells in culture was extracted using the RNeasy kit (Qiagen). RNA was reverse-transcribed into cDNA with SuperScript III (Invitrogen) and oligo-dT20 primers (Invitrogen). The abundance of transcripts was assessed by a real-time PCR system (Bio-Rad) using iQ SYBR Green Supermix (Bio-Rad). The relative quantification for each gene of interest was normalized against the internal control, 18S. The primer sequences are shown in supplemental Table 1.
Isolation of Primary Mouse Hepatocytes
Primary mouse hepatocytes were isolated from 8- to 10-week-old mice as described previously (13). In brief, mice were anesthetized and the liver was exposed. A syringe pump was set up with attached silastic tubing and then inserted into the portal vein. The liver was perfused with liver perfusion medium and liver digestion medium (Invitrogen). Hepatocytes were isolated by shaking the liver in Leibovitz L-15 medium (Invitrogen) on ice. Hepatocytes were washed twice and separated from other types of cells with Percoll (Sigma). Hepatocytes were seeded on rat tail type I collagen-coated plates or dishes (BD Biosciences) in Williams' E medium (Invitrogen) supplemented with 10% FBS for 4 h, followed by a change to fresh 10% FBS DMEM.
Cell Extraction and Western Blotting
All mammalian cell extracts were prepared with lysis buffer (Thermo Scientific) that included the following: 50 mm Tris (pH 7.5), 120 mm NaCl, 1 mm EDTA, 6 mm EGTA, 0.1% Nonidet P-40, 20 mm NaF, 1 mm sodium pyrophosphate, 30 mm 4-nitrophenyl phosphate, 1 mm benzamidine, and a protease inhibitor mixture (Roche). Cells were rinsed twice with ice-cold PBS and incubated on ice for 30 min. Cytoplasmic and nuclear extracts were prepared with NE-PER® nuclear and cytoplasmic extraction reagents (Thermo Scientific). Protein extracts were resolved by SDS-PAGE using 12% gels and electroblotted onto PVDF membranes (Bio-Rad). Membranes were blocked for 1 h at room temperature in TBS Tween 20 containing 5% (w/v) nonfat dry milk powder, washed twice, and incubated overnight with primary antibodies diluted 1:200–1000 in 5% nonfat milk solution. After further washing, membranes were incubated with a donkey anti-rabbit or mouse IRDye-conjugated IgG (Li-Cor Odyssey) secondary antibody diluted 1:5000 for 1 h. Blots were scanned, and the image was displayed in grayscale. The intensity of the protein bands was quantified using an image processing program (Li-Cor Odyssey).
Glucose Output Assays
Mouse primary hepatocytes were infected with adenoviruses (50 m.o.i./each adenovirus) for 24 h in 10% FBS DMEM, and then maintained in 0.2% FBS DMEM for another 24 h. Next, media were replaced with Krebs-Ringer buffer (115 mm NaCl, 5.9 mm KCl, 1.2 mm MgCl2, 2.5 mm CaCl2, 25 mm NaHCO3, 1.2 mm NaH2PO4 (pH 7.4)) plus 10 mm lactate and 1 mm pyruvate. Eight hours later, the glucose released in the media was measured using a QuantiChromtm glucose assay kit (Bioassay Systems, CA).
ChIP
ChIP assays were performed according to the manufacturer's instructions with minor modifications using the EZ ChIP kit (Millipore). In brief, liver tissue or hepatocytes were treated for 15 min with 1% formaldehyde at room temperature for cross-linking, and these reactions were terminated by the addition of glycine at a final concentration of 125 mm. Liver tissue or cells were lysed and chromatin extracts were sonicated for obtaining DNA fragments between 500–1000 bp. The sonicated chromatin was first precleared for 1 h with protein G-agarose. After centrifugation, supernatants were incubated overnight at 4 °C with 5 μg anti-PPARα antibody (Santa Cruz Biotechnology, Inc.) or normal rabbit IgG. The immunoprecipitated DNA-protein complex was incubated with protein G-agarose for 1 h at 4 °C. After centrifugation, the complex was washed in low-salt buffer, high-salt buffer, LiCl buffer, and Tris-EDTA buffer. The protein-chromatin cross-linking in the immunoprecipitated complex was reversed at 65 °C overnight. Proteins were eliminated using Proteinase K for 30 min at 45 °C. DNA was purified and used as a template for real-time PCR. The PCR primers used for the analysis of G6Pc and PEPCK1 promoters are listed in supplemental Table 1. PCR amplification products were confirmed on ethidium bromide-stained 2% agarose gels.
Statistical Analysis
Statistical comparisons and analyses between two groups were performed by two-tailed unpaired Student's t test, and among three groups or more they were performed by one-way analysis of variance followed by a Newman-Keuls test. A p value of < 0.05 was considered statistically significant. Data are presented as mean ± S.E.
RESULTS
The Expression of CARHSP1 Changes with Nutrient Transition
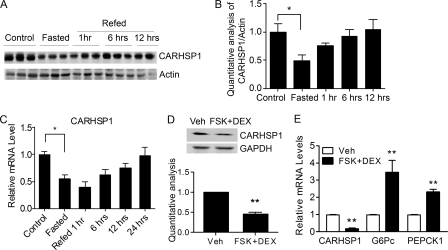
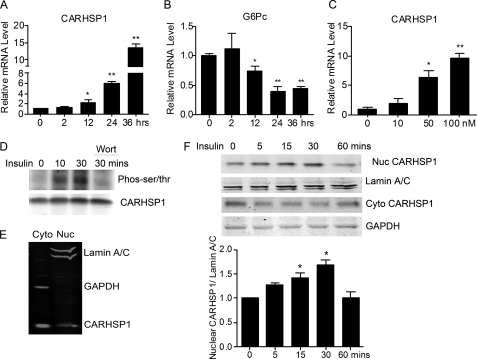
To determine whether CARHSP1 is a potential regulator of metabolism, we first detected its expression in the liver. CARHSP1 protein levels were significantly reduced after mice were fasted for 24 h. Furthermore, CARHSP1 protein expression was increased after mice were refed for 1 h and returned to base line after 6 h of refeeding (Fig. 1, A and B), although CARHSP1 mRNA expression levels remained low (C). To mimic fasting signals in vivo, primary mouse hepatocytes were isolated and incubated in vitro with forskolin (FSK) and dexamethasone (DEX) (14) in a low-nutrient status (0.2% FBS medium) for 16 h. CARHSP1 protein levels were significantly reduced in these altered culture conditions (Fig. 1D). CARHSP1 mRNA expression was down-regulated, whereas G6Pc and PEPCK1 (phosphoenolpyruvate carboxykinase 1, soluble) mRNA levels were up-regulated by stimulation with forskolin and dexamethasone (Fig. 1E). G6Pc and PEPCK1 are regulated at the transcriptional level by a variety of hormonal and nutrient signals including insulin, glucocorticoids, thyroid hormones, and cyclic AMP (15, 16). Our data suggest that fasting conditions contribute to the changes of CARHSP1 expression in the liver. Insulin signaling is activated during refeeding. We found that insulin increases CARHSP1 expression but decreases G6Pc expression in primary mouse hepatocytes (Fig. 2, A–C). Insulin treatment also induced CARHSP1 phosphorylation, whereas wortmannin, a PI3K inhibitor, blocked phosphorylation (Fig. 2D). Regarding the subcellular protein location of CARHSP1, we demonstrated that CARHSP1 is located in both the cytoplasm and nucleus of hepatocytes (Fig. 2E). Furthermore, we found that insulin induced CARHSP1 nuclear translocation in hepatocytes (Fig. 2F). All in all, our data suggest that regulation of CARHSP1 expression and subcellular localization occur during fasting and refeeding conditions.
FIGURE 1.
CARHSP1 is regulated by physiological and pathophysiological stimuli. C57BL/6J mice were fasted for 24 h and then refed for the indicated times (n = 3). Liver protein expression levels were determined by Western blotting (A) and quantitatively analyzed and normalized against the internal control (B). C, C57BL/6J mice were fasted for 24 h and then refed at different time points. CARHSP1 expression in the liver was determined by real-time PCR. D and E, primary mouse hepatocytes were treated with 1 μm DEX and 10 μm forskolin (FSK) in 0.2% FBS medium for 16 h, and then protein and mRNA levels were determined by Western blotting (D) and real-time PCR (E). Quantitative analysis in D and E is from three independent experiments. Data are presented as mean ± S.E. *, p < 0.05; **, p < 0.01. Veh, vehicle.
FIGURE 2.
Subcellular distribution of CARHSP1 in hepatocytes. A, primary mouse hepatocytes were treated with insulin (50 nm) in 2% FBS DMEM and the expression levels of CARHSP1 (A) and of G6Pc (B) were determined by real-time PCR at different time points. C, primary mouse hepatocytes were treated with insulin at different dosages for 24 h, and the expression of CARHSP1was determined by real-time PCR. D, HepG2 cells were incubated with insulin (50 nm) for the indicated times. Cells treated with insulin for 30 min were pretreated with wortmannin (200 nm). Cell extracts were subjected to coimmunoprecipitation with an antibody against CARHSP1 and then immunoblotting with an antibody against phosphorylated Ser/Thr (pan). E, cytoplasmic and nuclear aliquots (20 μg loaded protein) were purified from HepG2 cells and subjected to immunoblotting analysis. F, primary mouse hepatocytes were treated with insulin (50 nm) for different times. Cytoplasmic and nuclear protein were extracted and subjected to immunoblotting analysis. Nuclear CARHSP1 is quantitatively analyzed and normalized against Lamin A/C. Data are presented as mean ± S.E. *, p < 0.05; **p < 0.01.
Hepatic Gluconeogenic Genes Are Down-regulated by CARHSP1
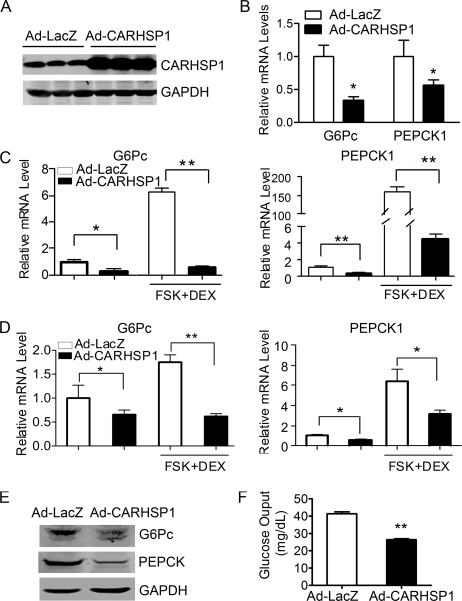
To determine the function of CARHSP1 in hepatic metabolism, we injected Ad-CARHSP1 into C57BL/6J mice by tail vein to obtain CARHSP1 gain of function. The expression of Ad-CARHSP1 in the liver was confirmed by Western blotting (Fig. 3A). Interestingly, CARHSP1 gain of function in the liver significantly inhibited gluconeogenic gene expression at 4 days after adenovirus tail vein injection (Fig. 3B). Moreover, in cultured primary mouse hepatocytes, CARHSP1 dramatically inhibited G6Pc and PEPCK1 expression both in low serum (0.2% serum) and upon further induction in the presence of forskolin (10 μm) and dexamethasone (1 μm) (Fig. 3C). A similar result was observed in the CARHSP1-overexpressing HepG2 human hepatocyte cell line (Fig. 3D). CARHSP1 also decreased the protein expression of G6Pc and PEPCK1 in primary mouse hepatocytes (Fig. 3E). Functionally, CARHSP1 overexpression potently inhibited glucose output from primary mouse hepatocytes (Fig. 3F). Hepatic glucose output generally reflects the total flux resulting from gluconeogenic and glycogenolytic pathways (17). Overall, our data suggest that CARHSP1 inhibits glucose output at least partly through modulation of gluconeogenesis.
FIGURE 3.
Adenovirus-mediated overexpression of CARHSP1 inhibits gluconeogenic genes in hepatocytes. C57BL/6J mice were injected with Ad-CARHSP1 or Ad-LacZ (2 × 10⁹ virus particles) by the tail vein, n = 4–5. Four days later, the expression of CARHSP1 was detected by Western blotting (A), and the mRNA expression levels of gluconeogenic genes G6Pc and PEPCK1 were determined by real-time PCR (B). C, primary mouse hepatocytes were infected with Ad-CARHSP1 or Ad-LacZ (100 m.o.i.) for 24 h in 10% FBS DMEM and then maintained in 0.2% FBS DMEM for 24 h, followed by stimulation with dexamethasone (1 μm) and forskolin (FSK) (10 μm) for 1.5 h. G6Pc and PEPCK1 mRNA expression levels were detected by real-time PCR. D, 48 h post-infection with Ad-CARHSP1 or Ad-LacZ, HepG2 cells were cultured in 0.2% FBS DMEM for 5 h, then stimulated with dexamethasone (1 μm) and forskolin (10 μm) for 1.5 h. PEPCK1 and G6Pc mRNA expression levels were detected by real-time PCR. E and F, primary mouse hepatocytes were infected with Ad-CARHSP1 or Ad-LacZ (100 m.o.i.) in 10% FBS DMEM for 24 h and then maintained in 0.2% FBS DMEM for another 24 h. The protein expression levels of G6Pc and PEPCK1 were detected by Western blotting (E). Glucose output assays were performed in primary mouse hepatocytes (F). Data in C, D, and F are from three independent experiments and presented as mean ± S.E. *, p < 0.05; **, p < 0.01.
CARHSP1 Knockdown Up-regulates the Expression of Gluconeogenic Genes
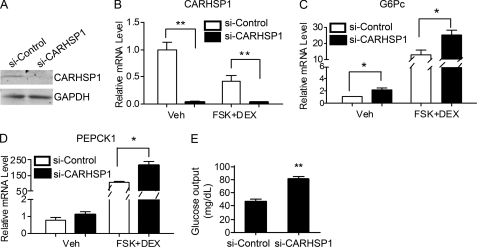
To determine whether CARHSP1 functions in a physiological context, we investigated the effect of endogenous CARHSP1 on the expression of gluconeogenic genes. Using siRNA against CARHSP1, the expression of CARHSP1 was efficiently knocked down in hepatocytes at both the protein and mRNA levels (Fig. 4, A and B). Consistent with our observation that CARHSP1 gain of function in hepatocytes resulted in marked down-regulation of gluconeogenic genes, CARHSP1 loss of function, conversely, increased the expression of G6Pc and PEPCK1 (Fig. 4, C and D) both in basal and forskolin+DEX-stimulated conditions. This indicates that loss of CARHSP1 is probably releasing basal inhibition of these genes. CARHSP1 knockdown also significantly increases glucose output from primary mouse hepatocytes (Fig. 4E). Thus, CARHSP1 is required to maintain steady basal levels of expression and ensure homeostatic regulation of gluconeogenic genes.
FIGURE 4.
Effect of CARHSP1 knockdown on the expression of gluconeogenic genes. A, CARHSP1 protein levels were efficiently knocked down by transfection of siRNA against CARHSP1 (40 nm) for 48 h in primary mouse hepatocytes as determined by Western blotting. B, CARHSP1 was knocked down in primary mouse hepatocytes by transfection of siRNA against CARHSP1 (40 nm). After 48 h, cells were stimulated with dexamethasone (1 μm) and forskolin (FSK) (10 μm) for 1.5 h. The mRNA levels of CARHSP1 (B), G6Pc (C), and PEPCK1 (D) were detected by real-time PCR. E, glucose output assays were performed to detect the effect of CARHSP1 knockdown on glucose output in primary mouse hepatocytes. The data shown are from three independent experiments and presented as mean ± S.E. *, p < 0.05; **, p < 0.01.
CARHSP1 Inhibits PPARα-induced Gluconeogenic Gene Expression in Hepatocytes
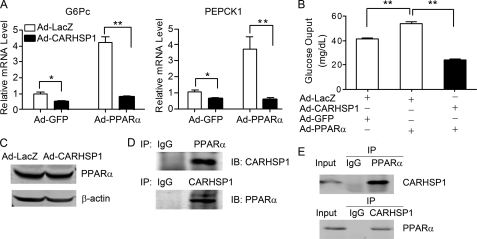
Previous studies identified that PPARα could regulate gluconeogenic genes in both wild-type (18) and DEX-treated LDL receptor (LDL-R) null mice (19). We found that CARHSP1 inhibits PPARα-induced expression of G6Pc and PEPCK1 by as much as 80% in HepG2 cells (Fig. 5A) and potently inhibits PPARα-induced glucose output in primary hepatocytes (B). Therefore, our data suggest that there is an inhibitory epistatic effect of CARHSP1 on PPARα activity in the regulation of hepatic gluconeogenesis. Next, we sought to investigate the mechanisms linking CARHSP1 and PPARα in hepatic gluconeogenesis. CARHSP1 could impair PPARα activity in different ways (i.e. affecting protein levels, subcellular protein localization, or DNA binding). However, we found that CARHSP1 did not alter PPARα protein expression in HepG2 cells (Fig. 5C). As determined by a coimmunoprecipitation assay, endogenous CARHSP1 physically interacts with PPARα in vivo (Fig. 5D) and in vitro (E).
FIGURE 5.
CARHSP1 inhibits PPARα-induced gluconeogenic gene expression in hepatocytes. A, HepG2 cells were coinfected with Ad-CARHSP1 or Ad-LacZ in the presence or absence of Ad-PPARα and Ad-GFP (50 m.o.i./each adenovirus) in 10% FBS medium, and after 48 h G6Pc and PEPCK1 mRNA expression levels were detected by real-time PCR. B, primary mouse hepatocytes were infected with Ad-CARHSP1 or Ad-LacZ (50 m.o.i./each adenovirus) in the presence or absence of Ad-PPARα and Ad-GFP for 24 h in 10% FBS DMEM and then maintained in 0.2% FBS DMEM for another 24 h when the glucose output assays were performed. Data shown are from three independent experiments and presented as mean ± S.E. *, p < 0.05; **, p < 0.01. C, HepG2 cells were infected with Ad-LacZ or Ad-CARHSP1 (50 m.o.i.). After 24 h, protein levels of PPARα were detected by Western blotting. D, coimmunoprecipitation was performed with an antibody against PPARα or CARHSP1 in mouse liver. Normal IgG was used as a negative control. E, HepG2 cells were infected with Ad-PPARα (100 m.o.i.) 24 h before coimmunoprecipitation with an antibody against PPARα or CARHSP1. Normal rabbit IgG was used as a negative control.
CARHSP1 Interacts with PPARα in Hepatocytes
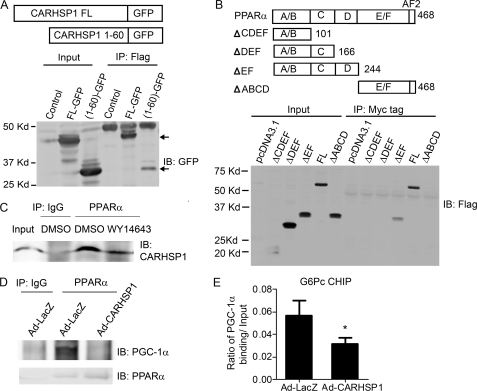
To determine the respective binding domains of both CARHSP1 and PPARα, we generated CARHSP1 fragment-GFP fusion proteins and FLAG-PPARα fragments to perform immunoprecipitation assays. We found the 1–60-amino acid (aa) sequence of CARHSP1 binds to PPARα (Fig. 6A), whereas the 167–244-aa sequence of PPARα binds to CARHSP1, respectively (Fig. 6B). Interestingly, the PPARα agonist WY-14643 can induce the dissociation of CARHSP1 from PPARα (Fig. 6C). To determine whether CARHSP1 competes with coactivators of PPARα, we performed coimmunoprecipitation and ChIP assays. PGC-1α is a well known PPARα coactivator that plays a critical role in gluconeogenesis. We demonstrated that CARHSP1 reduced the binding of PGC-1α to PPARα in hepatocytes (Fig. 6D). Moreover, CARHSP1 could suppress the binding of PGC-1α to the G6Pc promoter, where there exists a PPRE site for PPARα binding (Fig. 6E).
FIGURE 6.
CARHSP1 interacts with PPARα. A, either full-length CARHSP1-GFP or the 1–60 amino acid sequence of the CARHSP1-GFP fusion protein was cotransfected with FLAG-PPARα into HepG2 cells for 24 h before coimmunoprecipitation with an antibody against FLAG and then immunoblotting with an antibody against GFP. B, FLAG-PPARα fragments and Myc-tagged CARHSP1 were cotransfected into HepG2 cells for 24 h before coimmunoprecipitation with an antibody against Myc-tag and then by immunoblotting (IB) with an antibody against FLAG. C, Primary mouse hepatocytes were treated with WY-14643 (50 μm) for 40 min and then subjected to immunoprecipitation with an antibody against PPARα. Normal rabbit IgG was used as a negative control. D, HepG2 cells were infected with Ad-CARHSP1 or Ad-LacZ 24 h before coimmunoprecipitation with an antibody against PPARα and then subjected to immunoprecipitation with an antibody against PGC1α or PPARα. E, C57BL/6J mice were injected with Ad-CARHSP1 or Ad-LacZ (2 × 10⁹ virus particles) by tail vein. After 4 days, liver samples were isolated, and then CHIP assays were performed using antibodies against PGC-1α and normal rabbit IgG. Purified DNA fragments were detected by real-time PCR. The primers for the ChIP assays were designed to detect the DNA sequence containing putative PPREs in the promoter of G6Pc. Data shown are presented as mean ± S.E. *, p < 0.05.
CARHSP1 Inhibits the Binding of PPARα to the G6Pc Promoter
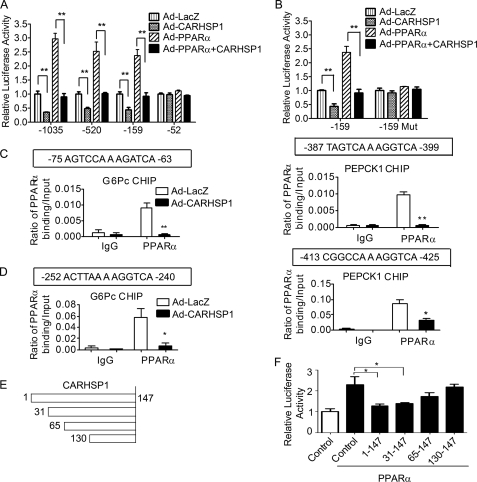
To further establish whether CARHSP1 regulates gluconeogenic gene expression at the transcriptional level, we constructed pGL4 vectors with inserted DNA fragments in varying lengths encoding the G6Pc promoter. Overexpression of PPARα resulted in increased activation of the G6Pc promoter (-1035/+80, −520/+80, and −159/+80) in HepG2 cells, which can be readily inhibited by CARHSP1 (Fig. 7A). Furthermore, it should be noted that CARHSP1 can inhibit G6Pc promoter activity in the absence of overexpressed PPARα, consistent with its ability to regulate basal levels of G6Pc in these cells, as described above (Fig. 3). However, PPARα cannot activate the −52/+80 fragment of the G6Pc promoter, which implies that a functional binding site may exist between −159 bp and −52 bp in the G6Pc promoter. Analysis of transcriptional binding sites with Genomatix software showed that highly conserved PPAR-response elements (PPREs) exist in both human and mouse G6Pc promoters. The putative PPRE (-75/-63) was mutated to determine whether this PPRE is a functional PPARα binding element. The G6Pc-PPREmut promoter could not be activated by PPARα. Furthermore, CARHSP1 had no inhibitory effect on the activity of the mutated promoter (Fig. 7B), suggesting CARHSP1-mediated down-regulation of the G6Pc gene via PPARα.
FIGURE 7.
CARHSP1 inhibits PPARα-mediated transcriptional regulation of gluconeogenic genes. A, the effect of CARHSP1 on PPARα-induced activation of the G6Pc promoter. Serial deletion constructs of the G6Pc promoter were cotransfected with TK-RL into HepG2 cells. After 12 h, cells were infected with Ad-LacZ or Ad-CARHSP1 in the presence or absence of Ad-PPARα for another 48 h. Promoter activities of serial deletion constructs were detected and normalized to Renilla activity. B, CARHSP1 had no effect on the activity of the G6Pc promoter (-159/+80) in which the PPRE was mutated. HepG2 cells were transfected with G6Pc promoter-luc (-159/+80) or G6Pc (-159/+80) Mut-luc. After 12 h, cells were infected with Ad-LacZ or Ad-CARHSP1 in the presence or absence of Ad-PPARα for another 48 h. Activity of the mutated G6Pc promoter was detected and normalized to Renilla activity. The numbers indicate the distance in nucleotides from the transcription start site (+1) of the human G6Pc gene. Representative data are shown from three independent experiments. Data are presented as mean ± S.E. *, p < 0.05; **, p < 0.01. C, HepG2 cells were infected with Ad-LacZ or Ad-CARHSP1 (100 m.o.i.) and after 48 h, ChIP assays were performed using antibodies against PPARα and normal rabbit IgG. Data shown are from three independent experiments. D, C57BL/6J mice were injected with Ad-CARHSP1 or Ad-LacZ (2 × 10⁹ virus particles) by tail vein, n = 4. After 4 days, liver samples were isolated and then CHIP assays were performed using antibodies against PPARα and normal rabbit IgG. Purified DNA fragments were detected by real-time PCR. The primers for the CHIP assays were designed to detect the DNA sequences containing putative PPREs in the promoters of the target genes. Putative PPREs are indicated in horizontal boxes (C and D). Quantitative analysis was performed and normalized against 10% Input. E and F, CARHSP1 fragments (E) and G6Pc promoter (-520)-Luc were cotransfected into HepG2 cells. After 12 h, cells were infected with Ad-LacZ or Ad-PPARα in the presence or absence of Ad-PPARα for another 24 h. Promoter activity was detected and normalized to Renilla activity (F). Data shown are presented as mean ± S.E. *, p < 0.05; **, p < 0.01.
Next, CHIP assays were performed to further determine the effect of CARHSP1 on PPARα binding to the promoter regions of gluconeogenic genes. Consistent with the data shown above, we demonstrate that PPARα can directly bind to the putative PPRE (-75/-63 bp) in the G6Pc promoter and that CARHSP1 potently inhibits the binding of PPARα to this PPRE in human hepatocytes infected with Ad-CARHSP1 (Fig. 7C). Similar results were observed regarding CARHSP1 inhibition of PPARα binding to the PPRE (-387/-399) existing in the human PEPCK1 promoter in HepG2 cells (Fig. 7C). Our data also demonstrate that CARHSP1 has a potent inhibitory effect on the binding of PPARα to G6Pc and PEPCK1 promoters in the mouse liver 4 days after delivering Ad-CARHSP1 by the tail vein (Fig. 7D). Thus, our data identified that CARHSP1 inhibits G6Pc and PEPCK1 expression at the transcriptional level through inhibition of PPARα activity. To determine the repressive domain of CARHSP1, we generated different lengths of the CARHSP1 coding region. The N-terminal 31–65-amino acid sequence of CARHSP1 is necessary for CARHSP1 to fulfill its inhibitory effect on PPARα-induced activation of G6Pc promoter (Fig. 7, E and F).
PPARα Is Required for CARHSP1 Inhibition of Gluconeogenic Gene Expression
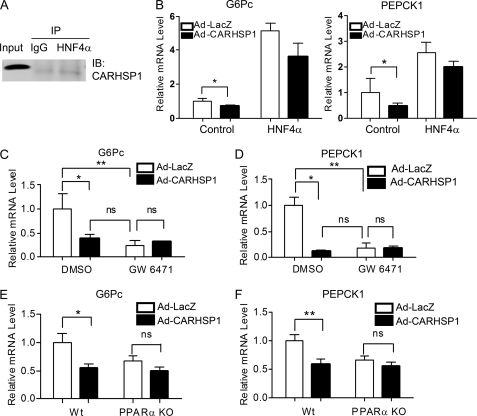
Next, we determined whether CARHSP1 interacts with other nuclear transcriptional factors. HNF4α is a well demonstrated transcriptional factor in regulating gluconeogenesis. However, we did not observe an interaction between CARHSP1 and HNF4α (Fig. 8A), and CARHSP1 did not significantly inhibit HNF4α-induced expression of G6Pc and PEPCK1 (B). To determine whether PPARα is an essential mediator of CARHSP1-induced inhibition of gluconeogenesis, we pharmacologically inactivated PPARα through administration of the PPARα antagonist GW6471, which induces a PPARα conformational change followed by the recruitment of corepressors (20). Interestingly, after GW6471 treatment (20 μm), G6Pc and PEPCK1 expression levels did not change when HepG2 cells were treated with Ad-CARHSP1, which indicated that the regulation of gluconeogenic genes by CARHSP1 was blocked dramatically when PPARα was antagonized (Fig. 8, C and D). We further examined the necessary role of PPARα in mediating the effect of CARHSP1 on gluconeogenesis in hepatocytes isolated from PPARα knockout mice. Consistent with what we observed in pharmacologically PPARα-inactivated hepatocytes, we demonstrated that CARHSP1 also lost its inhibitory effect on G6Pc and PEPCK1 expression in PPARα knockout hepatocytes (Fig. 8, E and F). These data support our hypothesis that CARHSP1, by inhibiting PPARα activity, is a negative regulator of hepatic gluconeogenic genes.
FIGURE 8.
Ablation of PPARα blocks CARHSP1-induced inhibition of gluconeogenesis genes. A and B, CARHSP1 does not interact with HNF4α. coimmunoprecipitation was performed with an antibody against HNF4α in HepG2 cells (A). Normal IgG was used as a negative control. B, HepG2 cells transfected with either HNF4α or pcDNA3.1 for 12 h were then infected with Ad-CARHSP1 or Ad-LacZ (50 m.o.i.) for 24 h. The mRNA expression levels of G6Pc and PEPCK1 were detected by real-time PCR. C and D, HepG2 cells were infected with Ad-CARHSP1 or Ad-LacZ (100 m.o.i.) in the presence or absence of the PPARα antagonist, GW6471 (20 μm) for 48 h in 0.2% FBS medium. E and F, primary mouse hepatocytes isolated from wild-type and PPARα knockout mice were infected with Ad-LacZ or Ad-CARHSP1 (100 m.o.i.) in 10% FBS medium for 24 h followed by a change to 0.2% FBS DMEM for another 24 h. The expression levels of gluconeogenic genes, G6Pc, and PEPCK1 were determined by real-time PCR. Data shown are from three independent experiments and presented as mean ± S.E. *, p < 0.05; **, p < 0.01.
CARHSP1 Suppresses Hepatic Gluconeogenesis in Vivo
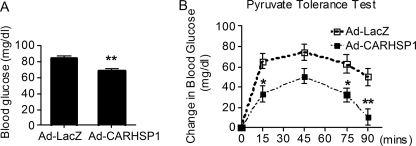
Because CARHSP1 overexpression results in down-regulation of gluconeogenic genes, we sought to test the hypothesis that increases in CARHSP1 will suppress hepatic gluconeogenesis in vivo. As shown in Fig. 9A, overexpression of CARHSP1 reduced fasting blood glucose levels in C57BL/6J mice. More interestingly, the pyruvate sodium tolerance tests performed in our study demonstrate that changes in blood glucose levels were significantly reduced in CARHSP1-treated animals at the specified time points (15, 75, and 90 min) (Fig. 9B). All in all, our data suggest that CARHSP1 potently inhibits hepatic gluconeogenesis and contributes to glucose homeostasis.
FIGURE 9.
CARHSP1 suppresses hepatic gluconeogenesis. C57BL/6J mice (male, 8–10 weeks old) were injected with Ad-CARHSP1 or Ad-LacZ (2 × 10⁹ virus particles) by tail vein. Four days after adenoviral injection, mice were fasted for 18 h (A and B). A, fasting glucose levels were decreased in Ad-CARHSP1-injected mice. B, pyruvate sodium (2 g/kg intraperitoneally) tolerance tests show that increases in blood glucose levels were attenuated in Ad-CARHSP1-injected mice. Blood glucose levels were determined at the indicated time points (n = 8). □, LacZ; ■, CARHSP1. Data shown are presented as mean ± S.E. *, p < 0.05; **, p < 0.01.
DISCUSSION
In this study, we demonstrate for the first time that CARHSP1 has a novel and potent inhibitory effect on hepatic gluconeogenic gene expression and may contribute to the improvement of insulin resistance in diabetic mice. Here, another novel finding is that CARHSP1 fulfills its function through inhibition of PPARα activity.
CARHSP1 is a cold shock domain (CSD)-containing protein with a high level of resemblance to cold shock proteins (6). All living organisms must adapt to environmental changes, including cold shock, heat shock, and nutritional status. Importantly, the nutritional status of the extracellular environment must be sensed and information needs to be conducted to intracellular signaling pathways by cells themselves. Cold shock proteins in both prokaryotes and eukaryotes are susceptible to environmental changes, especially abrupt drops in temperature (21–23). These DNA- and RNA-binding proteins are often considered to be transcriptional and/or translational regulatory proteins (24).
In the biological context, a complicated regulatory network consisting of numerous transcription factors and coregulators controls gluconeogenesis (25). Transcription factors or coregulators such as PGC-1α (26), forkhead box protein O1 (FOXO1) (27, 28), cAMP response element-binding protein-regulated transcription coactivator 2 (CRTC2) (29, 30) and HNF4 (31) can adapt to cellular nutrient status, as shown by changes in the expression of these proteins. The up-regulation or down-regulation of these transcription factors/coregulators has been shown to be important for normal cellular metabolism and function. Here, we identified that CARHSP1, as a stress-sensitive gene, is highly relevant to glucose metabolism. CARHSP1 protein expression is down-regulated after fasting and then returns to base line after refeeding for 6 h, which is not consistent with mRNA. To our knowledge, this may be due to increased protein stability and increased translation of CARHSP1 protein after refeeding. As a phosphoprotein, CARHSP1 is phosphorylated at multiple sites (7–9). Our data suggest that the 31–65 amino acid sequence located in the N-terminal domain, which is rich in phosphorylation sites, is necessary for CARHSP1 to inhibit PPARα activity (Fig. 7F). Although a transgenic CARHSP1 mouse line would be a much better model to study the exact role of CARHSP1 in an altered nutrient status, it is through acute agonism of CARHSP1 in this study that we investigated and demonstrated that CARHSP1 negatively regulates gluconeogenic gene expression.
The exact molecular mechanisms underlying the effects of CARHSP1 on hepatic glucose metabolism may be complicated. Here, we focused on gluconeogenesis and found that CARHSP1 suppresses the expression of gluconeogenic enzymes, including G6Pc and PEPCK1. These gluconeogenic enzymes are regulated at the transcriptional level by numerous gluconeogenesis-related transcription factors and coregulators (32–34). PPARα possesses properties and functions somewhat differently from the other two PPAR subtypes, PPARδ and PPARγ (35, 36). It is well known that PPARα has a central role in lipid oxidation (37, 38) and ketogenesis (39) in the liver. In addition, recent studies have revealed a link between PPARα and hepatic gluconeogenesis (18, 19, 40, 41). PPARα-deficient mice are hypoglycemic after fasting (42) and protected against high-fat diet-induced insulin resistance (43, 44). In addition, PPARα knockout mice show much higher levels of plasma free fatty acids compared with those of wild-type mice in the fasting state (45, 46). PPARα can modulate the synthesis of glucose from non-glucose substances through regulation of genes, including glycerol 3-phosphate dehydrogenase (GPDH) and glycerol kinase (41). However, little is known about whether PPARα directly regulates the expression of G6Pc and PEPCK1 in hepatocytes. We demonstrate that PPARα can bind to putative PPREs in both G6Pc and PEPCK1 promoters in human and mouse hepatocytes. Recently, Im et al. (18) reported results identical to ours by also showing that hepatic G6Pc is a PPARα target gene.
Although the role of PPARα in the liver is well dissected, the regulation of PPARα function remains unclear. In this study, we propose a hypothesis that in gluconeogenesis, CARHSP1 can modulate PPARα transcriptional activity and eventually interfere with its function. Actually, some coregulators have been identified to activate or suppress PPAR transcriptional activity, and these coregulators fulfill their function with tissue- or cell-specific properties (32, 33, 38). We demonstrate that CARHSP1 acts as a PPARα repressor, resulting in a dramatic reduction of PPARα transcriptional activity in hepatocytes. CARHSP1 binds to the 167–244 aa sequence of PPARα which is located in the PPARα hinge domain. Both the coactivator, PGC-1α, and the corepressor, N-CoR, can also bind to this particular PPARα domain (17, 47). Notably, CARHSP1 down-regulation of gluconeogenic genes is dependent on PPARα. Here, our study provides a link between CARHSP1 and the metabolic regulator, PPARα as well as providing further insight into the PPARα signaling network. PPARα has been recently reported to be up-regulated in db/db mice (18). Our findings that CARHSP1 is a repressor of PPARα and a regulator of hepatic gluconeogenic genes suggest a functional cooperation between CARHSP1 and PPARα in ameliorating insulin resistance in diabetic mice.
However, we must acknowledge that CARHSP1, in addition to its functional interaction with PPARα, may cross-talk with other nuclear transcription factors, such as FOXO1, cAMP response element-binding protein, and the glucocorticoid receptor. To further characterize the specificity of CARHSP1, we determined whether HNF4α is a CARHSP1-interacting transcription factor because HNF4α is known to be involved in gluconeogenesis. In this study, we demonstrate that CARHSP1 does not interact with HNF4α (Fig. 8). Future studies will address the potential for CARHSP1 to interact with other transcription factors. Nevertheless, our data suggest that CARHSP1, at the very least, is a specific repressor of PPARα.
Currently, the mechanisms underlying the regulation of CARHSP1 in the liver are under investigation. CARHSP1 is a substrate for activated Akt and other kinases in HEK293 cells (7), and we confirm that CARHSP1 can be phosphorylated by insulin. However, other modifications of CARHSP1 in the context of hepatic metabolism must be further studied in ensuing investigations to fully understand its function in the liver. Although gain of function models were used in this study to examine the function of CARHSP1 in hepatic gluconeogenesis, liver-selective CARHSP1 knockout mice will be essential in providing additional information regarding hepatic pathophysiological processes and molecular mechanisms. In conclusion, we show that CARHSP1 is a negative regulator of hepatic gluconeogenesis and an emerging novel therapeutic target relevant for the treatment of metabolic diseases.
Supplementary Material
This work was supported, in whole or in part, by National Institutes of Health Grants HL068878, HL105114, and HL089544 (to Y. E. C.). This work was also supported by American Heart Association Grants 10POST3270008 (Y. F.), 09SDG2230270 (L. C.), and 0835237N (J. Z.).

The on-line version of this article (available at http://www.jbc.org) contains supplemental Table S1.
- G6Pc
- glucose-6-phosphatase, catalytic subunit
- PEPCK
- phosphoenolpyruvate carboxykinase
- PEPCK1
- phosphoenolpyruvate carboxykinase 1 (soluble)
- Luc
- luciferase
- IP
- immunoprecipitation
- DEX
- dexamethasone
- PPARα
- peroxisome proliferator-activated receptor α
- PPRE
- PPAR-response element
- TK-RL
- thymidine kinase promoter-renilla luciferase
- m.o.i.
- multiplicity of infection
- aa
- amino acid.
REFERENCES
- 1. Boden G., Chen X., Stein T. P. (2001) Am. J. Physiol. Endocrinol. Metab. 280, E23–30 [DOI] [PubMed] [Google Scholar]
- 2. Perriello G., Pampanelli S., Del Sindaco P., Lalli C., Ciofetta M., Volpi E., Santeusanio F., Brunetti P., Bolli G. B. (1997) Diabetes 46, 1010–1016 [DOI] [PubMed] [Google Scholar]
- 3. Wajngot A., Chandramouli V., Schumann W. C., Ekberg K., Jones P. K., Efendic S., Landau B. R. (2001) Metabolism 50, 47–52 [DOI] [PubMed] [Google Scholar]
- 4. Biddinger S. B., Kahn C. R. (2006) Annu. Rev. Physiol. 68, 123–158 [DOI] [PubMed] [Google Scholar]
- 5. Quinn P. G., Yeagley D. (2005) Curr. Drug Targets Immune Endocr. Metabol. Disord. 5, 423–437 [DOI] [PubMed] [Google Scholar]
- 6. Groblewski G. E., Yoshida M., Bragado M. J., Ernst S. A., Leykam J., Williams J. A. (1998) J. Biol. Chem. 273, 22738–22744 [DOI] [PubMed] [Google Scholar]
- 7. Auld G. C., Campbell D. G., Morrice N., Cohen P. (2005) Biochem. J. 389, 775–783 [DOI] [PMC free article] [PubMed] [Google Scholar]
- 8. Schäfer C., Steffen H., Krzykowski K. J., Göke B., Groblewski G. E. (2003) Am. J. Physiol. Gastrointest. Liver Physiol. 285, G726–734 [DOI] [PubMed] [Google Scholar]
- 9. Lee S., Wishart M. J., Williams J. A. (2009) Biochem. Biophys. Res. Commun. 385, 413–417 [DOI] [PMC free article] [PubMed] [Google Scholar]
- 10. Freeman W. M., Bixler G. V., Brucklacher R. M., Lin C. M., Patel K. M., Vanguilder H. D., Lanoue K. F., Kimball S. R., Barber A. J., Antonetti D. A., Gardner T. W., Bronson S. K. (2009) Pharmacogenomics J. 10, 385–395 [DOI] [PubMed] [Google Scholar]
- 11. Pfeiffer J. R., McAvoy B. L., Fecteau R. E., Deleault K. M., Brooks S. A. (2011) Mol. Cell. Biol. 31, 277–286 [DOI] [PMC free article] [PubMed] [Google Scholar]
- 12. Hou H., Wang F., Zhang W., Wang D., Li X., Bartlam M., Yao X., Rao Z. (2011) J. Biol. Chem. 286, 9623–9635 [DOI] [PMC free article] [PubMed] [Google Scholar]
- 13. Xu J., Xiao G., Trujillo C., Chang V., Blanco L., Joseph S. B., Bassilian S., Saad M. F., Tontonoz P., Lee W. N., Kurland I. J. (2002) J. Biol. Chem. 277, 50237–50244 [DOI] [PubMed] [Google Scholar]
- 14. Rodgers J. T., Haas W., Gygi S. P., Puigserver P. (2010) Cell Metab. 11, 23–34 [DOI] [PMC free article] [PubMed] [Google Scholar]
- 15. Hall R. K., Granner D. K. (1999) J. Basic Clin. Physiol. Pharmacol. 10, 119–133 [DOI] [PubMed] [Google Scholar]
- 16. Hanson R. W., Reshef L. (1997) Annu. Rev. Biochem. 66, 581–611 [DOI] [PubMed] [Google Scholar]
- 17. Vega R. B., Huss J. M., Kelly D. P. (2000) Mol. Cell. Biol. 20, 1868–1876 [DOI] [PMC free article] [PubMed] [Google Scholar]
- 18. Im S. S., Kim M. Y., Kwon S. K., Kim T. H., Bae J. S., Kim H., Kim K. S., Oh G. T., Ahn Y. H. (2011) J. Biol. Chem. 286, 1157–1164 [DOI] [PMC free article] [PubMed] [Google Scholar]
- 19. Bernal-Mizrachi C., Weng S., Feng C., Finck B. N., Knutsen R. H., Leone T. C., Coleman T., Mecham R. P., Kelly D. P., Semenkovich C. F. (2003) Nat. Med. 9, 1069–1075 [DOI] [PubMed] [Google Scholar]
- 20. Xu H. E., Stanley T. B., Montana V. G., Lambert M. H., Shearer B. G., Cobb J. E., McKee D. D., Galardi C. M., Plunket K. D., Nolte R. T., Parks D. J., Moore J. T., Kliewer S. A., Willson T. M., Stimmel J. B. (2002) Nature 415, 813–817 [DOI] [PubMed] [Google Scholar]
- 21. Nakaminami K., Karlson D. T., Imai R. (2006) Proc. Natl. Acad. Sci. U.S.A. 103, 10122–10127 [DOI] [PMC free article] [PubMed] [Google Scholar]
- 22. Schindelin H., Jiang W., Inouye M., Heinemann U. (1994) Proc. Natl. Acad. Sci. U.S.A. 91, 5119–5123 [DOI] [PMC free article] [PubMed] [Google Scholar]
- 23. Phadtare S., Alsina J., Inouye M. (1999) Curr. Opin. Microbiol 2, 175–180 [DOI] [PubMed] [Google Scholar]
- 24. Zeeb M., Balbach J. (2003) Protein Sci. 12, 112–123 [DOI] [PMC free article] [PubMed] [Google Scholar]
- 25. Chawla A., Repa J. J., Evans R. M., Mangelsdorf D. J. (2001) Science 294, 1866–1870 [DOI] [PubMed] [Google Scholar]
- 26. Yoon J. C., Puigserver P., Chen G., Donovan J., Wu Z., Rhee J., Adelmant G., Stafford J., Kahn C. R., Granner D. K., Newgard C. B., Spiegelman B. M. (2001) Nature 413, 131–138 [DOI] [PubMed] [Google Scholar]
- 27. Aoyama H., Daitoku H., Fukamizu A. (2006) Int. J. Mol. Med. 18, 433–439 [PubMed] [Google Scholar]
- 28. Puigserver P., Rhee J., Donovan J., Walkey C. J., Yoon J. C., Oriente F., Kitamura Y., Altomonte J., Dong H., Accili D., Spiegelman B. M. (2003) Nature 423, 550–555 [DOI] [PubMed] [Google Scholar]
- 29. Kaestner K. H. (2008) Cell Metab. 8, 449–451 [DOI] [PubMed] [Google Scholar]
- 30. Liu Y., Dentin R., Chen D., Hedrick S., Ravnskjaer K., Schenk S., Milne J., Meyers D. J., Cole P., Yates J., 3rd, Olefsky J., Guarente L., Montminy M. (2008) Nature 456, 269–273 [DOI] [PMC free article] [PubMed] [Google Scholar]
- 31. Dietrich C. G., Martin I. V., Porn A. C., Voigt S., Gartung C., Trautwein C., Geier A. (2007) Am. J. Physiol. Gastrointest. Liver Physiol. 293, G585–590 [DOI] [PubMed] [Google Scholar]
- 32. Barthel A., Schmoll D. (2003) Am. J. Physiol. Endocrinol. Metab. 285, E685–692 [DOI] [PubMed] [Google Scholar]
- 33. Puigserver P., Spiegelman B. M. (2003) Endocr. Rev. 24, 78–90 [DOI] [PubMed] [Google Scholar]
- 34. Wang Y., Vera L., Fischer W. H., Montminy M. (2009) Nature 460, 534–537 [DOI] [PMC free article] [PubMed] [Google Scholar]
- 35. Jay M. A., Ren J. (2007) Curr. Diabetes Rev. 3, 33–39 [DOI] [PubMed] [Google Scholar]
- 36. Evans R. M., Barish G. D., Wang Y. X. (2004) Nat. Med. 10, 355–361 [DOI] [PubMed] [Google Scholar]
- 37. Hsu M. H., Savas U., Griffin K. J., Johnson E. F. (2001) J. Biol. Chem. 276, 27950–27958 [DOI] [PubMed] [Google Scholar]
- 38. Aoyama T., Peters J. M., Iritani N., Nakajima T., Furihata K., Hashimoto T., Gonzalez F. J. (1998) J. Biol. Chem. 273, 5678–5684 [DOI] [PubMed] [Google Scholar]
- 39. Rodríguez J. C., Gil-Gómez G., Hegardt F. G., Haro D. (1994) J. Biol. Chem. 269, 18767–18772 [PubMed] [Google Scholar]
- 40. Koo S. H., Satoh H., Herzig S., Lee C. H., Hedrick S., Kulkarni R., Evans R. M., Olefsky J., Montminy M. (2004) Nat. Med. 10, 530–534 [DOI] [PubMed] [Google Scholar]
- 41. Patsouris D., Mandard S., Voshol P. J., Escher P., Tan N. S., Havekes L. M., Koenig W., März W., Tafuri S., Wahli W., Müller M., Kersten S. (2004) J. Clin. Invest. 114, 94–103 [DOI] [PMC free article] [PubMed] [Google Scholar]
- 42. Kersten S., Seydoux J., Peters J. M., Gonzalez F. J., Desvergne B., Wahli W. (1999) J. Clin. Invest. 103, 1489–1498 [DOI] [PMC free article] [PubMed] [Google Scholar]
- 43. Guerre-Millo M., Rouault C., Poulain P., Andre J., Poitout V., Peters J. M., Gonzalez F. J., Fruchart J. C., Reach G., Staels B. (2001) Diabetes 50, 2809–2814 [DOI] [PubMed] [Google Scholar]
- 44. Tordjman K., Bernal-Mizrachi C., Zemany L., Weng S., Feng C., Zhang F., Leone T. C., Coleman T., Kelly D. P., Semenkovich C. F. (2001) J. Clin. Invest. 107, 1025–1034 [DOI] [PMC free article] [PubMed] [Google Scholar]
- 45. Lam T. K., van de Werve G., Giacca A. (2003) Am. J. Physiol. Endocrinol. Metab. 284, E281–290 [DOI] [PubMed] [Google Scholar]
- 46. Chen X., Iqbal N., Boden G. (1999) J. Clin. Invest. 103, 365–372 [DOI] [PMC free article] [PubMed] [Google Scholar]
- 47. Dowell P., Ishmael J. E., Avram D., Peterson V. J., Nevrivy D. J., Leid M. (1999) J. Biol. Chem. 274, 15901–15907 [DOI] [PubMed] [Google Scholar]
Associated Data
This section collects any data citations, data availability statements, or supplementary materials included in this article.


