Background: The bacterial sodium-translocating NADH:ubiquinone oxidoreductase (Na+-NQR) is a redox-driven Na+ pump.
Results: Its NqrA subunit provides the binding site for the final electron acceptor ubiquinone.
Conclusion: Ubiquinone binding assigns a first functional role to the peripheral NqrA subunit in the enzymatic mechanism of Na+-NQR.
Significance: With the ubiquinone binding site, the binding site for the second substrate has been identified in Na+-NQR.
Keywords: Bioenergetics, Electron Transfer, Flavoproteins, Membrane Enzymes, Respiratory chain, Sodium Transport, Ubiquinone, Membrane Protein Complex, Redox Enzyme, Sodium Ion Pump
Abstract
Na+ is the second major coupling ion at membranes after protons, and many pathogenic bacteria use the sodium-motive force to their advantage. A prominent example is Vibrio cholerae, which relies on the Na+-pumping NADH:quinone oxidoreductase (Na+-NQR) as the first complex in its respiratory chain. The Na+-NQR is a multisubunit, membrane-embedded NADH dehydrogenase that oxidizes NADH and reduces quinone to quinol. Existing models describing redox-driven Na+ translocation by the Na+-NQR are based on the assumption that the pump contains four flavins and one FeS cluster. Here we show that the large, peripheral NqrA subunit of the Na+-NQR binds one molecule of ubiquinone-8. Investigations of the dynamic interaction of NqrA with quinones by surface plasmon resonance and saturation transfer difference NMR reveal a high affinity, which is determined by the methoxy groups at the C-2 and C-3 positions of the quinone headgroup. Using photoactivatable quinone derivatives, it is demonstrated that ubiquinone-8 bound to NqrA occupies a functional site. A novel scheme of electron transfer in Na+-NQR is proposed that is initiated by NADH oxidation on subunit NqrF and leads to quinol formation on subunit NqrA.
Introduction
Vibrio cholerae is a water-borne bacterium that causes the diarrheal disease cholera. In the marine environment, the organism relies on the generation and utilization of a sodium motive force for motility and uptake of certain substrates (1). A central player in the sodium ion cycle across the inner bacterial membrane of V. cholerae is the Na+-pumping NADH:quinone oxidoreductase (Na+-NQR),4 which transports Na+ ions upon the oxidation of NADH by ubiquinone (Q). The Na+-NQR is a respiratory NADH dehydrogenase that is not related to complex I of mitochondria or bacteria. It is composed of six subunits (NqrA–F) and harbors at least five redox carriers: a non-covalently bound FAD and a 2Fe-2S cluster in the peripheral NqrF subunit, an FMN that is covalently bound to the peripheral NqrC subunit, and a second covalently bound FMN plus a non-covalently bound riboflavin found in the membranous NqrB subunit (2–5). The site for NADH oxidation has been identified in the vicinity of the FAD on NqrF (6). Upon hydride transfer from NADH to FAD, electrons are proposed to be transferred from FAD via the 2Fe-2S cluster to FMN on NqrC, FMN on NqrB, and finally, to riboflavin on NqrB (5, 7, 8). So far, binding site(s) for ubiquinone in the Na+-NQR have not been localized, but it was proposed that the riboflavin cofactor directly reduces substrate quinone (7). We previously reported that reduction of native membranes from V. cholerae with NADH resulted in the formation of one-electron reduced quinones (ubisemiquinones) (9). The amount of ubisemiquinones observed was influenced by the concentration of the coupling cation, Na+, and we proposed that enzyme-bound ubiquinone-8 (Q8) participates in the overall electron transfer reaction of the Na+-NQR (9). Knowledge of the Q binding site of Na+-NQR is a prerequisite to follow the pathway of electrons through the complex, to describe the mode of Q binding, and to understand how the overall exergonic formation of ubiquinol is linked to the endergonic translocation of Na+ across the bacterial membrane. In the present study, we identify and characterize a quinone binding site on subunit NqrA of Na+-NQR and propose a novel scheme of intramolecular redox events in this respiratory enzyme.
EXPERIMENTAL PROCEDURES
Purification of Na+-NQR and Subunit NqrA
Na+-NQR encoded on plasmid pNQR1 (4) and subunit NqrA encoded on plasmid pNA1 (5) were produced in V. cholerae O395 N1 Δnqr (4). Na+-NQR containing NqrA with six N-terminal histidine residues was purified by nickel affinity chromatography followed by gel filtration in the presence of 0.05% (by weight) n-dodecyl-β-d-maltoside (DDM) (4). To purify His6-NqrA, washed cells (25 g) were suspended in 50 mm sodium phosphate, pH 8.0, 500 mm NaCl, 5 mm MgCl2, 5 mm Tris(2-carboxyethyl)phosphine-HCl, 1 mm phenylmethylsulfonyl fluoride, and 0.23 mm diisopropylfluorophosphate and passed twice through a French pressure cell at 7.58 megapascals. Immediately, another 0.23 mm diisopropylfluorophosphate was added to the cell extract, which was centrifuged at 200,000 × g for 30 min. The supernatant was diluted to a final NaCl concentration of 300 mm with 42 mm sodium phosphate buffer, pH 8.0, 12.6% (by volume) glycerol, 12 mm imidazole and loaded onto an Ni-NTA agarose column (Qiagen) equilibrated with buffer A (50 mm sodium phosphate, pH 8.0, 300 mm NaCl, 5% (by volume) glycerol) containing 5 mm imidazole. A linear gradient from 30 to 200 mm led to the elution of NqrA at 140 mm imidazole. Monomeric NqrA was separated from NqrA aggregates on a Superdex 200 16/60 (GE Healthcare) column in 50 mm phosphate buffer, pH 8.0, 300 mm NaCl, 5% glycerol, and 4 mm NaN3.
Extraction and Analysis of Quinones
Quinones from V. cholerae membranes were extracted with chloroform/methanol (10). To determine the quinone content of proteins, 1 ml containing at least 0.1 mg of protein was vigorously mixed with 3 ml of methanol and 5 ml of n-hexane for 30 s. Phases were separated by centrifugation (1900 × g, 4 °C). The organic phase was collected, and the aqueous phase was extracted thrice with 5 ml of n-hexane. Organic phases were combined, and the solvent was evaporated in a SpeedVac system. The pellet containing quinones was dissolved in ethanol, filtered through a 0.22-μm PVDF membrane, and analyzed by HPLC (supplemental methods and supplemental Fig. S1) and mass spectroscopy (supplemental Fig. S2).
Reconstitution of Na+-NQR and NqrA with Quinones
Barquera et al. (11) reported that Na+-NQR from V. cholerae solubilized with 1% lauryldimethylamine N-oxide (LDAO) did not contain Q8. We observed that 0.1% LDAO was sufficient to quantitatively remove Q8 (supplemental Fig. S2). DDM-solubilized Na+-NQR bound to the Ni-NTA affinity column was washed with 10 column volumes of buffer A containing 0.1% LDAO and 5 mm imidazole. Q8-free Na+-NQR was eluted with 0.05% DDM and 50 mm imidazole in buffer A. The presence of all six subunits in the Q8-depleted Na+-NQR was confirmed by SDS-PAGE. Incorporation of artificial quinones into Q-free Na+-NQR or into NqrA was achieved by binding the proteins to the Ni-NTA column. Ten column volumes of buffer A containing 0.05% DDM, 5 mm imidazole, and 15 μm of the respective quinone were passed over the column followed by 10 washing steps with quinone-free buffer. The reconstituted Na+-NQR or NqrA was eluted with 50 mm imidazole.
Photoaffinity Labeling of Na+-NQR and NqrA with Azido-Q Derivatives
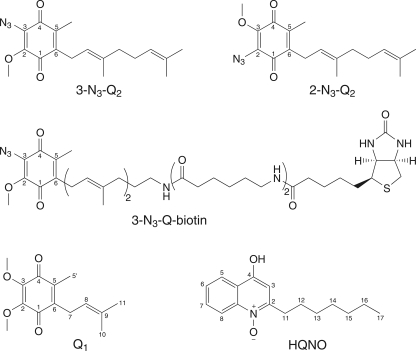
Photoreactive azido-Qs possessing a biotin at the terminus of the side chain (see Fig. 1) were recently introduced for the specific labeling of a Q binding site in the alternative, non-electrogenic NADH dehydrogenase (Ndi1) from Saccharomyces cerevisiae (12). The structures of 3-azido-2-methoxy-5-methyl-6-geranyl-1,4-benzoquinone (3-N3-Q2), 2-azido-3-methoxy-5-methyl-6-geranyl-1,4-benzoquinone (2-N3-Q2), and biotinylated 3-N3-Q2 (3-N3-Q-biotin) used in this work are shown in Fig. 1 (12). Na+-NQR or NqrA in 10 mm HEPES/NaOH, pH 8.0, 5% glycerol, 300 mm NaCl, 0.05% DDM was incubated with the quinone or the corresponding Q derivative for 30–60 min on ice in the dark. In a typical experiment, Na+-NQR (0.16 mg in 0.16 ml of buffer, or 4.8 μm) was mixed with 1.5 μl of the quinone stock solution (1 mm in ethanol; final concentration in the reaction mixture 9.4 μm) in the darkroom. The sample was transferred to a quartz cuvette and illuminated with a 6-watt 365 nm UV lamp (Bachofer-Laboratoriumsgeräte) at 4 °C for the indicated times. Biotinylated proteins were detected by Western blot analysis using a Strep-Tactin horseradish peroxidase conjugate according to the procedures described by the supplier (IBA GmbH). The intensity of the NqrA band was quantified with the software Quantity One (Bio-Rad).
FIGURE 1.
The structures of quinones and quinone derivatives used in this work. The structures of 2-N3-Q2, 3-N3-Q2, and its biotinylated derivative, 3-N3-Q2-biotin are shown, as well as Q1 and HQNO.
Enzymatic Activity
NADH oxidation and quinone reduction by Na+-NQR were followed simultaneously under anoxic conditions at room temperature (4). To investigate the effect of endogenous Q8 on enzymatic activity, NADH oxidation and Q reduction rates were determined with three preparations of the complex. An aliquot from each preparation was treated with LDAO, and the activities prior to and after removal of Q8 were compared. To study inactivation by modification with azido-quinones, Na+-NQR (3 μm) was incubated with a 100-fold molar excess of 3-N3-Q2, 2-N3-Q2, or Q2 for 1 h at 0 °C in the dark under anoxic conditions. Modification was initiated by illumination at 365 nm (4 °C). At the indicated time points, aliquots were analyzed for enzymatic activity.
Analytical Methods
Protein quantification, SDS-PAGE and immunochemical detection of His6-NqrA were performed as described (5). For MALDI-MS analyses of Na+-NQR subunits, the complex was precipitated by TCA and resuspended in hexafluoropropanol:formic acid (1:2). Aliquots were diluted 1:10 with matrix (saturated sinapinic acid in 0.1% trifluoroacetic acid, 50% acetonitrile) and analyzed in linear mode on a Bruker Ultraflex II TOF-TOF instrument. Circular dichroism spectra were obtained at 25 °C with a JASCO 715 spectropolarimeter using quartz cuvettes (Hellma AG) with 1-mm path length. The CD spectra were recorded with 1-nm step width, 20 nm min−1 scanning speed, 2-nm excitation bandwidth, and 4-s response time. Each spectrum was averaged at least twice, corrected by subtracting the spectrum of the buffer or ubiquinone-1 (Q1) in buffer, and further processed with the Savitzky-Golay filter. Q1 exhibited a weak CD signal in the region from 185 to 200 nm, which did not interfere with the effects observed upon the addition of Q1 to NqrA. Secondary structure fractions were calculated by deconvolution of the CD data at the DichroWeb server (13, 14) using reference set 4 of the CDSSTR algorithm (15).
Surface Plasmon Resonance
SPR experiments were performed on a Biacore T100 instrument. NqrA was diluted in 10 mm acetate buffer at pH 5.4 to 1 μm and coupled to the activated CM5 sensor chip surface (GE Healthcare) by standard procedures. This included blocking of the sensor surface with ethanolamine after immobilization of NqrA. The immobilization level was 16,500 RU. Q1 and 2-n-heptyl-4-hydroxyquinoline N-oxide (HQNO) were diluted with PBS (10 mm Pi, 150 mm NaCl, pH 8.0) from 20 mm stock solutions in DMSO to a concentration of 200 μm, resulting in a final DMSO content of 1%. These solutions served as starting points of 1:1 dilution series leading to concentrations of 100.0, 50.0, 25.0, 12.5, 6.25, 3.13, 1.56, 0.78, 0.39, 0.20, and 0.098 μm. Biosensor assays were carried out at 298 K, with 1% DMSO in PBS as running buffer, at a flow rate of 10 μl/min and a data collection rate of 10 Hz. For each dilution, 85 μl of Q1 or HQNO solution was injected, leading to an association time of 500 s. Dissociation was monitored for 500 s. After every injection, one regeneration injection was applied (1 m NaCl, 1% DMSO, 60 s). Sensorgrams were analyzed with Biacore T100 Control (v1.1), Biacore T100 Evaluation (v1.1), and Origin 8. This included reference cell and buffer subtraction. Each concentration was measured in duplicates from independent dilution series.
Steady-state binding levels obtained from these dilution series were subjected to non-linear least squares fitting within Origin 8. Dissociation constants (KD) were determined by globally fitting all data points to one-site (RU(c) = RUmax × c/(KD+c)) and two-site (RU(c) = RUmax1 × c/(KD1+c) + RUmax2 × c/(KD2+c)) binding isotherms, respectively. In the latter case, RUmax1 of the high affinity interaction was optimized first. Subsequently, RUmax2 was set to the same value and kept fixed assuming the same maximum response when saturating one or the other binding site.
NMR Spectroscopy
Monomeric NqrA from gel filtration was transferred to D2O containing 10 mm potassium phosphate, pH 8.0, 150 mm NaCl, 4 mm NaN3 (PBS buffer) by repeated (at least 5-fold) ultrafiltration with Ultrafree-4 membranes (Millipore; molecular mass cut-off, 10 kDa). To 10 μm NqrA, Q1, HQNO, or riboflavin was added from 20 mm stock solutions in DMSO-d6 to a final concentration of 100 μm, and the sample was transferred to a 5-mm NMR tube. Controls were prepared with PBS buffer without NqrA. To assign the resonances of Q1, HQNO, and riboflavin, 1H, 1H-13C-HSQC, 1H-13C-HMBC, and two-dimensional-NOE spectroscopy NMR spectra were recorded at 300 K on a Bruker DRX 600-MHz spectrometer equipped with a 5-mm TXI-H/C/N-triple resonance probe. Spectra were referenced to the residual HDO signal at 4.707 ppm. Chemical shifts are given in supplemental Table S1. One-dimensional saturation transfer difference (STD) NMR spectra (16) were recorded on a Bruker AVANCE III 600-MHz spectrometer equipped with a cryogenic 5-mm TCI-H/C/N triple resonance probe with actively shielded z-gradient. Water suppression was achieved by excitation sculpting (17). Resonances of NqrA were saturated by applying a train of low power Gaussian-shaped pulses at 0.2 ppm with a total saturation time of 2 s. Off-resonance irradiation was set to 33 ppm. On- and off-resonance spectra were acquired in an interleaved manner and subtracted after processing. Up to 4096 transients were collected at a spectral width of 12 ppm. Spectra were processed and analyzed with the software TopSpin (Bruker; v2.1). The percentage of STD effects was determined within the multiple display mode by scaling the off-resonance spectrum down to superimpose with the signal of interest in the difference (off-on) spectrum.
RESULTS
Binding of Quinones to Na+-NQR
The interactions of the Na+-NQR with quinones and quinone derivatives (Fig. 1) were investigated. We first analyzed the quinone content of this membrane protein complex by HPLC. Na+-NQR purified in the presence of DDM contained 0.61 ± 0.04 mol of Q8 mol−1 Na+-NQR (n = 3). A typical HPLC chromatogram is shown in supplemental Fig. S1. The identity of Q8 extracted from the Na+-NQR was confirmed by ESI-MS analysis (supplemental Fig. S2). Detergent exchange with LDAO completely removed Q8 from the complex (supplemental Fig. S1) without a significant effect on its Q reduction activity (23.5 ± 3.8 units mg−1 in the presence of enzyme-bound Q8 as compared with 19.1 ± 0.2 units mg−1 in the absence of enzyme-bound Q8; n = 3). Na+-NQR lacking Q8 showed a slight decrease in NADH oxidation rates (47.9 ± 3.5 units mg−1) as compared with complex containing Q8 (62.6 ± 0.9 units mg−1). This indicated that Q1 at a concentration of 100 μm in the assay replaced Q8, most likely by binding to a Q site of the complex. To test the latter hypothesis, the Q8-depleted Na+-NQR, which was bound to a metal affinity column, was allowed to react with Q1 or Q2. Upon elution of the enzyme with buffer containing 0.1% DDM, these short-chain quinones were found to be associated with Na+-NQR at a molar ratio of 0.54, which was comparable with the initial amount of endogenous Q8 (supplemental Fig. S3, A and B). We also investigated the interaction of Q8-depleted Na+-NQR with the Q2 derivatives 2-N3-Q2 and 3-N3-Q2, which carry an azido group at the C-2 and C-3 carbon of the quinone head group, respectively, replacing the methoxy group (Fig. 1). Although 3-N3-Q2 was incorporated to a molar ratio (0.51) comparable with the one observed with Q1 and Q2, only 0.10 mol of 2-N3-Q2 was found per mol of Na+-NQR (supplemental Fig. S3C).
Quinone Binding Site on Subunit NqrA of the Na+-NQR
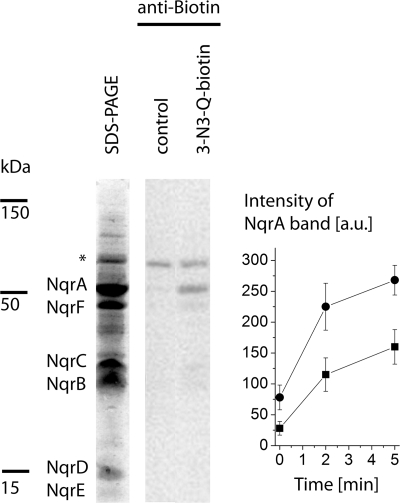
We next used a biotinylated quinone derivative (3-N3-Q-biotin, Fig. 1) to identify a subunit of Na+-NQR interacting with quinones. Photocross-linking in the presence of 1–2 equivalents of 3-N3-Q-biotin resulted in the specific labeling of a protein with an approximate mass of 50 kDa (Fig. 2). It represented subunit NqrA, as confirmed by immunostaining using an antibody specific for the N-terminal polyhistidine tag. In addition, the biotinylated α-subunit of the oxaloacetate decarboxylase from V. cholerae with a mass of 65 kDa was detected (18). To test whether 3-N3-Q-biotin competes with Q8 for binding to NqrA, the photocross-linking of the Na+-NQR complexes purified in DDM (with stoichiometric Q8) and in LDAO (no Q8 present) was compared. Both the rate of modification and the final yield of biotin-modified NqrA were decreased with Q8-containing Na+-NQR by ∼50% (Fig. 2). This demonstrated that 3-N3-Q-biotin interacted with a specific Q binding site of subunit NqrA. Please note that the yield of photolabeling is less than 10% (12). Therefore, a major fraction of Q-sites occupied by 3-N3-Q-biotin will not undergo covalent modification.
FIGURE 2.
Modification of a Q binding site on subunit NqrA of the Na+-NQR with biotinylated azido-quinone. Left lane, SDS-PAGE of Na+-NQR (20 μg) after affinity chromatography. Middle and right lanes, detection of biotin by immunostaining using Strep-Tactin-HRP-conjugated antibodies. Na+-NQR containing 0.7 mol of Q8 mol−1 was illuminated for 10 min in the absence (middle lane, control) or in the presence of 3-N3-Q-biotin (right lane). The asterisk indicates the biotinylated α-subunit of the oxaloacetate decarboxylase. Right panel, time course of modification of NqrA with 3-N3-Q-biotin during illumination. The modification of Na+-NQR containing 0.7 mol of Q8 mol−1 (squares) and Q8-depleted Na+-NQR (circles) is compared. Mean values are presented (n = 2). Error bars indicate S.D. a.u., arbitrary units.
Mass Shift of NqrA after Modification with 3-N3-Q2
Na+-NQR, which had been illuminated in the presence of 3-N3-Q2, was analyzed by MALDI-MS, and its spectrum was compared with a spectrum of Na+-NQR, which was illuminated in the presence of Q1 (supplemental Fig. S4 and Table 1). Masses assigned to NqrE, NqrD, NqrC with its bound FMN, NqrB devoid of FMN, and NqrF lacking the 2Fe-2S cluster were detected in both samples. In the MS spectra of 3-N3-Q2-treated Na+-NQR, none of the signals was clearly shifted by 300 Da, as would be expected for covalent modification with azido-Q2 (19). However, peak j at 50,793 Da observed in Q1-treated Na+-NQR, which was assigned to NqrA (calculated mass, 50,660 Da), was not observed in 3-N3-Q2-treated Na+-NQR. On the other hand, peak k at 50,904 Da, which did not correspond to a calculated mass of any of the Nqr subunits, was shifted to higher m/z (51,020 Da) upon modification with 3-N3-Q2 (supplemental Fig. S4). These results suggested that some modification of NqrA by 3-N3-Q2 had occurred, in accord with the observed labeling of NqrA with biotinylated 3-N3-Q2. We did not detect a protein with the calculated mass of NqrA, m/z = 50,660 after the control reaction, which was performed in the presence of Q2. Obviously, NqrA experienced further chemical modifications either during photolabeling or during the MALDI ionization process. These modifications may very well be different for NqrA+Q1 as compared with NqrA+Azido-Q2. Nevertheless, the signals of ∼50,000 were the only ones affected by our photochemical labeling experiment, indicating that only NqrA was being labeled by the azido-quinone.
TABLE 1.
Masses of protein species observed in Na+-NQR after labeling with 3-N3-Q2
Calculated m/z values are compared with the observed values. Peaks a–l denote species observed in the MALDI-MS spectra of the Na+-NQR, which was incubated with Q1 in the control reaction (see supplemental Fig. S4).
| Peak | Measured mass |
Predicted protein species | Calculated massa | |
|---|---|---|---|---|
| +Q1 | + 3-N3-Q2 | |||
| kDa | kDa | kDa | ||
| a | 21.52 | 21.51 | NqrE | 21.47 |
| b | 22.73 | 22.73 | NqrDb | 22.71 |
| c | 22.97 | 23.02 | NAc | |
| d | 23.20 | 23.28 | NAc | |
| e | 28.00 | 27.96 | [NqrC + FMN]+ | 27.93 |
| f | 28.24 | 28.26 | NAc | |
| g | 28.44 | 28.52 | NAc | |
| h | 45.22 | 45.21 | [NqrF − 2Fe-2S]+ | 45.10 |
| i | 45.41 | 45.44 | [NqrB − FMN]+ | 45.36 |
| j | 50.79 | NqrA | 50.66 | |
| k | 50.90 | 51.02 | NAc | |
| l | 53.24 | 53.16 | NAc | |
a Calculated mass of the predicted protein species. Met-1 is omitted for NqrA, NqrB, NqrC, and NqrD. NqrE and NqrF are assumed to be N-formylated. Modification by FMN and N-formyl increase the calculated mass by 439 Da and 28 Da, respectively.
b The m/z values of peak b would also match with the M2+ species of [NqrB-FMN], with a difference of 0.05 kDa.
c NA, not assigned. The m/z ratio corresponding to these peaks cannot be assigned to any Nqr subunit or combinations of different Nqr subunits.
Inactivation of Na+-NQR by Photocross-linking with Azido-Q2
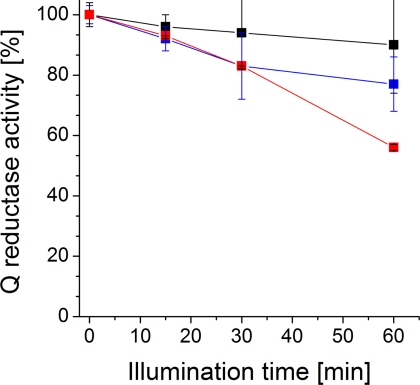
To investigate the functional role of the quinone localized on subunit NqrA, we studied the effect of covalent modification of the Na+-NQR with azido-Q2 on enzymatic activity. The specific Q reductase activity of the Na+-NQR, which was allowed to react with 3-N3-Q2 for 60 min, decreased to 55% (9.1 ± 0.2 μmol min−1 mg−1) of the initial value (16.9 ± 0.7 μmol min−1 mg−1) (Fig. 3). Note that the difference in mean activity after a 60-min illumination of the 3-N3-Q2-treated NQR versus the untreated control was statistically significant, with p = 0.0046 (Student's t test, 95% confidence interval). Some minor inhibition (10%) was observed with Na+-NQR illuminated in the presence of Q2, which probably was caused by photolysis of flavins (20). HQNO (Fig. 1) is an inhibitor of Na+-NQR that prevents the binding of Q to the enzyme (21). In a parallel reaction performed with a 100-fold molar excess of HQNO, Na+-NQR was inhibited by 45%. Interestingly, 2-N3-Q2 inactivated the Na+-NQR by only 20%, indicating that the azido group at the C-2 position of the quinone head group obstructed the binding of this Q derivative to NqrA. This is in accord with the observation that reconstitution of Q8-depleted Na+-NQR was significantly less efficient with 2-N3-Q2 (0.10 mol mol−1) than with 3-N3-Q2 (0.51 mol mol−1) (supplemental Fig. S3, A and B). We conclude that modification of NqrA with 3-N3-Q2 occurs at a site that, in the native enzyme, harbors at least one molecule of Q8 participating in electron transfer from NADH to Q1.
FIGURE 3.
Inactivation of Na+-NQR by modification with 3-N3-Q2. Relative quinone reductase activities as compared with the activity prior to illumination (100% at t = 0 min) are presented (n = 2; S.D.). Black trace, control reaction with Q2; blue trace, 2-N3-Q2; red trace, 3-N3-Q2.
Binding of Quinones to NqrA
We next investigated the interaction of NqrA with Q in the absence of other Nqr subunits. HPLC analyses of organic extracts of purified NqrA revealed only traces of endogenous Q8 (∼0.01 mol of Q8 per mol of NqrA). This residual Q8 was removed by treatment with LDAO, and the protein was allowed to react with Q1 or Q2 as described for the Na+-NQR complex. Q1 and Q2 were incorporated into NqrA at molar ratios of 0.77 and 0.27 mol of quinone per mol of NqrA, respectively. The efficiency of reconstitution was clearly diminished with the more hydrophobic Q2. NqrA illuminated in the presence of 2 equivalents of 3-N3-Q-biotin was specifically labeled, as demonstrated by Western blot analysis.
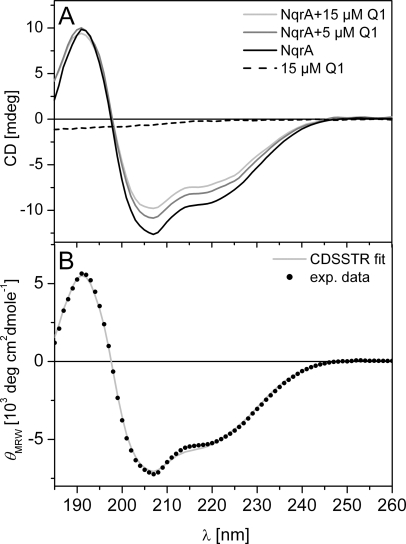
Binding of Q1 to NqrA was further confirmed by circular dichroism spectroscopy (Fig. 4). The addition of 15 μm Q1 to NqrA led to an increase in ellipticity of ∼210 nm, which could indicate a decrease of the α-helical content from 15% in the absence of Q1 to 7% in the presence of Q1. As expected, Q1 (15 μm) exhibited no features in the CD spectrum (Fig. 4). Note that the changes in the CD of ∼210 nm would also be consistent with a change in interhelical angles in NqrA upon binding of Q1 (22).
FIGURE 4.
Binding of Q1 to NqrA monitored by circular dichroism spectroscopy. A, NqrA (3.7 μm or 0.18 mg ml−1) in the presence of 0, 5, and 15 μm Q1. Dashed line, CD spectrum of 15 μm Q1 in 10 mm sodium phosphate, pH 8.0, 0.004% (by weight) DDM. mdeg, millidegrees. B, the spectrum of NqrA in the absence of Q1 was fitted using the CDSSTR algorithm. exp. data, experimental data. MRW, mean residue weight.
Affinity of Q1 and HQNO to NqrA
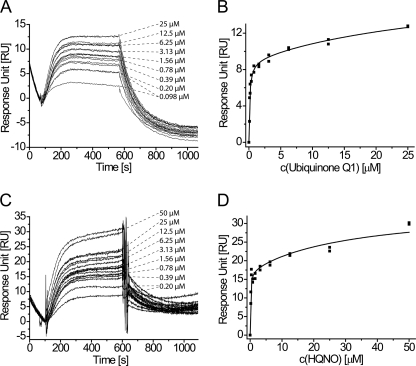
To support our results obtained by photochemical labeling and CD spectroscopy, we determined the affinity of the NqrA subunit toward ubiquinone Q1 and to the well known inhibitor HQNO by surface plasmon resonance (Biacore). For this purpose, NqrA was immobilized on a CM5 sensor chip, and Q1 and HQNO served as soluble analytes. This assay setup allows for characterizing the interaction of chemically unmodified small molecule ligands with NqrA; however, for sensitivity reasons, very high immobilization levels of the NqrA protein were necessary. Even with 16,500 RU of immobilized NqrA, we obtained maximum responses ∼9–17 RU (for one binding site). For a soluble analyte of 250-Da molecular mass, the maximum theoretical response would be 80 RU. According to this, approximately one-fifth to one-ninth of NqrA was accessible to ubiquinone and functional in our SPR assay. The sensorgrams of both Q1 and HQNO indicate significant binding to NqrA already at concentrations below 1 μm (Fig. 5, A and C). The high immobilization level of NqrA precludes kinetic analysis of the sensorgrams because of mass transport limitation and rebinding effects. We determined the affinities of Q1 and HQNO from equilibrium binding levels at concentrations ranging from 100 nm to 50 μm (Fig. 5, B and D). Sensorgrams at higher analyte concentrations did not reach equilibrium binding levels in reasonable time and were obviously affected by nonspecific interactions, not uncommon for hydrophobic analyte molecules like Q1 and HQNO.
FIGURE 5.
Interaction of Q1 and HQNO with NqrA determined by surface plasmon resonance affinity assays. A and B, sensorgrams (A) and steady-state binding levels (B) of Q1 binding to immobilized NqrA. C and D, sensorgrams (C) and steady-state binding levels (D) of HQNO binding to immobilized NqrA. For each analyte, sensorgrams and binding levels from two independent dilution series are shown. Equilibrium binding levels were fitted to a two-site binding isotherm that accounts for additional low affinity binding of Q1 and HQNO to NqrA present at higher concentrations.
When fitting the full data range to a one-site binding model, rather poor regression coefficients are obtained for both Q1 (R2 = 0.90) and HQNO (R2 = 0.74), reflecting additional, low affinity interactions that become prominent at concentrations above 3–6.5 μm (supplemental Fig. S5, A and B). We therefore decided to fit our SPR data to a two-site binding model that yielded excellent regression coefficients (Fig. 5, B and D; R2 = 0.97 and 0.94, respectively). According to this, Q1 entertains a high affinity interaction with NqrA with a KD1 = 124 ± 13 nm and is involved in additional low affinity binding with a KD2 = 36 ± 5 μm. The inhibitor HQNO has a KD1 = 100 ± 24 nm and a KD2 = 32 ± 5 μm. In conclusion, surface plasmon resonance experiments indicate high affinity binding of Q1 (and HQNO) to NqrA, in agreement with our results from photochemical labeling.
Structural Determinants of Q1 for Binding to NqrA
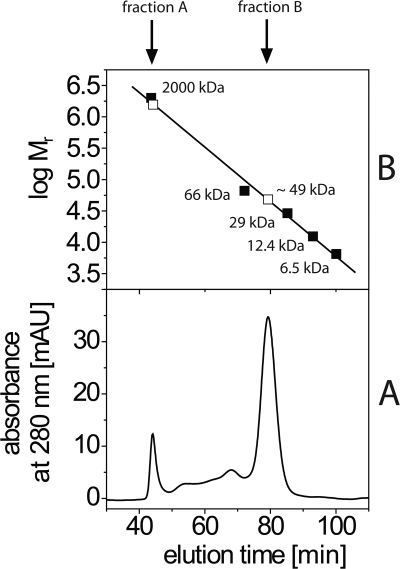
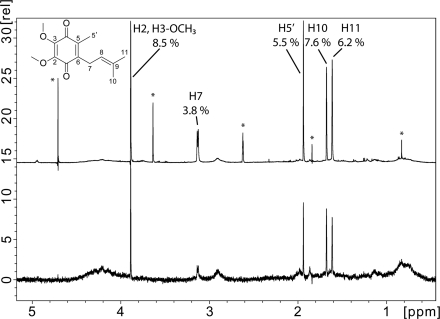
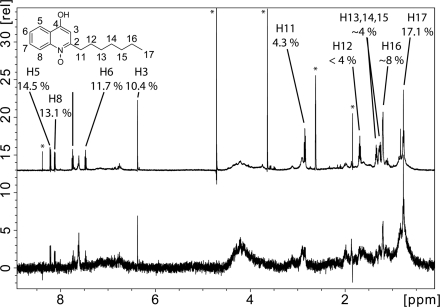
To validate our results from photolabeling and SPR and to identify critical contacts between Q1 and its binding site on NqrA, we applied STD NMR spectroscopy. To exclude artifacts brought about by misfolded or aggregated NqrA, it was important to analyze the oligomerization state of the protein subjected to NMR analysis. Size exclusion chromatography of NqrA separated NqrA aggregates with a mass >600 kDa from monomeric NqrA with an apparent mass of 49 kDa (Fig. 6). The SDS-PAGE of NqrA aggregates and monomeric NqrA is shown in supplemental Fig. S6. With monomeric NqrA, Q1 showed STD signals between 8.5 and 3.8% (Fig. 7). The strongest signals originated from the two methoxy groups (8.5%) followed by the two terminal methyl groups of the prenyl side chain (7.6 and 6.2%, respectively). The weakest signal resulted from CH2-7 of the prenyl side chain (3.8%). This suggests a slightly tighter contact of the quinone headgroup and the terminus of the prenyl side chain as compared with the internal part of the prenyl group. Even stronger STD effects (maximum 17.1%) were observed with NqrA and the inhibitor HQNO (Fig. 8), indicative of a faster exchange kinetic of HQNO as compared with Q1. The strongest signals were attributed to the terminal methyl group of the alkyl chain (CH3-17, 17.1%) and several protons of the hydroxyquinoline headgroup (H5, 14.5%; H8, 13.1%; H7, 11.7%; H3, 10.4%). The internal portion of the alkyl chain showed significantly weaker STD effects (CH2-11 to CH2-15, 4%). This pattern of STD effects is consistent with a similar binding mode of HQNO and Q1 in the same binding site of NqrA. No STD NMR effects were observed with Q1 and HQNO in the absence of NqrA (supplemental Fig. S7). Riboflavin is a cofactor located on subunit NqrB (5). As expected, a control experiment performed with NqrA and riboflavin did not reveal STD NMR signals (supplemental Fig. S8).
FIGURE 6.
Size exclusion chromatography of NqrA. Lower panel, elution of multimeric NqrA (fraction A) and monomeric NqrA (fraction B). Upper panel, calibration with molecular mass standards (closed squares) to determine the apparent mass of NqrA (open squares). mAU, milliabsorbance units.
FIGURE 7.
Saturation transfer difference NMR of Q1 interacting with NqrA. Upper and lower panels, reference (upper panel) and STD NMR (lower panel) spectra of Q1 in the presence of NqrA (molar ratio = 10:1). The reference spectrum was scaled to 10% of its original intensity. Signals of the same intensity in the STD spectrum corresponded to an STD effect of 10%. The signal of proton H8 (Fig. 1) was largely suppressed by the excitation sculpting scheme used to suppress the residual HDO resonance and could not be quantified reliably. Impurities and solvents signals are marked with asterisks. rel, relative.
FIGURE 8.
Saturation transfer difference NMR of HQNO interacting with NqrA. Upper and lower panels, reference (upper panel) and STD NMR (lower panel) spectra of HQNO in the presence of NqrA (molar ratio = 10:1). The reference spectrum was scaled to 14% of its original intensity. Signals of the same intensity in the STD spectrum corresponded to an STD effect of 14%. Impurities and solvents signals are marked with asterisks. rel, relative.
DISCUSSION
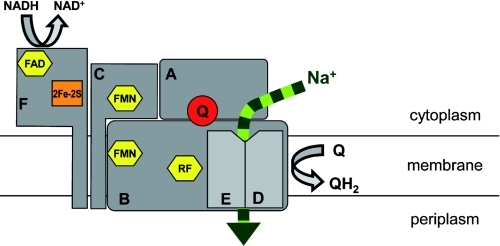
The catalytic NADH binding site of Na+-NQR is located on subunit NqrF. Here we show that the second substrate, the quinone, binds to the peripheral NqrA subunit of Na+-NQR (Fig. 9). Removal of Q8 did not destabilize the Na+-NQR, which could be reconstituted with short-chain quinone analogues, suggesting that binding of Q to the complex is mainly conferred by interactions of the redox-active Q head group with NqrA. Endogenous Q8 present in Na+-NQR prevented the modification of NqrA with 3-N3-Q-biotin, demonstrating that this biotinylated Q derivative occupied a functionally relevant Q site in the complex. Substitution of the methoxy group at the C-3 position of Q2 by an azido group did not affect binding to NqrA, whereas the same substitution at the C-2 position strongly reduced binding efficiency (Fig. 1). This demonstrates that the substituent at the C-2 position is crucial for recognition of the quinone. Contacts between the methoxy groups at the C-2 and the C-3 positions of Q1 with amino acid residues of NqrA were also confirmed by STD NMR spectroscopy (Fig. 7). The precise location of the quinone binding site on NqrA remains to be identified. We should also consider that Na+-NQR might contain an additional Q binding site that is distinct from the catalytic site identified in the present study (23). Our SPR assays point into this direction as the steady-state binding levels fitted best to a two-site binding isotherm. However, the KD2 values of the secondary interaction in the 30 μm range must be considered as rough estimates as we could obtain acceptable sensorgrams only at concentrations below 25–50 μm.
FIGURE 9.
Putative arrangement of subunits and cofactors of the Na+-NQR. Flavin cofactors are the FAD on NqrF (F), the covalently bound FMNs of subunit NqrC (C) and NqrB (B), and the riboflavin (RF) on NqrB. NqrF also harbors a 2Fe-2S cluster. Enzyme-bound ubiquinone-8 (Q) was identified on subunit NqrA (A). The membrane-bound subunits NqrB, NqrD (D), and NqrE (E) are proposed to participate in Na+ transport. NADH oxidation by NqrF triggers electron transfer via FMNs to the riboflavin on NqrB, which acts as electron donor for ubiquinone-8 on NqrA.
The affinity of isolated NqrA for Q2 was clearly lower than for Q1, whereas Q1 and Q2 were equally well incorporated into Na+-NQR. Thus, it has to be assumed that in the holo-complex, additional Nqr subunits contribute to the binding of Q, most likely by interacting with the hydrophobic isoprenoid tail. NqrA is a peripheral subunit of the complex that does not contain transmembrane helices. It only binds to the membrane in the presence of other Nqr subunits (5). The naturally occurring Q8 is a hydrophobic molecule residing in the membrane bilayer. This raises the question as to how Q8 accesses its binding site on NqrA. The subunit might be in direct contact with the membrane via a hydrophobic surface patch, as was proposed for the alternative NADH:quinone oxidoreductase (NDH-2), which mediates membrane contact via amphipathic helices (24). We favor another scenario where additional Nqr subunits interact with the hydrophobic isoprenoid side chain of quinone. A likely candidate is the membrane-bound NqrB subunit because NqrA forms stable subcomplexes with subunits NqrBCF (4) and NqrBDE (5, 25). NqrB was proposed to interact with quinone based on a mutagenesis study with Na+-NQR using the Q-reductase inhibitor korormicin (26). A direct interaction of NqrA and NqrB would also be consistent with hypotheses on electron transfer routes within the complex (2, 4, 7, 27) assuming direct transfer of electrons from the riboflavin bound to NqrB (5) to substrate quinone (Fig. 9). It remains to be investigated how the ultimate electron transfer step from riboflavin on NqrB to ubiquinone-8 on NqrA determines the transport of Na+ by the membrane-bound subunits of the Na+-NQR.
Supplementary Material
Acknowledgments
We thank Endre Laczko and Stefan Schauer, Functional Genomics Centre Zurich, and David Witte, Universität Konstanz, for technical support.
This work was supported by the Swiss National Science Foundation (Grant PP0033-118994) (to J. S.), by contract research of the Baden-Württemberg Stiftung, Forschungsprogramm P-LS-Meth/4 (to J. S. and H. M. M.), and by Grant-in-Aid for Scientific Research 20380068 from the Japan Society for the Promotion of Science (to H. M.).

The on-line version of this article (available at http://www.jbc.org) contains supplemental methods, Table S1, and Figs. S1–S8.
- Na+-NQR
- Na+-pumping NADH:quinone oxidoreductase
- Q
- quinone
- Q1
- ubiquinone-1
- Q2
- ubiquinone-2
- Q8
- ubiquinone-8
- 3-N3-Q2
- 3-azido-2-methoxy-5-methyl-6-geranyl-1,4-benzoquinone
- 2-N3-Q2
- 2-azido-3-methoxy-5-methyl-6-geranyl-1,4-benzoquinone
- 3-N3-Q-biotin
- biotinylated 3-N3-Q2
- DDM
- n-dodecyl-β-d-maltoside
- LDAO
- lauryldimethylamine N-oxide
- HQNO
- 2-n-heptyl-4-hydroxyquinoline N-oxide
- DMSO
- dimethyl sulfoxide
- Ni-NTA
- nickel-nitrilotriacetic acid
- STD
- saturation transfer difference
- RU
- response unit.
REFERENCES
- 1. Häse C. C., Barquera B. (2001) Biochim. Biophys. Acta 1505, 169–178 [DOI] [PubMed] [Google Scholar]
- 2. Bogachev A. V., Bloch D. A., Bertsova Y. V., Verkhovsky M. I. (2009) Biochemistry 48, 6299–6304 [DOI] [PubMed] [Google Scholar]
- 3. Barquera B., Ramirez-Silva L., Morgan J. E., Nilges M. J. (2006) J. Biol. Chem. 281, 36482–36491 [DOI] [PubMed] [Google Scholar]
- 4. Tao M., Casutt M. S., Fritz G., Steuber J. (2008) Biochim. Biophys. Acta 1777, 696–702 [DOI] [PubMed] [Google Scholar]
- 5. Casutt M. S., Huber T., Brunisholz R., Tao M., Fritz G., Steuber J. (2010) J. Biol. Chem. 285, 27088–27099 [DOI] [PMC free article] [PubMed] [Google Scholar]
- 6. Türk K., Puhar A., Neese F., Bill E., Fritz G., Steuber J. (2004) J. Biol. Chem. 279, 21349–21355 [DOI] [PubMed] [Google Scholar]
- 7. Juárez O., Morgan J. E., Barquera B. (2009) J. Biol. Chem. 284, 8963–8972 [DOI] [PMC free article] [PubMed] [Google Scholar]
- 8. Juárez O., Morgan J. E., Nilges M. J., Barquera B. (2010) Proc. Natl. Acad. Sci. 107, 12505–12510 [DOI] [PMC free article] [PubMed] [Google Scholar]
- 9. Lin P. C., Türk K., Häse C. C., Fritz G., Steuber J. (2007) J. Bacteriol. 189, 3902–3908 [DOI] [PMC free article] [PubMed] [Google Scholar]
- 10. Johnson A. R. (1971) in Biochemistry and Methodology of Lipids (Johnson A. R., Davenport J. B. eds.) pp. 131–136, Wiley-Interscience, New York [Google Scholar]
- 11. Barquera B., Hellwig P., Zhou W., Morgan J. E., Häse C. C., Gosink K. K., Nilges M., Bruesehoff P. J., Roth A., Lancaster C. R., Gennis R. B. (2002) Biochemistry 41, 3781–3789 [DOI] [PubMed] [Google Scholar]
- 12. Murai M., Yamashita T., Senoh M., Mashimo Y., Kataoka M., Kosaka H., Matsuno-Yagi A., Yagi T., Miyoshi H. (2010) Biochemistry 49, 2973–2980 [DOI] [PMC free article] [PubMed] [Google Scholar]
- 13. Whitmore L., Wallace B. A. (2004) Nucleic Acids Res. 32, W668–W673 [DOI] [PMC free article] [PubMed] [Google Scholar]
- 14. Whitmore L., Wallace B. A. (2008) Biopolymers 89, 392–400 [DOI] [PubMed] [Google Scholar]
- 15. Compton L. A., Johnson W. C., Jr. (1986) Anal. Biochem. 155, 155–167 [DOI] [PubMed] [Google Scholar]
- 16. Mayer M., Meyer B. (1999) Angew. Chem. Int. Ed. Engl. 38, 1784–1788 [DOI] [PubMed] [Google Scholar]
- 17. Hwang T. L., Shaka A. J. (1995) J. Magn. Reson. Ser. A 112, 275–279 [Google Scholar]
- 18. Dahinden P., Auchli Y., Granjon T., Taralczak M., Wild M., Dimroth P. (2005) Arch. Microbiol. 183, 121–129 [DOI] [PubMed] [Google Scholar]
- 19. Matsumoto Y., Murai M., Fujita D., Sakamoto K., Miyoshi H., Yoshida M., Mogi T. (2006) J. Biol. Chem. 281, 1905–1912 [DOI] [PubMed] [Google Scholar]
- 20. Penzer G. R., Radda G. K. (1967) Q. Rev. Chem. Soc. 21, 43–65 [Google Scholar]
- 21. Pfenninger-Li X. D., Albracht S. P., van Belzen R., Dimroth P. (1996) Biochemistry 35, 6233–6242 [DOI] [PubMed] [Google Scholar]
- 22. Gagné S. M., Tsuda S., Li M. X., Chandra M., Smillie L. B., Sykes B. D. (1994) Protein Sci. 3, 1961–1974 [DOI] [PMC free article] [PubMed] [Google Scholar]
- 23. Grimaldi S., Ostermann T., Weiden N., Mogi T., Miyoshi H., Ludwig B., Michel H., Prisner T. F., MacMillan F. (2003) Biochemistry 42, 5632–5639 [DOI] [PubMed] [Google Scholar]
- 24. Melo A. M., Bandeiras T. M., Teixeira M. (2004) Microbiol. Mol. Biol. Rev. 68, 603–616 [DOI] [PMC free article] [PubMed] [Google Scholar]
- 25. Nakayama Y., Hayashi M., Unemoto T. (1998) FEBS Lett. 422, 240–242 [DOI] [PubMed] [Google Scholar]
- 26. Hayashi M., Shibata N., Nakayama Y., Yoshikawa K., Unemoto T. (2002) Arch. Biochem. Biophys. 401, 173–177 [DOI] [PubMed] [Google Scholar]
- 27. Bogachev A. V., Kulik L. V., Bloch D. A., Bertsova Y. V., Fadeeva M. S., Verkhovsky M. I. (2009) Biochemistry 48, 6291–6298 [DOI] [PubMed] [Google Scholar]
Associated Data
This section collects any data citations, data availability statements, or supplementary materials included in this article.


