

Abstract
To evaluate molecular signatures of an individual cell type in comparison to the associated region relevant towards understanding the pathogenesis of Alzheimer’s disease (AD), CA1 pyramidal neurons and the surrounding hippocampal formation were microaspirated via laser capture microdissection (LCM) from neuropathologically confirmed AD and age-matched control (CTR) subjects as well as from wild type mouse brain using single population RNA amplification methodology coupled with custom-designed microarray analysis with real-time quantitative polymerase-chain reaction (qPCR) validation. CA1 pyramidal neurons predominantly displayed downregulation of classes of transcripts related to synaptic transmission in AD versus CTR. Regional hippocampal dissections displayed downregulation of several overlapping genes found in the CA1 neuronal population related to neuronal expression, as well as upregulation of select transcripts indicative of admixed cell types including glial-associated markers and immediate-early and cell death genes. Gene level distributions observed in CA1 neurons and regional hippocampal dissections in wild type mice paralleled expression mosaics seen in postmortem human tissue. Microarray analysis was validated in qPCR studies using human postmortem brain tissue and CA1 sector and regional hippocampal dissections obtained from a mouse model of AD/Down syndrome (Ts65Dn mice) and normal disomic (2N) littermates. Classes of transcripts that have a greater percentage of the overall hybridization signal intensity within single neurons tended to be genes related to neuronal communication. The converse was also found, as classes of transcripts such as glial-associated markers were under represented in CA1 pyramidal neuron expression profiles relative to regional hippocampal dissections. These observations highlight a dilution effect that is likely to occur in conventional regional microarray and qPCR studies. Thus, single population studies of specific neurons and intrinsic circuits will likely yield informative gene expression profile data that may be subthreshold and/or under represented in regional studies with an admixture of cell types.
Keywords: expression profiling, hippocampus, microarray, postmortem human brain, molecular fingerprint, single cell analysis
INTRODUCTION
Hippocampal disconnection is a pathological hallmark of Alzheimer’s disease (AD) along with incapacitating dementia, amyloid deposition, the presence of neurofibrillary tangles (NFTs), and synaptic loss (Allen et al., 2007; deToledo-Morrell et al., 2007; Hyman et al., 1984; Stoub et al., 2006). In vivo imaging and neuropathological studies have demonstrated that the hippocampal formation (including the entorhinal cortex) is one of the first sites to develop neurodegeneration in mild cognitive impairment (MCI) and AD (Apostolova et al., 2010; den Heijer et al., 2010; deToledo-Morrell et al., 2004; Devanand et al., 2007). Notably, CA1 pyramidal neurons are selectively vulnerable to neurodegeneration, and bear NFTs early in AD (Ginsberg et al., 2000; Kerchner et al., 2010; Scheff et al., 2007). Due to the cellular specificity of neurodegeneration in AD, expression profiles obtained from single cells or a homogeneous population of cells (termed population cell analysis) is likely to be more informative than regional and/or global expression analyses that contain an admixture of neuronal and non-neuronal cell types (Ginsberg et al., 2006b; Mufson et al., 2006). Specifically, regional assessments of gene expression create a mosaic of expression levels that are useful for giving a generalized impression of overall gene changes. However, regional analyses cannot discern molecular signatures in discrete neuronal populations, nor can they evaluate differences in neuronal and non-neuronal populations. Direct determination of expression levels within homogeneous neuronal populations obtained from human postmortem brain tissue is optimal for understanding normative function, as well as deciphering molecular mechanisms that underlie the pathophysiology of neurodegenerative disorders, including AD. Thus, discrimination of individual cell types is highly desirable because this approach enables the differentiation of specifically identified neuronal cells from adjacent neuronal populations as well as glia, vascular epithelia, and other non-neuronal cells within the brain.
The implementation of gene expression profiling methods, including microarray technology, enables relative quantitative assessment of multiple genes simultaneously from postmortem human brain tissue samples as well as optimally prepared brain tissues from relevant animal models in either a high-throughput or moderate-throughput format. Molecular fingerprinting is performed by extracting RNAs from identified cells, typically through the use of laser capture microdissection (LCM), followed by RNA amplification, and hybridizing labeled RNA to an array platform (Ginsberg, 2008, 2009). Quantification of hybridization signal intensity is performed to assess the relative expression level of each feature on the array platform. Gene expression is evaluated using statistical approaches and informatics software, enabling coordinate expression level analyses which can be correlated with other variables including antemortem cognitive measures and neuropathological criteria (Ginsberg et al., 2006b, 2010; Mufson et al., 2006).
The present work is a component of our ongoing series of studies that focuses upon molecular signature analysis of individual populations and within the human and animal model hippocampus to evaluate selective vulnerability of specific cell types to neurodegeneration, including CA1 and CA3 pyramidal neurons in AD and dentate gyrus granule cells following perforant path transection in animal models (Ginsberg, 2010; Ginsberg and Che, 2005). Herein, expression profile analysis was performed on CA1 pyramidal neurons along with the surrounding hippocampus from postmortem brain tissues accrued from subjects diagnosed with AD and age-matched cognitively normal human subjects. CA1 pyramidal neurons and the surrounding hippocampus was also assessed by the same custom-designed array approach with RNA accrued from wild type mice via LCM.
MATERIALS AND METHODS
Postmortem brain tissue collection
This study was performed under the auspices of IRB and IACUC guidelines administrated by the Nathan Kline Institute/New York University Langone Medical Center. Custom-designed microarray analysis of CA1 pyramidal neurons and surrounding hippocampal dissections were performed on a total of 25 postmortem human subjects. Cases were clinically categorized as normal controls with no cognitive impairment (CTR; n = 12), and AD (n = 13; Table I). Brain tissues were accessed through the established collections at the Rush University Medical Center (n = 15; 8 CTR/7 AD) and the Center for Neurodegenerative Disease Research, University of Pennsylvania School of Medicine (n = 10; 4 CTR/6 AD). All of the tissue samples were harvested using standardized accrual methods and procedures.
Table I.
Clinical, demographic, and neuropathological characteristics by diagnosis category
| Clinical Diagnosis | Comparison | |||
|---|---|---|---|---|
| CTR (n =12) | (AD n =13) | by diagnosis group | ||
| Age at death (years) | Mean ± SD (range) | 82.7 ± 8.6 (67–93) | 82.0 ± 8.0 (62–94) | ND |
| Number (%) of males | 5 (42%) | 5 (38%) | ND | |
| Educational level | Mean ± SD (range) | 16.7 ± 4.1 (8–25) | 14.9 ± 3.0 (8–18) | ND |
| MMSE | Mean ± SD (range) | 28.0 ± 1.3 (26–29) | 14.5 ± 5.9 (3–24) | p = 0.001a CTR > AD |
| ApoE ε4 allele (%) | 2 (20%) | 10 (83%) | p = 0.02b CTR < AD |
|
| PMI (hours) | Mean ± SD (range) | 6.8 ± 3.3 (2–14) | 7.3 ± 5.7 (3–19) | ND |
| Ethnicity (%) Caucasian | 12 (100%) | 12 (92%) | ND | |
| Brain weight (g) | Mean ± SD (range) | 1264. 6± 113.1 (1070–1435) | 1069.6 ± 128.0 (870–1400) | p < 0.001a CTR > AD |
| Distribution of Braak scores | 0 | 1 | 0 | |
| I/II | 6 | 1 | p < 0.01c | |
| III/IV | 5 | 0 | ||
| V/VI | 0 | 12 | CTR < AD | |
| CERAD diagnosis | No AD | 9 | 0 | |
| Possible | 3 | 0 | p < 0.01c | |
| Probable | 0 | 3 | ||
| Definite | 0 | 10 | ||
One-way ANOVA.
Fisher’s exact test.
Kruskal-Wallis test
ApoE genotype was available for 10 CTR and 12 AD subjects
MMSE scores were available for 10 CTR subjects
Educational level was available for 11 CTR subjects
At autopsy, tissue blocks containing the hippocampal formation were immersion-fixed in 4% paraformaldehyde in 0.1 M phosphate buffer, pH 7.2 for 24–72 hours at 4 °C, paraffin embedded, and cut on a rotary microtome at 6 μm thickness. Adjacent tissue slabs were also snap-frozen in liquid nitrogen for qPCR. A series of tissue sections were prepared for neuropathological evaluation including visualization and quantitation of senile plaques and NFTs using thioflavine-S, modified Bielschowsky silver stain, and antibodies directed against amyloid-β peptide (Aβ 4G8, monoclonal, Covance, Princeton, NJ) and tau (PHF1, monoclonal, a gift of Dr. Peter Davies) (Bennett et al., 2002; Mufson et al., 2000, 2000). Additional sections were stained for Lewy bodies using antibodies directed against ubiquitin (13–1600, monoclonal, Invitrogen, Carlsbad, CA) and α-synuclein (18-0215, monoclonal, Invitrogen). Exclusion criteria included argyrophilic grain disease, frontotemporal dementia, Lewy body disease, mixed dementias, Parkinson’s disease, and stroke. A board certified neuropathologist blinded to the clinical diagnosis performed the neuropathological evaluation. Neuropathological designations were based on CERAD and Braak staging criteria (Braak and Braak, 1991; Mirra et al., 1991). Amyloid burden and apolipoprotein E (ApoE) genotype were determined for each case as described previously (Bennett et al., 2004; Counts et al., 2007; Mufson et al., 2000).
Normal disomic (2N) and Ts65Dn mouse accession
To assess expression profiles in CA1 neurons in comparison to regional hippocampal dissections, 2N (n = 10; 5M/5F) 12–16 months of age were given an overdose of ketamine and xylazine and perfused transcardially with ice-cold 4% paraformaldehyde buffered in 0.15 M phosphate buffer. Tissue blocks containing the dorsal hippocampus were paraffin embedded and 6 μm-thick tissue sections were cut in the coronal plane on a rotary microtome for immunocytochemistry and subsequent LCM and microarray analysis. In addition to wild type mice, we are employing a mouse model of AD/Down syndrome (DS) termed Ts65Dn mice (Davisson et al., 1993; Reeves et al., 1995) for comparison of CA1 sector and regional hippocampal dissections via qPCR. Ts65Dn mice will undergo parallel microarray analysis as part of a separate study (Alldred and Ginsberg, 2010). Ts65Dn mice are generated by creating a small translocation chromosome from the distal end of mouse chromosome 16 (MMU16) and <10% of the centromeric end of mouse chromosome 17 (Davisson et al., 1993). Triplication of wild type amyloid-β precursor protein (APP; and possibly adjacent genes on MMU16) causes an enlarged endosomal phenotype associated with neurodegeneration and loss of basal forebrain cholinergic neuron phenotypic expression (Cataldo et al., 2003; Holtzman et al., 1996). A cohort of Ts65Dn (n = 6) and 2N (n = 6) mice 12–24 months of age mice were perfused with phosphate buffer and the hippocampus removed and frozen on dry ice for qPCR analysis as described previously (Alldred et al., 2009; Ginsberg, 2010).
Tissue accrual for microarray analysis
Acridine orange histofluorescence (Ginsberg et al., 1997, 1998; Mufson et al., 2002) and bioanalysis (2100, Agilent Biotechnologies, Santa Clara, CA) (Alldred et al., 2008, 2009) were performed on each human and mouse brain prior to performing downstream genetic analyses to ensure that high quality RNA was present in hippocampal tissue sections. AO is a pH-sensitive, fluorescent dye that intercalates into nucleic acids. Upon excitation with ultraviolet spectra, AO intercalated into RNA emits an orange-red fluorescence (Ginsberg et al., 1997; Mai et al., 1984). In brain tissue sections, labeled processes are contrasted by the pale green background of surrounding neuropil and white matter tracts that lack abundant nucleic acids (Mai et al., 1984; Sarnat et al., 1986). AO histochemistry can be used on paraffin-embedded tissue sections, and can be combined with other histochemical and immunohistochemical techniques (Ginsberg et al., 1997, 1998; Mufson et al., 2002).
RNase-free precautions were used throughout the experimental procedures, and solutions were made with 18.2 mega Ohm RNase-free water (Nanopure Diamond, Barnstead, Dubuque, IA). Deparaffinized tissue sections were blocked in a 0.1 M Tris (pH 7.6) solution containing 2% donor horse serum (DHS; Sigma, St. Louis, MO) and 0.01% Triton X-100 for 1 hour and then incubated with a primary antibody directed against nonphosphorylated neurofilament proteins (RMdO20) (Lee et al., 1987) in a 0.1 M Tris/2% DHS solution overnight at 4 °C in a humidified chamber. Sections were processed with the ABC kit (Vector Labs, Burlingame, CA) and developed with 0.05% diaminobenzidine (Sigma), 0.03% hydrogen peroxide, and 0.01 M imidazole in Tris buffer for 10 minutes (Ginsberg, 2010; Ginsberg et al., 2010). Tissue sections were not coverslipped or counterstained and maintained in RNase-free 0.1 M Tris prior to LCM.
LCM and TC RNA amplification procedures have been described in detail previously by our laboratory (Alldred et al., 2008, 2009; Che and Ginsberg, 2004; Ginsberg, 2010; Ginsberg et al., 2010). Briefly, LCM enables rapid accession of single cells and populations for downstream molecular and cellular analyses. LCM entails pulsing an infrared laser onto thermoplastic film embedded in a specialized microfuge cap to form a thin protrusion that bridges the gap between the cap and a tissue section, effectively adhering to target cell(s). Lifting the thermoplastic cap separates targeted cells from surrounding undisturbed tissue. Individual CA1 pyramidal neurons were microaspirated via LCM (Arcturus PixCell IIe, Applied Biosystems, Foster City, CA). Fifty cells were captured per reaction for population cell analysis (Alldred et al., 2008; Ginsberg, 2010). Regional hippocampal dissections were performed on the same neurofilament immunostained fixed tissue sections following the LCM procedure, using a scalpel blade under microscopic visualization (Ginsberg, 2005a; Ginsberg, 2010; Ginsberg and Che, 2005). Regional hippocampal dissections encompassed CA1–CA4 subfields and the dentate gyrus. The entorhinal cortex and subicular complex were excluded from the dissection as described previously (Ginsberg, 2005a; Ginsberg and Che, 2005). A total of 3–6 microarrays containing 50 LCM-captured CA1 neurons each were performed per human and mouse brain. In addition, a total of 2–4 microarrays containing RNA extracted from regional hippocampal dissections were performed per human and mouse brain. Analyzing many biological replicates increases the statistical power of the study and reduces potential cohort bias (Ginsberg and Mirnics, 2006).
TC RNA amplification
TC RNA amplification entails synthesizing first strand cDNA complementary to the RNA template, re-annealing the primers to the cDNA, and finally in vitro transcription using the synthesized cDNA as a template. First strand cDNA synthesis complementary to the template mRNA entails the use of two oligonucleotide primers, a first strand poly d(T) primer and a TC primer (Che and Ginsberg, 2004). TC RNA amplification has been shown to be more sensitive than conventional antisense RNA amplification using input RNA obtained from neurons from mouse and postmortem human brains, and has a reduced selection bias and high reproducibility (Alldred et al., 2008, 2009; Che and Ginsberg, 2004, 2006). Reproducibility and linearity of the TC RNA amplification procedure has been published previously, including the use of CA1 neurons and regional hippocampal dissections as input sources of RNA (Alldred et al., 2008, 2009; Che and Ginsberg, 2004; Ginsberg, 2005b, 2008). One round of amplification is sufficient for downstream genetic analyses. The TC RNA amplification protocol is available at http://cdr.rfmh.org/pages/ginsberglabpage.html. Microaspirated CA1 neurons were homogenized in 500 μl of TRIzol reagent (Invitrogen), chloroform extracted, and precipitated utilizing isopropanol (Alldred et al., 2008, 2009). RNAs were reverse transcribed in a solution containing poly d(T) primer (100 ng/μl) and TC primer (100 ng/μl) in 1X first strand buffer (Invitrogen), 2 μg of linear acrylamide (Applied Biosystems), 10 mM dNTPs, 100 μM DTT, 20 U of SuperRNase Inhibitor (Applied Biosystems), and 200 U of reverse transcriptase (Superscript III, Invitrogen). Single-stranded cDNAs were digested with RNase H and re-annealed with the primers to generate cDNAs with double-stranded regions at the primer interfaces. Single stranded cDNAs were digested by adding the following and then placed in a thermal cycler: 10 mM Tris (pH 8.3), 50 mM KCl, 1.5 mM MgCl2, and 10 U RNase H (Invitrogen) in a final volume of 100 μl. RNase H digestion step at 37 ºC, 30 minutes; denaturation step 95 ºC, 3 minutes; primer re-annealing step 60 ºC, 5 minutes (Che and Ginsberg, 2004). Samples were purified by column filtration (Montage PCR filters; Millipore, Billerica, MA). Column reservoirs were filled with 300 μl of 18.2 mega Ohm RNase-free water and the cDNA reaction was then added to the reservoir. The columns were then spun at 1000 × g for 15 minutes. To recover the cDNA, 20 μl of 18.2 mega Ohm RNase-free water was added to the columns, and the columns were inverted into clean microfuge tubes and spun at 1000 × g for 2 minutes (Alldred et al., 2008, 2009). Hybridization probes were synthesized by in vitro transcription using 33P incorporation in 40 mM Tris (pH 7.5), 6 mM MgCl2, 10 mM NaCl, 2 mM spermidine, 10 mM DTT, 2.5 mM ATP, GTP and CTP, 100 μM of cold UTP, 20 U of SuperRNase Inhibitor, 2 KU of T7 RNA polymerase (Epicentre, Madison, WI), and 120 μCi of 33P-UTP (Perkin-Elmer, Boston, MA) (Ginsberg, 2005b, 2008). The labeling reaction was performed at 37 °C for 4 hours. Radiolabeled TC RNA probes were hybridized to custom-designed cDNA arrays without further purification.
Custom-designed microarray platforms and data analysis
Array platforms consisted of 1 μg of linearized expressed sequence-tagged cDNAs (ESTs) purified from plasmid preparations adhered to high-density nitrocellulose (Hybond XL, GE Healthcare, Piscataway, NJ) using an arrayer robot (VersArray, Bio-Rad, Hercules, CA). The amount of each EST spotted on the array is in several fold molar excess compared to labeled probe, enabling reproducible quantitative analysis (Ginsberg, 2008; Ginsberg and Mirnics, 2006). Each EST was verified by sequence analysis and restriction digestion. ESTs from mouse, rat, and human were employed. For the current single population and regional hippocampal assessments, 125 ESTs were utilized and categorized into one of ten classes of transcripts (Ginsberg and Che, 2005). Classes of transcripts included: AD-related genes (AD; n = 13); calcium and potassium channels (CH; n = 11); cytoskeletal elements (CYT; n = 10); GABA synthesis, receptors, and transporters (GABA; n= 10); glial-associated markers (GLIA; n = 14); glutamate receptors, transporters, and interacting proteins (GLUR; n = 28); immediate-early genes/cell death markers (IE/CD; n = 15); neurotrophins and neurotrophin receptors (NT; n= 10); and synaptic-related markers (SYN; n = 14; Supplemental Table I).
Arrays were prehybridized (2 hours) and hybridized (12 hours) in a solution consisting of 6X saline–sodium phosphate–ethylenediaminetetraacetic acid (SSPE), 5X Denhardt’s solution, 50% formamide, 0.1% sodium dodecyl sulfate (SDS), and denatured salmon sperm DNA (200 μg/ml) at 42 °C in a rotisserie oven (Che and Ginsberg, 2004; Ginsberg, 2008). Following the hybridization protocol, arrays were washed sequentially in 2X SSC/0.1% SDS, 1X SSC/0.1% SDS and 0.5X SSC/0.1% SDS for 15 min each at 37 °C. Arrays were placed in a phosphor screen for 24 hours and developed on a phosphor imager (GE Healthcare). All array phosphor images were adjusted to the same brightness and contrast levels for data acquisition and analysis.
Data collection and statistical analysis for custom-designed microarrays
Hybridization signal intensity was determined utilizing ImageQuant software (GE Healthcare). Briefly, each array was compared to negative control arrays utilizing the respective protocols without any starting RNA. Expression of TC amplified RNA bound to each linearized EST (125 ESTs on the array) minus background was then expressed as a ratio of the total hybridization signal intensity of the array (a global normalization approach). Global normalization effectively minimizes variation due to differences in the specific activity of the synthesized probe and the absolute quantity of probe (Eberwine et al., 2001; Ginsberg, 2008). These data do not allow the absolute quantitation of mRNA levels. However, an expression profile of relative changes in mRNA levels was generated. Relative changes in total hybridization signal intensity and in individual mRNAs were analyzed by one-way analysis of variance (ANOVA) with post-hoc analysis for individual comparisons (Neumann-Keuls test for statistical significance; level of statistical significance was set at p < 0.01; p-values betwen p < 0.02 – p < 0.05 were considered trend level) (Counts et al., 2009; Ginsberg, 2008; Ginsberg et al., 2010). False discovery rates (Kyng et al., 2003; Reiner et al., 2003) were also estimated for the comparison of CA1 pyramidal neurons and regional hippocampal dissections as described previously (Ginsberg and Che, 2005). Expression levels were analyzed and clustered using bioinformatics and graphics software packages (GeneLinker Gold, Predictive Patterns Inc., Kingston, ON and Accuprepress Inc., Torrance, CA).
RNA preparation for qPCR analysis
qPCR was performed on frozen tissue micropunches containing the CA1 region obtained from 6 AD and 9 CTR cases as described previously (Ginsberg et al., 2010; Ginsberg and Che, 2005). In addition, qPCR was performed on Ts65Dn and 2N mice using a CA1 enriched preparation as well as a regional hippocampal dissection similar to the microarray approach. Under microscopic visualization, the CA1 region of the hippocampus or the entire hippocampal formation was dissected from frozen tissue slabs using a scalpel blade and stored at −80 °C until use. Tissue samples were homogenized in 500 μl of TRIzol reagent (Invitrogen), extracted with chloroform, and precipitated utilizing isopropanol (Alldred et al., 2009). RNA quality and purity were analyzed by bioanalysis (2100, Agilent). RNAs harvested from the CA1 region (150 ng) and regional hippocampal dissections (260 ng) were reverse transcribed in a solution containing random hexamers (Applied Biosystems, 100 μM) in 1X first strand buffer (Invitrogen), 30 mM dNTPs, 200 μM DTT, 30 U of SuperRNase Inhibitor (Applied Biosystems), and 300 U of reverse transcriptase (Superscript III, Invitrogen) (Alldred et al., 2008, 2009; Devi et al., 2010). cDNA was purified using Vivaspin 500 columns (5 kD, Sartorius Stedim Biotech, Augbagne, France) and resuspended in 18.2 mega Ohm RNase-free water.
Real-time qPCR
Taqman qPCR primers (Applied Biosystems, Foster City, CA) were utilized for the following human genes: GRIA1 (Hs00990741_m1), GRIA2 (Hs01564838_m1), GRIA3 (Hs01557464_m1), GRIA4, (Hs00898779_m1), TrkB (Hs01093096_m1), and the housekeeping gene glyceraldehyde-3-phosphate dehydrogenase (GAPDH; Hs02758991_g1). Taqman qPCR primers were utilized for the following mouse genes: cyclin-dependent kinase 5 (CDK5; mM00432447_g1), cyclin-dependent kinase 5, regulatory subunit 1 (p35) (CDK5R1; mM0043814_s1), serotonin receptor 2C (HTR2C; mM00664865_m1), neurotrophin-3 (NTF3; mM00435413_s1) and GAPDH (mM99999915-g1). These genes have yielded preliminary expression level differences within CA1 neurons in Ts65Dn mice as compared to 2N littermates (Alldred and Ginsberg, 2010). Samples were assayed on a real-time qPCR cycler (7900HT, Applied Biosystems) in 96-well optical plates covered with caps as described previously (Alldred et al., 2009; Ginsberg, 2008; Jiang et al., 2010). The ddCT method was employed to determine relative gene level differences between Ts65Dn and 2N mice with GAPDH qPCR products used as a control (ABI, 2004; Alldred et al., 2009; Devi et al., 2010; Ginsberg, 2008). A total of 3–5 independent samples per subject were run in triplicate for the qPCR assessments. Negative controls consisted of the reaction mixture without input RNA. Alterations in PCR product synthesis were analyzed by one-way ANOVA with post-hoc analysis (Neumann-Keuls test; level of statistical significance was set at p < 0.05).
RESULTS
Clinical and neuropathological characteristics of the 25 cases (12 CTR and 13 mild/moderate AD) used for the microarray analysis are summarized in Table I. No significant differences were observed for age, educational level, ethnicity, gender, and postmortem interval (PMI). Brain weight was significantly lower in AD cases (p < 0.001). The ApoE ε4 allele was more frequent in AD compared to CTR cases (Table I). Distribution of Braak scores was significantly different (p < 0.01), with CTR cases having lower Braak staging than AD. CTR cases were classified as Braak stages 0 (8%), I–II (50%), and III–IV (42%). None of the CTR cases were classified as Braak stages V–VI. AD cases were classified as Braak stages I–II (8%) and V–VI (92%). None of the AD cases were classified as Braak stages 0 and III–IV (Table I). CERAD criteria also significantly differentiated CTR and AD cases (p < 0.01).
Expression profiling was performed on a total of 171 custom-designed microarrays (99 microarrays using RNA extracted from CA1 pyramidal neurons and 72 microarrays using RNA extracted from regional hippocampal dissections) following the TC RNA amplification protocol. Quantitative analysis revealed differential regulation of 29 genes in AD CA1 neurons compared to CTR CA1 neurons including downregulation of potassium channels Kv1.2 (KCNA2; p < 0.0001) and Kv1.3 (KCNA3; p < 0.005) and concomitant up regulation of potassium channel Kv4.2 (KCND2; p < 0.01) and L-type calcium channel CACNA1B (p < 0.003; Fig 1A). Downregulation was observed for β-actin (ACTB; p < 0.0001) and the glutamate receptors GRIA1 (p < 0.0001), GRIA2 (p < 0.0001), GRIN2B (p < 0.0001), and GRM2 (p < 0.002) as well as the neuronal glutamate transporter SLC1A1 (EAAT3; p < 0.001) and the glutamate receptor interacting proteins GRIP2 (p < 0.01) and PSD-95 (p < 0.0001; Fig. 1A) compared to CTR CA1 neurons. Downregulation was observed for the GABA receptor GAT1 (p < 0.001) and the immediate early gene ARC (p < 0.0001). In contrast, a trend for upregulation was observed for bone morphogenic protein 1 (BMP1; p < 0.05) and the immediate early gene FOSB (p < 0.05). The BDNF receptor TrkB was down regulated (p < 0.0001) and there was a trend for downregulation of the neurotrophin-3 receptor TrkC (p < 0.05) in AD CA1 neurons. Several synaptic-related markers were also downregulated, including α-synuclein (SNCA; p < 0.0001), synaptophysin (SYP; p < 0.0001), synaptotagmin 1 (SYT1; p < 0.007), synaptobrevin 1 (VAMP1; p < 0.001), synaptopodin (SYNPO; p < 0.006), syntaxin 4A (STX4A; p < 0.008), vesicle-associated membrane protein, associated protein B (VAPB; p < 0.0001), and vacuolar proton pump homolog1 (VPP1; p < 0.0001; Fig. 1A). A trend for downregulation of the synaptic-related markers synaptojanin (SYNJ; p < 0.02), synaptogyrin 1 (SYNGR1; p < 0.02), and syntaxin 1 (STX1; p < 0.02) was also found in AD CA1 neurons. No differential regulation was observed for other genes including the AD-related genes APP, amyloid precursor-like protein 1 (APLP1), amyloid precursor-like protein 1 (APLP2), β-site APP-cleaving enzyme 1 (BACE1), three-repeat tau (3Rtau), and four-repeat tau (4R), among others. However, the 3Rtau/4Rtau ratio was downregulated in AD CA1 neurons (0.66 ± 0.12) compared to CTR CA1 neurons (0.95 ± 0.1; p < 0.01), consistent with our previously published observations in CA1 neurons and cholinergic basal forebrain (CBF) neurons (Ginsberg et al., 2006a).
Figure 1.

Color coded heatmaps demonstrating relative expression levels of representative genes in CA1 pyramidal neurons (A) and regional hippocampal dissections (B) microaspirated from postmortem human hippocampus obtained from AD and CTR subjects. Single asterisk denotes downregulated genes and double asterisk denotes upregulated genes in AD relative to CTR (p-values are presented in the Results section). Note the preponderance of genes dysregulated in CA1 pyramidal neurons displayed downregulation in AD, whereas downregulation of GLUR and SYN markers and upregulation of primarily GLIA and IE/CD genes were observed within the regional hippocampal dissections.
Commensurate with the CA1 neuron expression profile analysis, quantitative analysis revealed differential regulation of 26 genes within AD regional hippocampal dissections compared to CTR regional hippocampal dissections, although a substantial number of individual genes that were dysregulated differed from those observed in the CA1 neuron paradigm. Specifically, significant upregulation of the cytoskeletal element integrin 1 (ITGA1; p < 0.001) was found along with upregulation of glial-associated markers interleukin 1β (IL1B; p < 0.001), advanced glycosylation end product-specific receptor (AGER; p < 0.01), tumor necrosis factor receptor 1A (TNRFSF1A; p < 0.01), heat-shock protein 60 (HSPD1; p < 0.01), heat-shock protein 70 (HSPA1A; p < 0.006), heat-shock protein 90 (HSP90AA1; p < 0.0001; Fig 1B), and a trend for upregulation of glial fibrillary acidic protein (GFAP; p < 0.03). Several IE/CD genes were significantly upregulated, including TNRFSF1A-associated via death domain (TRADD; p < 0.006), nuclear factor kappa-B (NFKB; p < 0.01), FOSB (p < 0.005; Fig 1B) and a trend for the upregulation of FOS (p < 0.04) and CJUN (p < 0.04). A trend for downregulation of the GABA synthesis gene glutamate decarboxylase 67 (GAD67; p < 0.05) was also found. Gene alterations consistent with those observed in CA1 pyramidal neurons included upregulation of KCND2 (p < 0.009), downregulation of ARC (p < 0.002), a trend for downregulation of KCNA2 (p < 0.02), and a trend for upregulation of CACNA1B (p < 0.02). Similar to CA1 neurons, downregulation was also seen for GLUR markers GRIA1 (p < 0.001), GRIA2 (p < 0.001), SLC1A1 (p < 0.002), and GRIN2B (p < 0.009), PSD95 (p < 0.006), as well as SYN markers SNCA (p < 0.0001) and SYP (p < 0.002), and NT gene TrkB (p < 0.008; Fig 1B) in AD regional hippocampal dissections compared to CTR. A comparison of genes differentially regulated in CA1 pyramidal neurons and regional hippocampal dissections is presented in Table II.
Table II.
Comparison of expression level changes in CA1 pyramidal neurons and regional hippocampal dissections in AD and CTR subjects
| Gene | AD vs CTR CA1 pyramidal neurons fold difference |
AD vs CTR CA1 pyramidal neurons p-value |
AD vs CTR regional hippocampal dissections fold difference |
AD vs CTR regional hippocampal dissections p-value |
Class of transcript |
|---|---|---|---|---|---|
| ACTB | −1.83 | < 0.0001 | −1.16 | NS | CYT |
| AGER | +1.17 | NS | +1.53 | < 0.01 | GLIA |
| ARC | −2.23 | < 0.0001 | −1.62 | < 0.002 | IE/CD |
| BMP1 | +1.60 | < 0.05* | +1.18 | NS | GLIA |
| CACNA1B | +1.67 | < 0.003 | +1.40 | < 0.02* | CH |
| CJUN | −1.29 | NS | +1.52 | < 0.04* | IE/CD |
| FOS | −1.31 | NS | +1.50 | < 0.04* | IE/CD |
| FOSB | +1.50 | < 0.05* | +1.71 | < 0.005 | IE/CD |
| GAD67 | −1.22 | NS | −1.43 | < 0.05* | GABA |
| GAT1 | −1.55 | < 0.001 | +1.08 | NS | GABA |
| GFAP | +1.05 | NS | +1.54 | < 0.03* | GLIA |
| GRIA1 | −2.00 | < 0.0001 | −1.65 | < 0.001 | GLUR |
| GRIA2 | −1.91 | < 0.0001 | −1.62 | < 0.001 | GLUR |
| GRIN2B | −1.72 | < 0.0001 | −1.45 | < 0.009 | GLUR |
| GRIP2 | −1.44 | < 0.01 | −1.22 | NS | GLUR |
| GRM2 | −1.77 | < 0.002 | −1.26 | NS | GLUR |
| HSP90AA1 | −1.05 | NS | +1.96 | < 0.0001 | GLIA |
| HSPA1A | +1.29 | NS | +1.76 | < 0.006 | GLIA |
| HSPD1 | +1.39 | NS | +1.73 | < 0.01 | GLIA |
| IL1B | +1.10 | NS | +1.86 | < 0.001 | GLIA |
| ITGA1 | +1.18 | NS | +1.77 | < 0.001 | CYT |
| KCNA2 | −1.96 | < 0.0001 | −1.49 | < 0.02* | CH |
| KCNA3 | −1.72 | < 0.005 | +1.09 | NS | CH |
| KCND2 | +1.55 | < 0.01 | +1.55 | <0.009 | CH |
| NFKB | +1.16 | NS | +1.63 | < 0.01 | IE/CD |
| PSD-95 | −1.79 | < 0.0001 | −1.49 | < 0.006 | GLUR |
| SLC1A1 | −1.81 | < 0.001 | −1.68 | < 0.001 | GLUR |
| SNCA | −1.96 | < 0.0001 | −1.80 | < 0.0001 | SYN |
| STX1 | −1.64 | < 0.02* | −1.25 | NS | SYN |
| STX4A | −1.63 | < 0.008 | −1.03 | NS | SYN |
| SYNGR1 | −1.59 | < 0.02* | −1.12 | NS | SYN |
| SYNJ | −1.60 | < 0.02* | +1.02 | NS | SYN |
| SYNPO | −1.67 | < 0.006 | −1.24 | NS | SYN |
| SYP | −2.10 | < 0.0001 | −1.63 | < 0.002 | SYN |
| SYT1 | −1.61 | < 0.007 | −1.10 | NS | SYN |
| TNRFSF1A | +1.27 | NS | +1.56 | < 0.01 | GLIA |
| TRADD | +1.13 | NS | +1.65 | < 0.006 | IE/CD |
| TRKB | −2.66 | < 0.0001 | −1.54 | < 0.008 | NT |
| TRKC | −1.44 | < 0.05* | +1.17 | NS | NT |
| VAMP1 | −1.88 | < 0.001 | −1.30 | NS | SYN |
| VAPB | −2.03 | < 0.0001 | −1.37 | NS | SYN |
| VPP1 | −2.13 | < 0.0001 | −1.01 | NS | SYN |
Indicates trend level change
Although hybridization signal intensities were consistently higher in the regional dissections due to the larger amount of input RNA, a comparison was devised to assess relative expression levels of several relevant classes of transcripts from the 125 genes examined in this study. Specifically, individual genes were clustered into the ten classes of transcripts based upon NCBI/Unigene annotation as described above. Normalized hybridization signal intensity for each clone was compiled and assigned to the appropriate transcript class for quantitative analysis (Ginsberg and Che, 2005). Based on this analysis, differential gene expression between AD and CTR (predominantly downregulation) was notable for CA1 pyramidal neurons in GLUR, NT, and SYN categories (Fig. 2 and Table II), whereas regional hippocampal dissections obtained from the same tissue sections, displayed differential regulation, including upregulation primarily in the CH, GLIA, and IE/CD categories and downregulation in the GLUR category (Fig. 2 and Table II). Notably, hippocampal regional dissections had an approximate 5-fold and 3-fold increase in the differential regulation of GLIA and IE/CD genes, respectively compared to CA1 pyramidal neurons, consistent with the admixture of multiple neuronal and non-neuronal cell types contributing RNA species. In contrast, CA1 pyramidal neuron dissections had an approximate 5.5-fold increase in the dysregulation of SYN genes compared to the regional hippocampal dissections, indicating an enrichment of synaptic-related markers within the homogeneous CA1 pyramidal neuron microdissections that were downregulated in AD (Fig. 2).
Figure 2.

Venn diagrams illustrating the representation of specific classes of transcripts that are dysregulated in AD compared to CTR within CA1 pyramidal neurons (A) and regional hippocampal dissections (B). Note downregulation was observed in CA1 pyramidal neurons within the GLUR, NT, and SYN categories, whereas regional hippocampal dissections obtained from the same tissue sections displayed differential regulation, including upregulation primarily in the CH, GLIA, and IE/CD categories and downregulation in the GLUR class of transcripts.
Assessment of the relative enrichment of specific classes of transcripts within CA1 pyramidal neurons in comparison to regional hippocampal dissections was also performed in wild type mice. Expression profiling was performed on a total of 64 custom-designed microarrays (38 microarrays using RNA extracted from CA1 pyramidal neurons and 26 microarrays using RNA extracted from regional hippocampal dissections) in C57Bl/6 mice. Consistent with observations in CA1 neurons obtained postmortem from normal humans (Ginsberg and Che, 2005), classes of transcripts that were over represented in CA1 neurons compared to regional hippocampal dissections included GABA, GLUR, NT, and SYN genes (which accounted for approximately 75% of the total hybridization signal intensity obtained from CA1 neuron preparations; Fig. 3A), whereas gene clusters that were highly represented in regional hippocampal dissections included CYT, GLIA, and IE/CD (which accounted for approximately 70% of the total hybridization signal intensity obtained from CA1 neuron preparations; Fig. 3B), indicating an enrichment of neuronal-related genes in the CA1 neuron preparation as compared to the representation of genes in the hippocampal dissection that reflect the admixture of cell types.
Figure 3.

Venn diagrams illustrating the percentage of representation of specific classes of transcripts to the overall hybridization signal intensity of CA1 pyramidal neurons (A), and regional hippocampal dissections (B) in wild type mice. Classes of transcripts that were over represented in CA1 neurons compared to regional hippocampal dissections included GABA, GLUR, NT, and SYN genes. In contrast, classes of transcripts that were over represented in regional hippocampal dissections included CYT, GLIA, and IE/CD categories.
Validation of array observations was performed using frozen human postmortem brains with micropunches from the CA1 sector. Consistent with findings obtained via the custom-designed array platform, downregulation of GRIA1 (p < 0.03), GRIA2 (p < 0.04), and TrkB (p < 0.005) along with no differences in GRIA3 and GRIA4 was observed in AD CA1 hippocampal dissections compared to CTR (Fig. 4A). Additional comparisons of select expression level changes from individual genes found to be differentially regulated preliminarily within CA1 pyramidal neurons of Ts65Dn mice (Alldred and Ginsberg, 2010), were performed in CA1 sector and regional hippocampal dissections in Ts65Dn and 2N littermates to assess the specificity of the observed alterations. qPCR analysis in CA1 dissections demonstrated downregulation of CDK5 (p < 0.01) and NTF3 (p < 0.03), upregulation of HTR2C (p < 0.03), along with no differences in CDK5R1 qPCR products within Ts65Dn mice compared to 2N littermates (Fig 4B), paralleling preliminary CA1 neuron microarray results (Alldred and Ginsberg, 2010). In contrast, CDK5, HTR2C, and NTF3 qPCR products did not differ between Ts65Dn and 2N mice, and CDK5R1 was significantly upregulated (p < 0.02) in regional hippocampal dissections harvested Ts65Dn mice (Fig. 4B), further illustrating the importance of distinguishing gene expression changes within discrete hippocampal sectors from the entire region.
Figure 4.
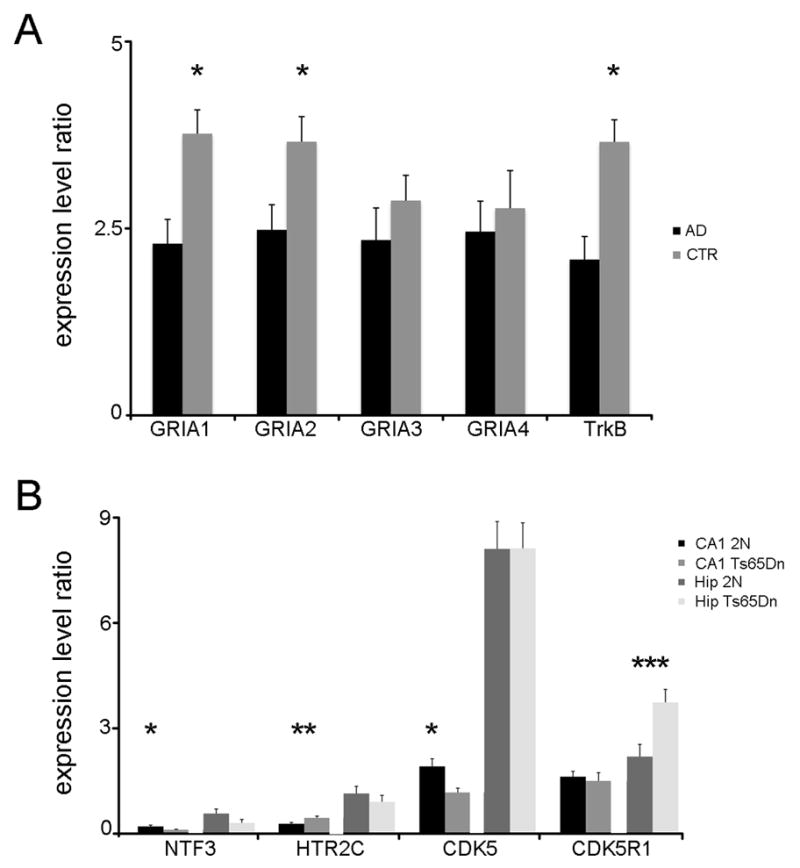
Histograms depicting qPCR analysis in postmortem human AD and CTR cases (A) and Ts65Dn and 2N mice (B). We have included Ts65Dn mice for qPCR analysis to demonstrate differential changes in gene expression levels between CA1 sector and regional hippocampal dissections.
A. Downregulation was found for GRIA1, GRIA2, and TrkB (asterisk) via qPCR in AD versus CTR, consistent with microarray observations.
B. qPCR analysis in CA1 dissections demonstrated downregulation of NTF3 (p < 0.03) and CDK5 (p < 0.01; asterisk), upregulation of HTR2C (p < 0.03; double asterisk), and no differences in CDK5R1 qPCR products within Ts65Dn mice compared to 2N littermates. In contrast, CDK5, HTR2C, and NTF3 qPCR products did not differ between Ts65Dn and 2N mice, and CDK5R1 was significantly upregulated (p < 0.02; triple asterisk) in regional hippocampal dissections obtained from Ts65Dn mice compared to 2N littermates.
DISCUSSION
The present study combined single population LCM of CA1 pyramidal neurons and regional hippocampal dissections with TC RNA amplification and custom-designed array analysis to assess individual genes and relevant classes of transcripts that are differentially regulated in AD, and to see whether these gene alterations are similar within the two dissections. Equivalent numbers of genes were dysregulated in AD versus CTR within CA1 pyramidal neurons (23%) and regional hippocampal dissections (21%), similar to the percentage of dysregulated genes found in several of our previous studies within CA1 pyramidal neurons and CBF neurons in AD (Ginsberg et al., 2000, 2006c, 2010). There was notable overlap in downregulated genes for select GLUR markers including the AMPA receptors GRIA1 and GRIA2, NMDA receptor subunit NR2B, glutamate transporter SLC1A1, as well as the glutamate receptor interacting protein gene PSD-95. These observations are consistent with published literature by independent research groups and our laboratory showing clear downregulation of these genes and their associated proteins within the AD hippocampus (Altar et al., 2009; Armstrong et al., 1994; Carter et al., 2004; Ginsberg et al., 2004, 2006b; Ikonomovic et al., 1995; Proctor et al., 2010; Yasuda et al., 1995), effectively supporting the single population and regional hippocampal approach. Downregulation of the synaptic-related maker SYP within the hippocampus is recognized as a cardinal feature of AD, and correlates with cognitive decline (Heffernan et al., 1998; Sze et al., 1997; Yao et al., 2003). Moreover, downregulation of TrkB is increasingly becoming identified with AD pathology within populations of neurons known to be vulnerable in AD (e.g., CA1 pyramidal neurons and CBF neurons), and also correlates with cognitive decline (Ginsberg et al., 2006b, 2006c, 2010; Mufson et al., 2007, 2008). Therefore, the majority of downregulated genes in the regional hippocampal dissection paralleled changes seen within vulnerable CA1 neurons. In contrast, several SYN markers were downregulated in AD within CA1 pyramidal neurons, but were not detected in the regional hippocampal dissections, likely reflecting the synaptic disconnection that occurs within this highly vulnerable cell type without contamination of expression level changes from adjacent admixed neuronal and non-neuronal cell types. These observations are in agreement with our body of work demonstrating downregulation of SYP and other select synaptic-related markers via single population microarray analysis of CBF and CA1 neurons in MCI and AD (Counts et al., 2009; Ginsberg et al., 1999, 2000, 2004, 2006c, 2010; Ginsberg and Che, 2005). Further expression level differences exist between the two dissections, as the preponderance of genes that were dysregulated in the LCM-captured CA1 neurons displayed downregulation (86%), whereas both upregulation (54%) and downregulation (46%) was observed in the gene level changes within the regional hippocampal dissections, likely reflecting the admixed cell types. Specifically, genes that displayed significant upregulation (without parallel changes in CA1 pyramidal neurons) included selected glial-associated genes as well as IE/CD markers. Upregulation of these genes is highly indicative of the inflammatory and glial proliferative changes that are well established processes within AD, and are consistent with many hippocampal microarray studies (Blalock et al., 2004; Colangelo et al., 2002; Katsel et al., 2005; Loring et al., 2001; Ricciarelli et al., 2004). Glial cells differ from neurons in that they are not postmitotic cells, and they are capable of proliferation, differentiation, as well as programmed cell death. Differential contributions by IE and CD genes to transcriptional and signaling networks may contribute the dynamic activity of glial cells (notably astrocytes and microglia) following injury and neurodegeneration (Delaney et al., 2008; Giffard and Swanson, 2005; Haskew-Layton et al., 2010; Ilieva et al., 2009). In summary, the present results illustrate the tendency to under represent neuronal markers in regional dissections compared to glial, oxidative stress, and inflammatory markers, likely due to gene expression level alterations in admixed cell types, whereas expression level changes in CA1 pyramidal neurons essentially represent the single neuronal population being studied.
Animal model studies were employed in comparison to the human postmortem work within CA1 pyramidal neurons and regional hippocampal dissections. Classes of transcripts that are abundant in wild type mice further illustrate the differences in genes represented in CA1 neurons versus genes found throughout the hippocampal formation. Similar to our previous work in postmortem human CA1 neurons and hippocampus (Ginsberg and Che, 2005), genes that were highly represented in CA1 neurons are associated with synaptic transmission (e.g., GABA, GLUR, and SYN classes of transcripts) whereas genes associated with admixed cell types dominate the expression profile within the regional hippocampal dissection. Evidence for gene expression differences between distinct hippocampal areas has also been demonstrated within CA1 and CA3 subfields as well as the dentate gyrus based upon high-density expression profiling studies in adult mice (Lein et al., 2004; Zhao et al., 2001). These results illustrate the importance of evaluating single populations of neurons separate from regional dissections, as the percentage of genes that are represented in individual populations may differ greatly from the surrounding area. Single population analysis is particularly relevant for evaluating selectively vulnerable neurons within postmortem human brains and associated animal models where expression level alterations that could be potentially targeted for pharmacotherapeutic intervention could be masked or diluted by regional expression level assays which include differentially affected cell populations.
Expression level differences between CA1 neurons and the surrounding hippocampus are not relegated to microarray observations, as the qPCR study employing CA1 sector and regional hippocampal dissections demonstrated for specific genes in Ts65Dn mice relative to 2N littermates. Ts65Dn mice were selected for analysis because they display learning and memory deficits on a myriad of tasks associated with septohippocampal integrity as compared to 2N littermates (Driscoll et al., 2004; Holtzman et al., 1996; Hyde and Crnic, 2001). Ts65Dn mice also have morphological alterations within the hippocampus, including dendritic and synaptic pathology in CA1 pyramidal neurons (Belichenko et al., 2004; Insausti et al., 1998). Although beyond the scope of the current submission, a full microarray analysis of CA1 hippocampal neurons across the lifespan of Ts65Dn mice is underway, and we have used some of the initial validation studies by qPCR to illustrate the potential for dilution effects when employing regional hippocampal dissections to validate changes that have occurred in one specific area or cell type (e.g., CA1 pyramidal neurons). This point cannot be underestimated, as there may be some obviousness in the findings that indicate the LCM (for microarray) and sector-specific dissection (for qPCR) provide a greater proportion of neuronal-associated markers than regional hippocampal dissections, as these measures are technically challenging, and the majority of functional genomics approaches in neurobiology are still at the regional, rather than cellular, level.
In summary, individual differences in neuronal gene expression likely contribute to the unique molecular fingerprint of CA1 pyramidal neurons, which presumably confers selective vulnerability to degeneration in AD and related neurodegenerative disorders. Continued analysis of CA1 pyramidal neurons relative to regional hippocampal dissections is warranted in AD and CTR postmortem human brains as well as relevant animal models of aging and AD along with evaluation of other principal neuronal cells of the hippocampal formation, including dentate gyrus granule cells, entorhinal stellate cells, subicular neurons, and hippocampal interneuronal populations. Simultaneous quantitative assessment of multiple transcripts by microaspiration, RNA amplification, and custom-designed microarray analysis provides insight into the molecular basis of the structure and function of these vulnerable hippocampal neurons relative to their surrounding milieu. Furthermore, microarray and qPCR analysis combined with regional and single population molecular fingerprinting may help develop novel agents that target systems and/or circuits adversely affected specifically during AD pathogenesis, potentially reducing the problems of drug interactions and unwanted side effects.
Supplementary Material
RESEARCH HIGHLIGHTS.
Microarrays and qPCR assessed CA1 neurons and regional hippocampal dissections.
Downregulation of select genes was seen in AD versus CTR for CA1 pyramidal neurons.
Hippocampal dissections showed upregulation of markers indicating admixed cell types.
CA1 neuron and regional hippocampal dissections in mice paralleled human findings.
qPCR validated microarray findings in AD versus control and in wild type mice.
Acknowledgments
We thank Irina Elarova, Shaona Fang, and Arthur Saltzman for expert technical assistance. We acknowledge the Rush University Medical Center and the Center for Neurodegenerative Disease Research, University of Pennsylvania School of Medicine, for the human autopsy case materials. Support for this project (SDG) comes from the NIA (AG10668, AG14449), NIMH (MH086385), and Alzheimer’s Association. We also express our appreciation to the families of the patients studied here who made this research possible.
ABBREVIATIONS
- 2N
normal disomic littermates
- AD
Alzheimer’s disease
- Aβ
amyloid-β peptide
- APP
amyloid-β precursor protein
- ANOVA
analysis of variance
- ApoE
apolipoprotein E
- CH
calcium and potassium channels
- CBF
cholinergic basal forebrain
- Ct
cycle threshold
- CTR
normal controls with no cognitive impairment
- CYT
cytoskeletal elements
- DHS
donor horse serum
- DS
Down syndrome
- ESTs
expressed sequence-tagged cDNAs
- GLIA
glial-associated markers
- GLUR
glutamate receptors, transporters, and interacting proteins
- GAPDH
glyceraldehyde-3 phosphate dehydrogenase
- IE/CD
immediate-early genes/cell death markers
- LCM
laser capture microdissection
- MCI
mild cognitive impairment
- MMU16
mouse chromosome 16
- NFTs
neurofibrillary tangles
- NT
neurotrophins and neurotrophin receptors
- qPCR
real-time quantitative polymerase-chain reaction
- PMI
postmortem interval
- SSPE
6X saline–sodium phosphate–ethylenediaminetetraacetic acid
- SDS
sodium dodecyl sulfate
- SYN
synaptic-related markers
Footnotes
Publisher's Disclaimer: This is a PDF file of an unedited manuscript that has been accepted for publication. As a service to our customers we are providing this early version of the manuscript. The manuscript will undergo copyediting, typesetting, and review of the resulting proof before it is published in its final citable form. Please note that during the production process errors may be discovered which could affect the content, and all legal disclaimers that apply to the journal pertain.
References
- ABI. Guide to Performing Relative Quantitation of Gene Expression Using Real-Time Quantitative PCR. Applied Biosystems Product Guide. 2004:1–60. [Google Scholar]
- Alldred MJ, et al. Terminal continuation (TC) RNA amplification enables expression profiling using minute RNA input obtained from mouse brain. Int J Mol Sci. 2008;9:2091–2104. doi: 10.3390/ijms9112091. [DOI] [PMC free article] [PubMed] [Google Scholar]
- Alldred MJ, et al. Terminal continuation (TC) RNA amplification without second strand synthesis. J Neurosci Methods. 2009;177:381–385. doi: 10.1016/j.jneumeth.2008.10.027. [DOI] [PMC free article] [PubMed] [Google Scholar]
- Alldred MJ, Ginsberg SD. Microarray analysis of hippocampal pyramidal neurons in murine models of Down’s syndrome (DS) and Alzheimer’s disease (AD) Proc Soc Neurosci. 2010;35:653.8. [Google Scholar]
- Allen G, et al. Reduced hippocampal functional connectivity in Alzheimer disease. Arch Neurol. 2007;64:1482–1487. doi: 10.1001/archneur.64.10.1482. [DOI] [PubMed] [Google Scholar]
- Altar CA, et al. Target identification for CNS diseases by transcriptional profiling. Neuropsychopharmacology. 2009;34:18–54. doi: 10.1038/npp.2008.172. [DOI] [PMC free article] [PubMed] [Google Scholar]
- Apostolova LG, et al. Subregional hippocampal atrophy predicts Alzheimer’s dementia in the cognitively normal. Neurobiol Aging. 2010;31:1077–1088. doi: 10.1016/j.neurobiolaging.2008.08.008. [DOI] [PMC free article] [PubMed] [Google Scholar]
- Armstrong DM, et al. AMPA-selective glutamate receptor subtype immunoreactivity in the entorhinal cortex of non-demented elderly and patients with Alzheimer’s disease. Brain Res. 1994;639:207–216. doi: 10.1016/0006-8993(94)91732-9. [DOI] [PubMed] [Google Scholar]
- Belichenko PV, et al. Synaptic structural abnormalities in the Ts65Dn mouse model of Down Syndrome. J Comp Neurol. 2004;480:281–298. doi: 10.1002/cne.20337. [DOI] [PubMed] [Google Scholar]
- Bennett DA, et al. Neurofibrillary tangles mediate the association of amyloid load with clinical Alzheimer disease and level of cognitive function. Arch Neurol. 2004;61:378–384. doi: 10.1001/archneur.61.3.378. [DOI] [PubMed] [Google Scholar]
- Bennett DA, et al. Natural history of mild cognitive impairment in older persons. Neurology. 2002;59:198–205. doi: 10.1212/wnl.59.2.198. [DOI] [PubMed] [Google Scholar]
- Blalock EM, et al. Incipient Alzheimer’s disease: microarray correlation analyses reveal major transcriptional and tumor suppressor responses. Proc Natl Acad Sci U S A. 2004;101:2173–2178. doi: 10.1073/pnas.0308512100. [DOI] [PMC free article] [PubMed] [Google Scholar]
- Braak H, Braak E. Neuropathological stageing of Alzheimer-related changes. Acta Neuropathol. 1991;82:239–259. doi: 10.1007/BF00308809. [DOI] [PubMed] [Google Scholar]
- Carter TL, et al. Differential preservation of AMPA receptor subunits in the hippocampi of Alzheimer’s disease patients according to Braak stage. Exp Neurol. 2004;187:299–309. doi: 10.1016/j.expneurol.2003.12.010. [DOI] [PubMed] [Google Scholar]
- Cataldo AM, et al. App gene dosage modulates endosomal abnormalities of Alzheimer’s disease in a segmental trisomy 16 mouse model of Down syndrome. J Neurosci. 2003;23:6788–6792. doi: 10.1523/JNEUROSCI.23-17-06788.2003. [DOI] [PMC free article] [PubMed] [Google Scholar]
- Che S, Ginsberg SD. Amplification of transcripts using terminal continuation. Lab Invest. 2004;84:131–137. doi: 10.1038/labinvest.3700005. [DOI] [PubMed] [Google Scholar]
- Che S, Ginsberg SD. RNA amplification methodologies. In: McNamara PA, editor. Trends in RNA Research. Nova Science Publishing; Hauppauge: 2006. pp. 277–301. [Google Scholar]
- Colangelo V, et al. Gene expression profiling of 12633 genes in Alzheimer hippocampal CA1: transcription and neurotrophic factor down-regulation and up-regulation of apoptotic and pro-inflammatory signaling. J Neurosci Res. 2002;70:462–473. doi: 10.1002/jnr.10351. [DOI] [PubMed] [Google Scholar]
- Counts SE, et al. Galanin fiber hyperinnervation preserves neuroprotective gene expression in cholinergic basal forebrain neurons in Alzheimer’s disease. J Alzheimers Dis. 2009;18:885–896. doi: 10.3233/JAD-2009-1196. [DOI] [PMC free article] [PubMed] [Google Scholar]
- Counts SE, et al. {alpha}7 Nicotinic receptor up-regulation in cholinergic basal forebrain neurons in Alzheimer disease. Arch Neurol. 2007;64:1771–1776. doi: 10.1001/archneur.64.12.1771. [DOI] [PubMed] [Google Scholar]
- Davisson MT, et al. Segmental trisomy as a mouse model for Down syndrome. Prog Clin Biol Res. 1993;384:117–33. [PubMed] [Google Scholar]
- Delaney J, et al. Regulation of c-fos, c-jun and c-myc gene expression by angiotensin II in primary cultured rat astrocytes: role of ERK1/2 MAP kinases. Neurochem Res. 2008;33:545–550. doi: 10.1007/s11064-007-9474-y. [DOI] [PubMed] [Google Scholar]
- den Heijer T, et al. A 10-year follow-up of hippocampal volume on magnetic resonance imaging in early dementia and cognitive decline. Brain. 2010;133:1163–1172. doi: 10.1093/brain/awq048. [DOI] [PubMed] [Google Scholar]
- de Toledo-Morrell L, et al. MRI-derived entorhinal volume is a good predictor of conversion from MCI to AD. Neurobiol Aging. 2004;25:1197–203. doi: 10.1016/j.neurobiolaging.2003.12.007. [DOI] [PubMed] [Google Scholar]
- de Toledo-Morrell L, et al. Hippocampal atrophy and disconnection in incipient and mild Alzheimer’s disease. Prog Brain Res. 2007;163:741–753. doi: 10.1016/S0079-6123(07)63040-4. [DOI] [PubMed] [Google Scholar]
- Devanand DP, et al. Hippocampal and entorhinal atrophy in mild cognitive impairment: prediction of Alzheimer disease. Neurology. 2007;68:828–836. doi: 10.1212/01.wnl.0000256697.20968.d7. [DOI] [PubMed] [Google Scholar]
- Devi L, et al. Sex- and brain region-specific acceleration of beta-amyloidogenesis following behavioral stress in a mouse model of Alzheimer’s disease. Mol Brain. 2010;3:34. doi: 10.1186/1756-6606-3-34. [DOI] [PMC free article] [PubMed] [Google Scholar]
- Driscoll LL, et al. Impaired sustained attention and error-induced stereotypy in the aged Ts65Dn mouse: a mouse model of Down syndrome and Alzheimer’s disease. Behav Neurosci. 2004;118:1196–205. doi: 10.1037/0735-7044.118.6.1196. [DOI] [PubMed] [Google Scholar]
- Eberwine J, et al. mRNA expression analysis of tissue sections and single cells. J Neurosci. 2001;21:8310–8314. doi: 10.1523/JNEUROSCI.21-21-08310.2001. [DOI] [PMC free article] [PubMed] [Google Scholar]
- Giffard RG, Swanson RA. Ischemia-induced programmed cell death in astrocytes. Glia. 2005;50:299–306. doi: 10.1002/glia.20167. [DOI] [PubMed] [Google Scholar]
- Ginsberg SD. Glutamatergic neurotransmission expression profiling in the mouse hippocampus after perforant-path transection. Am J Geriatr Psychiatry. 2005a;13:1052–1061. doi: 10.1176/appi.ajgp.13.12.1052. [DOI] [PubMed] [Google Scholar]
- Ginsberg SD. RNA amplification strategies for small sample populations. Methods. 2005b;37:229–237. doi: 10.1016/j.ymeth.2005.09.003. [DOI] [PubMed] [Google Scholar]
- Ginsberg SD. Transcriptional profiling of small samples in the central nervous system. Methods Mol Biol. 2008;439:147–158. doi: 10.1007/978-1-59745-188-8_10. [DOI] [PMC free article] [PubMed] [Google Scholar]
- Ginsberg SD. Microarray use for the analysis of the CNS. In: Squire LR, editor. Encyclopedia of Neuroscience. Vol. 5. Academic Press; Oxford: 2009. pp. 835–841. [Google Scholar]
- Ginsberg SD. Alterations in discrete glutamate receptor subunits in adult mouse dentate gyrus granule cells following perforant path transection. Anal Bioanal Chem. 2010;397:3349–3358. doi: 10.1007/s00216-010-3826-1. [DOI] [PMC free article] [PubMed] [Google Scholar]
- Ginsberg SD, et al. Microarray analysis of hippocampal CA1 neurons implicates early endosomal dysfunction during Alzheimer’s disease progression. Biol Psychiatry. 2010;68:885–893. doi: 10.1016/j.biopsych.2010.05.030. [DOI] [PMC free article] [PubMed] [Google Scholar]
- Ginsberg SD, Che S. Expression profile analysis within the human hippocampus: Comparison of CA1 and CA3 pyramidal neurons. J Comp Neurol. 2005;487:107–118. doi: 10.1002/cne.20535. [DOI] [PubMed] [Google Scholar]
- Ginsberg SD, et al. Shift in the ratio of three-repeat tau and four-repeat tau mRNAs in individual cholinergic basal forebrain neurons in mild cognitive impairment and Alzheimer’s disease. J Neurochem. 2006a;96:1401–1408. doi: 10.1111/j.1471-4159.2005.03641.x. [DOI] [PubMed] [Google Scholar]
- Ginsberg SD, et al. Single cell gene expression profiling in Alzheimer’s disease. NeuroRx. 2006b;3:302–318. doi: 10.1016/j.nurx.2006.05.007. [DOI] [PMC free article] [PubMed] [Google Scholar]
- Ginsberg SD, et al. Down regulation of trk but not p75NTR gene expression in single cholinergic basal forebrain neurons mark the progression of Alzheimer’s disease. J Neurochem. 2006c;97:475–487. doi: 10.1111/j.1471-4159.2006.03764.x. [DOI] [PubMed] [Google Scholar]
- Ginsberg SD, et al. Predominance of neuronal mRNAs in individual Alzheimer’s disease senile plaques. Ann Neurol. 1999;45:174–81. [PubMed] [Google Scholar]
- Ginsberg SD, et al. Sequestration of RNA in Alzheimer’s disease neurofibrillary tangles and senile plaques. Ann Neurol. 1997;41:200–9. doi: 10.1002/ana.410410211. [DOI] [PubMed] [Google Scholar]
- Ginsberg SD, et al. Single-cell gene expression analysis: implications for neurodegenerative and neuropsychiatric disorders. Neurochem Res. 2004;29:1053–64. doi: 10.1023/b:nere.0000023593.77052.f7. [DOI] [PubMed] [Google Scholar]
- Ginsberg SD, et al. RNA sequestration to pathological lesions of neurodegenerative diseases. Acta Neuropathol. 1998;96:487–94. doi: 10.1007/s004010050923. [DOI] [PubMed] [Google Scholar]
- Ginsberg SD, et al. Expression profile of transcripts in Alzheimer’s disease tangle-bearing CA1 neurons. Ann Neurol. 2000;48:77–87. [PubMed] [Google Scholar]
- Ginsberg SD, Mirnics K. Functional genomic methodologies. Prog Brain Res. 2006;158:15–40. doi: 10.1016/S0079-6123(06)58002-1. [DOI] [PubMed] [Google Scholar]
- Haskew-Layton RE, et al. Controlled enzymatic production of astrocytic hydrogen peroxide protects neurons from oxidative stress via an Nrf2-independent pathway. Proc Natl Acad Sci USA. 2010;107:17385–17390. doi: 10.1073/pnas.1003996107. [DOI] [PMC free article] [PubMed] [Google Scholar]
- Heffernan JM, et al. Temporal cortex synaptophysin mRNA is reduced in Alzheimer’s disease and is negatively correlated with the severity of dementia. Exp Neurol. 1998;150:235–239. doi: 10.1006/exnr.1997.6772. [DOI] [PubMed] [Google Scholar]
- Holtzman DM, et al. Developmental abnormalities and age-related neurodegeneration in a mouse model of Down syndrome. Proc Natl Acad Sci U S A. 1996;93:13333–13338. doi: 10.1073/pnas.93.23.13333. [DOI] [PMC free article] [PubMed] [Google Scholar]
- Hyde LA, Crnic LS. Age-related deficits in context discrimination learning in Ts65Dn mice that model Down syndrome and Alzheimer’s disease. Behav Neurosci. 2001;115:1239–46. [PubMed] [Google Scholar]
- Hyman BT, et al. Alzheimer’s disease: cell-specific pathology isolates the hippocampal formation. Science. 1984;225:1168–1170. doi: 10.1126/science.6474172. [DOI] [PubMed] [Google Scholar]
- Ikonomovic MD, et al. AMPA-selective glutamate receptor subtype immunoreactivity in the hippocampal formation of patients with Alzheimer’s disease. Hippocampus. 1995;5:469–86. doi: 10.1002/hipo.450050509. [DOI] [PubMed] [Google Scholar]
- Ilieva H, et al. Non-cell autonomous toxicity in neurodegenerative disorders: ALS and beyond. J Cell Biol. 2009;187:761–772. doi: 10.1083/jcb.200908164. [DOI] [PMC free article] [PubMed] [Google Scholar]
- Insausti AM, et al. Hippocampal volume and neuronal number in Ts65Dn mice: a murine model of Down syndrome. Neurosci Lett. 1998;253:175–8. doi: 10.1016/s0304-3940(98)00641-7. [DOI] [PubMed] [Google Scholar]
- Jiang Y, et al. Alzheimer’s-related endosome dysfunction in Down syndrome is A{beta}-independent but requires APP and is reversed by BACE-1 inhibition. Proc Natl Acad Sci USA. 2010;107:1630–1635. doi: 10.1073/pnas.0908953107. [DOI] [PMC free article] [PubMed] [Google Scholar]
- Katsel PL, et al. Large-scale microarray studies of gene expression in multiple regions of the brain in schizophrenia and Alzheimer’s disease. Int Rev Neurobiol. 2005;63:41–82. doi: 10.1016/S0074-7742(05)63003-6. [DOI] [PubMed] [Google Scholar]
- Kerchner GA, et al. Hippocampal CA1 apical neuropil atrophy in mild Alzheimer disease visualized with 7-T MRI. Neurology. 2010;75:1381–1387. doi: 10.1212/WNL.0b013e3181f736a1. [DOI] [PMC free article] [PubMed] [Google Scholar]
- Kyng KJ, et al. Gene expression profiling in Werner syndrome closely resembles that of normal aging. Proc Natl Acad Sci USA. 2003;100:12259–12264. doi: 10.1073/pnas.2130723100. [DOI] [PMC free article] [PubMed] [Google Scholar]
- Lee VM-Y, et al. Monoclonal antibodies distinguish several differentially phosphorylated states of the two largest rat neurofilament subunits (NF-H and NF-M) and demonstrate their existence in the normal nervous system of adult rats. J Neurosci. 1987;7:3474–3488. doi: 10.1523/JNEUROSCI.07-11-03474.1987. [DOI] [PMC free article] [PubMed] [Google Scholar]
- Lein ES, et al. Defining a molecular atlas of the hippocampus using DNA microarrays and high-throughput in situ hybridization. J Neurosci. 2004;24:3879–3889. doi: 10.1523/JNEUROSCI.4710-03.2004. [DOI] [PMC free article] [PubMed] [Google Scholar]
- Loring JF, et al. A gene expression profile of Alzheimer’s disease. DNA Cell Biol. 2001;20:683–695. doi: 10.1089/10445490152717541. [DOI] [PubMed] [Google Scholar]
- Mai JK, et al. Use of acridine orange for histologic analysis of the central nervous system. J Histochem Cytochem. 1984;32:97–104. doi: 10.1177/32.1.6197440. [DOI] [PubMed] [Google Scholar]
- Mirra SS, et al. The Consortium to Establish a Registry for Alzheimer’s Disease (CERAD) Part II. Standardization of the neuropathologic assessment of Alzheimer’s disease. Neurology. 1991;41:479–486. doi: 10.1212/wnl.41.4.479. [DOI] [PubMed] [Google Scholar]
- Mufson EJ, et al. Neuronal gene expression profiling: uncovering the molecular biology of neurodegenerative disease. Prog Brain Res. 2006;158:197–222. doi: 10.1016/S0079-6123(06)58010-0. [DOI] [PubMed] [Google Scholar]
- Mufson EJ, et al. Cholinotrophic molecular substrates of mild cognitive impairment in the elderly. Curr Alzheimer Res. 2007;4:340–350. doi: 10.2174/156720507781788855. [DOI] [PubMed] [Google Scholar]
- Mufson EJ, et al. Single cell gene expression profiles of nucleus basalis cholinergic neurons in Alzheimer’s disease. Neurochem Res. 2002;27:1035–1048. doi: 10.1023/a:1020952704398. [DOI] [PubMed] [Google Scholar]
- Mufson EJ, et al. Cholinergic system during the progression of Alzheimer’s disease: therapeutic implications. Expert Rev Neurother. 2008;8:1703–1718. doi: 10.1586/14737175.8.11.1703. [DOI] [PMC free article] [PubMed] [Google Scholar]
- Mufson EJ, et al. Loss of nucleus basalis neurons containing trkA immunoreactivity in individuals with mild cognitive impairment and early Alzheimer’s disease. J Comp Neurol. 2000;427:19–30. doi: 10.1002/1096-9861(20001106)427:1<19::aid-cne2>3.0.co;2-a. [DOI] [PubMed] [Google Scholar]
- Proctor DT, et al. Reduction in post-synaptic scaffolding PSD-95 and SAP-102 protein levels in the Alzheimer inferior temporal cortex is correlated with disease pathology. J Alzheimers Dis. 2010;21:795–811. doi: 10.3233/JAD-2010-100090. [DOI] [PubMed] [Google Scholar]
- Reeves RH, et al. A mouse model for Down syndrome exhibits learning and behaviour deficits. Nat Genet. 1995;11:177–84. doi: 10.1038/ng1095-177. [DOI] [PubMed] [Google Scholar]
- Reiner A, et al. Identifying differentially expressed genes using false discovery rate controlling procedures. Bioinformatics. 2003;19:368–375. doi: 10.1093/bioinformatics/btf877. [DOI] [PubMed] [Google Scholar]
- Ricciarelli R, et al. Microarray analysis in Alzheimer’s disease and normal aging. IUBMB Life. 2004;56:349–54. doi: 10.1080/15216540412331286002. [DOI] [PubMed] [Google Scholar]
- Sarnat HB, et al. Cytoplasmic RNA in nervous system tumors in children: a fluorochromic histochemical study using acridine orange. Can J Neurol Sci. 1986;13:31–41. doi: 10.1017/s0317167100035769. [DOI] [PubMed] [Google Scholar]
- Scheff SW, et al. Synaptic alterations in CA1 in mild Alzheimer disease and mild cognitive impairment. Neurology. 2007;68:1501–1508. doi: 10.1212/01.wnl.0000260698.46517.8f. [DOI] [PubMed] [Google Scholar]
- Stoub TR, et al. Hippocampal disconnection contributes to memory dysfunction in individuals at risk for Alzheimer’s disease. Proc Natl Acad Sci USA. 2006;103:10041–10045. doi: 10.1073/pnas.0603414103. [DOI] [PMC free article] [PubMed] [Google Scholar]
- Sze CI, et al. Loss of the presynaptic vesicle protein synaptophysin in hippocampus correlates with cognitive decline in Alzheimer disease. J Neuropathol Exp Neurol. 1997;56:933–944. doi: 10.1097/00005072-199708000-00011. [DOI] [PubMed] [Google Scholar]
- Yao PJ, et al. Immunohistochemical characterization of clathrin assembly protein AP180 and synaptophysin in human brain. Neurobiol Aging. 2003;24:173–178. doi: 10.1016/s0197-4580(02)00055-6. [DOI] [PubMed] [Google Scholar]
- Yasuda RP, et al. Reduction of AMPA-selective glutamate receptor subunits in the entorhinal cortex of patients with Alzheimer’s disease pathology: a biochemical study. Brain Res. 1995;678:161–167. doi: 10.1016/0006-8993(95)00178-s. [DOI] [PubMed] [Google Scholar]
- Zhao X, et al. Transcriptional profiling reveals strict boundaries between hippocampal subregions. J Comp Neurol. 2001;441:187–196. doi: 10.1002/cne.1406. [DOI] [PubMed] [Google Scholar]
Associated Data
This section collects any data citations, data availability statements, or supplementary materials included in this article.