

Abstract
High‐frequency oscillations (HFOs) at ≥80 Hz of nonepileptic nature spontaneously emerge from human cerebral cortex. In 10 patients with extraoccipital lobe epilepsy, we compared the spectral‐spatial characteristics of HFOs spontaneously arising from the nonepileptic occipital cortex with those of HFOs driven by a visual task as well as epileptogenic HFOs arising from the extraoccipital seizure focus. We identified spontaneous HFOs at ≥80 Hz with a mean duration of 330 ms intermittently emerging from the occipital cortex during interictal slow‐wave sleep. The spectral frequency band of spontaneous occipital HFOs was similar to that of visually driven HFOs. Spontaneous occipital HFOs were spatially sparse and confined to smaller areas, whereas visually driven HFOs involved the larger areas including the more rostral sites. Neither spectral frequency band nor amplitude of spontaneous occipital HFOs significantly differed from those of epileptogenic HFOs. Spontaneous occipital HFOs were strongly locked to the phase of delta activity, but the strength of δ‐phase coupling decayed from 1 to 3 Hz. Conversely, epileptogenic extraoccipital HFOs were locked to the phase of delta activity about equally in the range from 1 to 3 Hz. The occipital cortex spontaneously generates physiological HFOs which may stand out on electrocorticography traces as prominently as pathological HFOs arising from elsewhere; this observation should be taken into consideration during presurgical evaluation. Coupling of spontaneous delta and HFOs may increase the understanding of significance of δ‐oscillations during slow‐wave sleep. Further studies are warranted to determine whether δ‐phase coupling distinguishes physiological from pathological HFOs or simply differs across anatomical locations. Hum Brain Mapp , 2012. © 2011 Wiley Periodicals, Inc.
Keywords: epilepsy surgery, fast ripples, in‐vivo animation of event‐related γ‐oscillations (gamma‐oscillations), electroencephalography (EEG), memory consolidation, perceptual visual learning, slow‐wave sleep
INTRODUCTION
High‐frequency oscillations (HFOs) at ≥80 Hz are known to be spontaneously generated by human cerebral cortex [reviewed in Gotman,2010], and such interictal spontaneous HFOs can be observed on electrocorticography (ECoG) in patients with focal seizures who undergo epilepsy surgery [Crone et al.,1998; Engel et al.,2005]. A number of previous studies of patients with epilepsy as well as rodent models of epilepsy using micro‐ and macro‐electrodes showed that the seizure onset sites produced interictal spontaneous HFOs at 80‐500 Hz during slow‐wave sleep [Bragin et al.,1999; Crépon et al.,2010; Jacobs et al.,2009; Ogren et al.,2009; Schevon et al.,2009; Staba et al.,2004; Urrestarazu et al.,2007; Worrell et al.,2008]. Slow‐wave sleep segments have been preferentially sampled and assessed in previous studies of interictal spontaneous HFOs, partly because such HFOs occur more frequently during slow‐wave sleep [Staba et al.,2004; Urrestarazu et al.,2007; Worrell et al.,2008]. A recent clinical study showed an association between recurrent seizures following cortical resection and incomplete resection of sites showing interictal spontaneous HFOs at 80‐500 Hz observed during slow‐wave sleep [Jacobs et al.,2010b]. Such observations have led to the hypothesis that interictal spontaneous HFOs on ECoG could potentially serve as a biomarker for epileptogenicity [Bragin et al.,2010; Engel et al.,2009; Jacobs et al.,2010b].
Conversely, the presence of interictal HFOs of nonepileptic nature spontaneously emerging without external sensory stimuli during slow‐wave sleep have been described in recent human ECoG studies using macro‐ and micro‐electrodes [Axmacher et al.,2008; Csercsa et al.,2010; Le Van Quyen et al.,2010; Ogren et al.,2009]. A study of adults with medial temporal epilepsy showed that the rates of appearance of spontaneous HFOs at >150 Hz were three times higher in atrophic hippocampus compared with those in the non‐atrophic hippocampus, whereas no difference in the rates of spontaneous HFOs at <150 Hz were found between atrophic and nonatrophic hippocampi [Ogren et al.,2009]. Another study of adults with medial temporal epilepsy reported that spontaneous HFOs at 80–140 Hz emerging from the medial temporal lobe contralateral to the seizure onset zone were noted during a short period of nap and that the rate of such spontaneous HFOs was correlated to subsequent memory recall performance [Axmacher et al.,2008]. These observations have led to the hypothesis that interictal HFOs of physiological nature could spontaneously emerge from human cerebral cortex without external sensory stimuli during slow‐wave sleep.
A recent study using microelectrodes briefly described that infrequent small HFOs at <120Hz spontaneously emerged from an occipital area in a single adult with temporal lobe epilepsy [Le Van Quyen et al.,2010]. How consistently, across human subjects, are spontaneous HFOs of nonepileptic nature observed in the occipital lobe during slow‐wave sleep? Do such spontaneous HFOs look similar to those driven by a visual task? Studies of rodents and cats using micro‐electrodes and voltage dye imaging have described the similarity of spontaneous and sensory‐driven neuronal activities emerging from sensory areas [Arieli et al.,1996; Kenet et al.,2003; Luczak et al.,2007; Ringach,2009; Sakata and Harris,2009; Tsodyks et al.,1999].
(i) We determined how commonly spontaneous HFOs of nonepileptic nature were observed in the occipital lobe during slow‐wave sleep. (ii) We determined how the spectral and spatial characteristics of such spontaneous HFOs differed from those of HFOs driven by a visual task. (iii) We also explored whether the spectral frequency and amplitude of such spontaneous occipital HFOs of nonepileptic nature differed from those of presumably epileptogenic HFOs emerging from the extraoccipital seizure focus. (iv) We finally explored the temporal and phase relationship between HFOs and δ‐oscillations, since a previous study of macaques using micro‐electrodes showed that centrally presented red light flash resulted in augmentation of oscillations at 37–57 Hz coupled with δ‐oscillations in the primary visual cortex [Lakatos et al.,2008]. We expected that the results would increase the understanding of the significance of occipital δ‐oscillation during slow‐wave sleep.
MATERIALS AND METHODS
Patients
The inclusion criteria consisted of: (i) patients with focal epilepsy undergoing extraoperative subdural ECoG recording as a part of presurgical evaluation in Children's Hospital of Michigan, Detroit, between April 2006 and May 2008, (ii) ECoG sampled from a portion of the lateral‐polar occipital region (defined as the lateral‐to‐polar surface of Brodmann Areas 17/18; Asano et al.,2009b) with a sampling frequency of 1,000 Hz, (iii) patients obtained Engel Class I outcome with a minimum follow‐up period of two years [Engel et al.,1993] following cortical resection without involving the occipital lobe, (iv) measurement of amplitude modulations driven by a visual task [Asano et al.,2009b]. The exclusion criteria consisted of: (i) presence of massive brain malformations (such as large porencephaly, perisylvian polymicrogyria or hemimegalencephaly) which are known to confound the anatomical landmarks for the calcarine sulci, (ii) history of previous epilepsy surgery, (iii) history of visual aura, and (iv) presence of seizure onset zone, interictal spikes, or structural lesions involving the occipital lobe. We studied a consecutive series of 10 patients satisfying both inclusion and exclusion criteria (age range, 3–15 years; five females; Table I). The study has been approved by the Institutional Review Board at Wayne State University, and written informed consent was obtained from the parents or guardians of all subjects.
Table I.
Patient profile
| Patient | Gender | Age (years) | Hand dominance | Antiepileptic medications | Electrode placement | Seizure onset zones on ECoG | Histology | FS IQ |
|---|---|---|---|---|---|---|---|---|
| 1 | Female | 3 | Right | PHT | Rt FPTO | Not captureda | Gliosis | 60 |
| 2 | Male | 5 | Left | LEV, LTG | Lt FPTO | Not capturedb | Gliosis | 77 |
| 3 | Male | 7 | Right | OXC | Rt FPTO | Rt PF | Dysplasia | 109 |
| 4 | Female | 8 | Right | LEV, OXC | Rt FPTO | Not capturedc | Gliosis | 90 |
| 5 | Male | 8 | Right | OXC | Lt FPTO | Lt T | Tumor | 87 |
| 6 | Female | 11 | Right | LEV, OXC, VPA | Rt FPTO | Rt FP | Dysplasia | 77 |
| 7 | Female | 11 | Right | LEV, OXC | Rt FPTO | Rt T | Dysplasia | 99 |
| 8 | Female | 14 | Right | PHT | Lt FPTO | Lt T | Tumor | NA |
| 9 | Male | 14 | Right | LEV, OXC, TPM | Rt FPTO | Rt PT | Dysplasia | 64 |
| 10 | Male | 15 | Right | OXC | Lt FPTO | Not capturedd | Tumor | 86 |
Frequent interictal spikes were noted in the right temporal area.
Frequent interictal spikes were noted in the left central area.
Frequent interictal spikes were noted in the right central area.
Frequent interictal spikes were noted in the left temporal area.
LEV, levetiracetam; LTG, lamotrigine; OXC, oxcarbazepine; PHT, phenytoin; TPM, topiramate; VPA, valproate; Lt, left; Rt, right; F, frontal; P, parietal; T, temporal; O, occipital; ECoG, electrocorticography; FS IQ, full scale IQ; NA, not available.
Subdural Electrode Placement
For extraoperative ECoG recording, platinum grid electrodes (10 mm intercontact distance, 4 mm diameter; Ad‐tech, Racine, WI) were surgically implanted [Asano et al.,2009a] (Fig. 1). Strip electrodes were placed on the occipital‐temporal‐parietal area, in order to determine the spatial relationship between the anterior margin of visual area and the posterior margin of presumed epileptogenic zones. All electrode plates were stitched to adjacent plates and/or the edge of dura mater, to avoid movement of subdural electrodes after placement. In addition, intraoperative pictures were taken with a digital camera before dural closure, to confirm the spatial accuracy of electrode display on the three‐dimensional brain surface reconstructed from MRI [Asano et al.,2009a].
Figure 1.
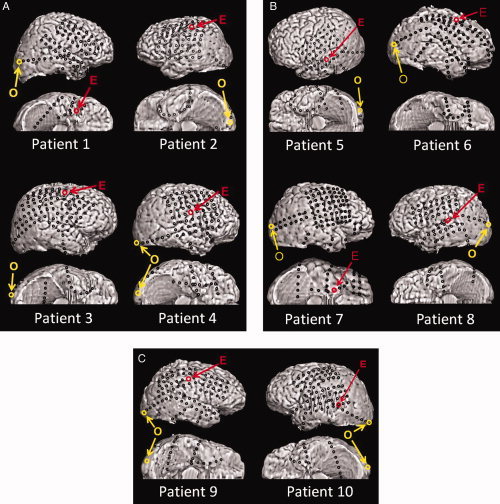
Placement of subdural electrodes. O, the occipital site of interest for each patient; E, the epileptogenic site of interest for each patient. None of our patients had seizure onset zones, interictal epileptiform activities or cortical resection involving the occipital lobe. [Color figure can be viewed in the online issue, which is available at wileyonlinelibrary.com.]
Coregistration of Subdural Electrodes to the Individual Three‐Dimensional MRI
MRI including a T1‐weighted spoiled gradient echo image as well as fluid‐attenuated inversion recovery image was preoperatively obtained [Alkonyi et al.,2009; Fukuda et al.,2010b]. Planar x‐ray images (lateral and anteroposterior) were acquired with the subdural electrodes in place for electrode localization on the brain surface [Alkonyi et al.,2009; Dalal et al.,2008; Miller et al.,2007b; Muzik et al.,2007; von Stockhausen et al.,1997] three metallic fiducial markers were placed at anatomically well‐defined locations on the patient's head for coregistration of the x‐ray image with the MRI. A three‐dimensional surface image was created with the location of electrodes directly defined on the brain surface [Alkonyi et al.,2009; Muzik et al.,2007; von Stockhausen et al.,1997]. The accuracy of this procedure was reported previously as 1.24 ± 0.66 mm with a maximal misregistration of 2.7 mm [von Stockhausen et al.,1997], and was confirmed by intraoperative digital photographs showing in situ locations of the subdural electrodes [Asano et al.,2005; Dalal et al.,2008; Wellmer et al.,2002].
Extraoperative Video‐ECoG Recording
Extraoperative video‐ECoG recordings were obtained for 3 to 5 days, using a 192‐channel Nihon Kohden Neurofax 1100A Digital System (Nihon Kohden America Inc, Foothill Ranch, CA), which has an input impedance of 200 Megaohm, a common mode rejection ratio greater than 110 dB, and an A/D conversion of 16 bits. This clinical recording system has adequate specifications for recording low‐voltage HFOs [Crone et al.,2006; Fukuda et al.,2008; Kobayashi et al.,2010]. For evaluation of interictal and ictal ECoG traces, the sampling frequency was set at 1,000 Hz with the amplifier band pass at 0.08–300 Hz. The averaged voltage of ECoG signals derived from the fifth and sixth intracranial electrodes of the ECoG amplifier (system reference potential) was used as the original reference [Fukuda et al.,2010b]. ECoG signals were then remontaged to a common average reference [Canolty et al.,2007; Miller et al.,2007a; Nishida et al.,2008; Sinai et al.,2005; Towle et al.,2008]. Advantage and limitation of usage of a common average reference were previously discussed [Asano et al.,2009b; Crone et al.,2001]. Channels contaminated with large interictal epileptiform discharges or artifacts were excluded from the common average reference [Fukuda et al.,2008]. No notch filter was used for further analysis in any subjects.
As a part of routine clinical procedures, surface electromyography electrodes were placed on the left and right deltoid muscles [Asano et al.,2005], and electrooculography electrodes were placed 2.5 cm below and 2.5 cm lateral to the left and right outer canthi [Asano et al.,2007]. Antiepileptic medications were discontinued during ECoG monitoring until a sufficient number of habitual seizures were captured. Seizure onset zones were visually determined as previously described [Asano et al.,2009a]. ECoG traces were visually inspected with a low‐frequency filter at 53 Hz (6 dB/oct; zero phase filter) and a sensitivity of 20 μV/mm; thereby, broadband signals synchronized with facial muscle activities seen on electrooculography electrodes were treated as movement artifacts and excluded from further analysis [Nagasawa et al.,2010].
Detection of Spontaneous Occipital as well as Epileptogenic HFOs
A series of ECoG epochs of 30 s between 10 pm and 4 am were visually assessed with a low‐frequency filter of 0.08 Hz (6 dB/oct; zero phase filter). Epochs showing slow‐wave sleep [Bagshaw et al.,2009; Grigg‐Damberger et al.,2007] satisfying the following criteria were included into further analysis: (i) at least 2 h apart from an ictal event [Asano et al.,2007; Worrell et al.,2008], and (ii) room lights were off [Asano et al.,2009b].
Subsequently, the most caudal site in the lateral‐polar occipital area was defined as an “occipital site of interest” in each patient (Fig. 1), and interictal ECoG samples during slow‐wave sleep were visually assessed with a low‐frequency filter of 53 Hz (6 dB/oct; zero phase filter), a sensitivity of 10 μV/mm and a display of 2 s/page. Oscillatory events of six cycles or greater [Worrell et al.,2008] with a frequency of ≥80 Hz were visually detected and labeled as “spontaneous occipital HFOs” below. Subsequently, further events were automatically detected using the automatic pattern search implemented in the BESA® software package [Scherg et al.,2002] (MEGIS Software GmbH, Gräfelfing, Germany). On the basis of visual assessment, false positives (such as artifacts and oscillatory events of five cycles or less) were deleted [Bagshaw et al.,2009; Crépon et al.,2010; Nishida et al.,2008; Schevon et al.,2009; Worrell et al.,2008].
Similarly, interictal HFOs spontaneously emerging from an “epileptogenic site of interest” during slow wave sleep were visually identified and treated as “epileptogenic HFOs” in each patient below (Fig. 1) and included for further analysis. An “epileptogenic site of interest” was defined as the site most consistently exhibiting the seizure onset discharges in patients #3, #5 to #9, whose extraoperative ECoG recording indeed captured seizure events, and as the site showing the most frequent interictal spikes among the surgically resected site in the remaining four patients, whose ECoG recording failed to capture a seizure event, due to the low frequency of epileptic seizures.
Time‐Frequency Analysis of Spontaneous Occipital and Epileptogenic HFOs
This time‐frequency analysis was designed to evaluate by what amount the amplitudes of spontaneous HFOs were augmented compared to an event‐free reference period [Crépon et al.,2010] and whether amplitude augmentation of HFOs reached statistical significance. The principles of our time‐frequency analysis have been previously validated [Asano et al.,2009b; Brown et al.,2008; Fukuda et al.,2008,2010a,b; Hoechstetter et al.,2004; Nagasawa et al.,2010]. Amplitude modulations associated with events of HFOs were evaluated in relation to a trigger time‐point that was defined at the largest negative peak of the oscillations on the filtered ECoG trace at “occipital and epileptogenic sites of interest” (Fig. 2). Sixty of the verified spontaneous HFOs satisfying the following inclusion and exclusion criteria were included for time‐frequency analysis. The inclusion criterion defining events suitable for this time‐frequency analysis was that a period of 2,000 ms prior to the trigger point was free from other HFO events or interictal spike discharges [Crépon et al.,2010; Kobayashi et al.,2009]. The exclusion criterion was that the ECoG trace was affected by artifacts on visual assessment. Inclusion and exclusion of events were performed by two investigators (T.N. and E.A.) while being blinded to the results of time‐frequency analysis.
Figure 2.
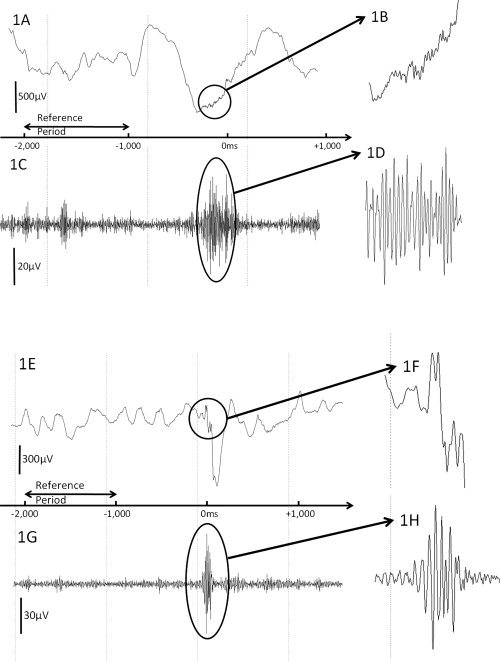
High‐frequency oscillations (HFOs) spontaneously arising from the occipital lobe and seizure focus in patient #5. A: ECoG sampled from the occipital site of interest is shown with a low‐frequency filter of 0.08 Hz and high‐frequency filter of 300 Hz. B: The magnified ECoG trace demonstrates the presence of spontaneous occipital HFOs. C: The same ECoG trace is shown with a low‐frequency filter of 53 Hz and high‐frequency filter of 300 Hz. D: The magnified ECoG trace better demonstrates the presence of spontaneous occipital HFOs. E: ECoG sampled from the epileptogenic site of interest is shown with a low‐frequency filter of 0.08 Hz and high‐frequency filter of 300 Hz. F: The magnified ECoG trace demonstrates the presence of epileptogenic HFOs. G: The same ECoG trace is shown with a low‐frequency filter of 53 Hz and high‐frequency filter of 300 Hz. H: The magnified ECoG trace better demonstrates the presence of epileptogenic HFOs arising from the seizure focus.
Using the BESA® software, each spontaneous HFO event was transformed into the time‐frequency domain using complex demodulation [details of the method are given in Hoechstetter et al.,2004; Papp and Ktonas,1977]. The low‐pass filter used in the complex demodulation process was a finite impulse response (FIR) filter of Gaussian shape, making the complex demodulation effectively equivalent to a Gabor transform. As a result of this transformation, the signal was assigned a specific amplitude and phase as a function of frequency and time relative to the trigger point. Time‐frequency transformation was performed for frequencies between 20 and 300 Hz [Fukuda et al.,2010a] and latencies between −2,000 ms and +1,000 ms relative to the trigger point, in steps of 10 Hz and 5 ms [Fukuda et al.,2008,2010a]. This corresponded to a time‐frequency resolution of ±14.2 Hz and ±7.9 ms (defined as the 50% power drop of the FIR filter).
At each time‐frequency bin we analyzed the percent change in amplitude (averaged across events) relative to the mean amplitude in a reference period, defined as the period from −2,000 to −1,000 ms relative to the trigger point. This parameter is commonly termed “event‐related synchronization and desynchronization” [Pfurtscheller and Lopes da Silva,1999] or “temporal spectral evolution” (TSE) [Salmelin and Hari,1994] in studies of event‐related spectral changes. The 60‐Hz frequency (and its harmonic frequencies) was excluded from the analysis if visual inspection revealed a 60‐Hz artifact peak on the amplitude spectral curve for all subdural electrodes [Fukuda et al.,2010a; Nishida et al.,2008].
To test for statistical significance of each obtained TSE value, the following statistics was performed using the BESA® software [Asano et al.,2009b; Brown et al.,2008]. First, a bootstrapping statistics was applied to obtain an uncorrected P‐value at each time‐frequency bin for each channel. In a second step, correction for multiple testing for multiple neighboring bins was performed using the approach developed by Simes [1986]. In all figures, blue color indicates amplitude attenuation, red color amplitude augmentation in the corresponding time‐frequency bin relative to the reference period. Finally, resulting TSE time‐frequency clusters in a given electrode were regarded statistically significant only if it included a minimum of eight time‐frequency bins arranged in a continuous array spanning (i) at least 20‐Hz in width and (ii) at least 20‐ms in duration [Asano et al.,2009b; Brown et al.,2008; Fukuda et al.,2010b; Nagasawa et al.,2010]. Such a correction provides a very small probability of Type‐I error in determination of significant alteration of amplitudes. We recognize that this approach may underestimate amplitude‐modulations with a restricted frequency band (less than 20‐Hz in width) or that with a short duration (less than 20‐ms).
We determined whether the spectral frequency band exhibiting the largest augmentation differed between spontaneous occipital and epileptogenic HFOs (Wilcoxon Signed Rank Test; SPSS Software; SPSS Inc, Chicago, IL). We also determined the number of sites (i.e., the spatial extent) showing significant augmentation of spontaneous HFOs adjacent to “occipital and epileptogenic sites of interest”, based on the time‐frequency analysis conducted relative to the aforementioned trigger point. We also determined whether the TSE value differed between spontaneous occipital and epileptogenic HFOs. Following previously published observations of human subjects of temporal lobe epilepsy [Ogren et al.,2009], we specifically hypothesized that the percental amplitude increase at 160–300 Hz (defined as “fast‐ripple range”) would be larger in epileptogenic HFOs compared to spontaneous occipital HFOs, whereas that at 80–150 Hz (defined as “ripple range”) would be similar between spontaneous occipital and epileptogenic HFOs. We are aware that the distinction between ripples and fast‐ripples has been arbitrarily defined [Ogren et al.,2009; Zelmann et al.,2009].
Analysis of HFOs Driven by a Visual Task
This time‐frequency analysis was designed to evaluate how HFOs were modulated by a visual task [Asano et al.,2009b]. In short, a series of 60 central‐field picture stimuli were presented while subjects were awake, unsedated, and comfortably seated on the bed in a dark room (duration of stimulus presentation: 1,000 ms; inter‐stimulus interval: 1,000 ms). For frequencies between 20 and 300 Hz and latencies between −300 ms and +2,000 ms relative to the trigger point (i.e., onset of visual stimuli), the aforementioned time‐frequency transformation was performed in steps of 10 Hz and 5 ms. At each time‐frequency bin we analyzed the percent change in amplitude relative to the mean amplitude in a reference period, defined as the resting period between −300 and −100 ms relative to the trigger point. “Visually‐driven oscillations” were defined as oscillatory responses consisting of both phase‐locked (or “evoked,” i.e., a component present after averaging) and non‐phase‐locked (or “induced,” a component absent after averaging) components [Asano et al.,2009b; Nagasawa et al.,2010; Pfurtscheller and Lopes da Silva,1999].
We specifically determined whether the spectral frequency band exhibiting the largest augmentation differed between visually driven and spontaneous occipital HFOs, using the Wilcoxon Signed Rank Test. We also determined whether the spatial extent of the sites showing significant amplitude augmentation differed between visually driven and spontaneous occipital HFOs.
Temporal and Phase Relationship Between HFOs and δ‐Oscillations
This part of the analysis was designed to evaluate the temporal and phase relationship between HFOs and δ‐oscillations. The aforementioned time‐frequency transformation was performed for frequencies between 1 and 20 Hz and latencies between −2,000 ms and +1,000 ms relative to the trigger point, in steps of 0.5 Hz and 100 ms. This corresponded to a time‐frequency resolution of ±0.71 Hz and ±158 ms. The absolute delta amplitude at 1 to 3 Hz (unit: μV) was determined at each time‐frequency bin. We determined whether augmentation of HFOs was associated with delta amplitude increase; specifically, we determined whether the amplitude of δ‐oscillations was increased prior to the peak of HFOs and decreased afterwards. In addition, we determined whether the latency of HFO peaks were correlated to a phase of slow‐wave oscillation at 1.0 through 8.0 Hz in steps of 0.5 Hz; specifically, we determined whether the distribution of each delta phase at the latency of HFO peak differed from a uniform distribution (Rayleigh's test of nonuniformity; Oriana software; Kovach Computing Services, Pentraeth, UK). Phase angles were computed in the range between 0° and 360°, where 0° reflects a peak and 180° reflects a trough of the delta wave at the trigger point (i.e., at the largest negative peak of HFOs). These analyses were employed for spontaneous occipital and epileptogenic HFOs.
RESULTS
Spontaneous Occipital HFOs Observed During Slow‐Wave Sleep
In all 10 patients, spontaneous HFOs at ≥80 Hz were visually identified in the corresponding “occipital site of interest” (Figs. 2 and 3; Video S1 on the website); the mean rate of appearance of spontaneous occipital HFOs in the first available 10 min of slow‐wave sleep [Jacobs et al.,2010b] was 8.8 events per minute (median, 8.7; standard deviation [SD]: 5.2; range, 2.3–20.2). Time‐frequency analysis demonstrated that such spontaneous occipital HFOs involved a ripple band at 80–150 Hz in all patients and a fast‐ripple band at 160–300 Hz in eight patients (all but patients #1 and #8). The spectral frequency band showing the maximum augmentation was 107 Hz on average across subjects (median: 105 Hz; SD: 8.2 Hz). The maximum percent change of ripple component of spontaneous occipital HFOs was +438% on average across subjects (median: +409%; SD: 144%), and that of fast‐ripple component was +88% on average (median: +78%; SD: 49%). The duration of significant augmentation of ripple component was 331 ms on average across subjects (median: 298 ms; SD: 136 ms), and that of fast‐ripple component was 215 ms on average (median: 213 ms; SD: 166 ms). Significant augmentation of spontaneous occipital ripple HFOs was preceded by brief but significant ripple attenuation in seven subjects (Patients #1, #2, and #5 to #9) and followed by brief ripple attenuation in four subjects (Patients #3, #5, #7, and #8) (Fig. 3). Significant augmentation of spontaneous occipital ripple HFOs was confined to a small number of sites and involved the “occipital site of interest” alone in two subjects, involved another single and two adjacent occipital sites in six and two subjects, respectively.
Figure 3.
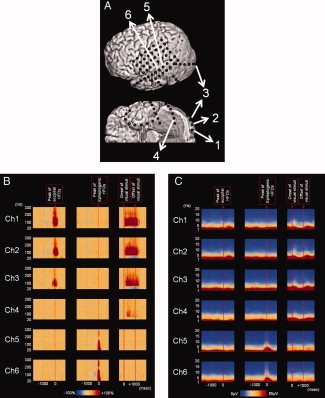
The extent of high‐frequency oscillations (HFOs) and δ‐oscillations in patient #5. A: The locations of subdural electrodes are shown. Channels 1, 2, and 3 were located in the occipital pole. Channel 2 was defined as the occipital site of interest. Channel 4 was located in the ventral occipital‐temporal area. Channels 5 and 6 were located in the lateral temporal area. Channel 6 was defined as the epileptogenic site of interest. B: Left column: Spontaneous occipital HFOs were confined to the occipital pole; no significant HFOs were observed at Channel 4 in the ventral occipital‐temporal area. Middle column: Epileptogenic HFOs were confined to the lateral temporal area. Right column: Following the onset of visual stimuli, visually driven HFOs arose from the occipital pole and were propagated to Channel 4 in the ventral occipital‐temporal area. Following the offset of visual stimuli, visually driven HFOs in the occipital pole gradually subsided. C: Left column: The absolute amplitudes of δ‐oscillations were minimally altered. Middle column: Delta‐oscillations were augmented in the lateral temporal area around the peak of epileptogenic HFOs. Right column: The amplitudes of δ‐oscillations were gradually attenuated following the onset of visual stimuli and augmented following the offset of visual stimuli. [Color figure can be viewed in the online issue, which is available at wileyonlinelibrary.com.]
Epileptogenic HFOs Arising from the Extraoccipital Seizure Focus
In all 10 patients, interictal epileptogenic HFOs at ≥80 Hz were visually identified in their corresponding “epileptogenic site of interest” during slow‐wave sleep (Figs. 2 and 3; Video S2 on the website); the mean rate of appearance was 13.9 events per minute (median: 4.4; SD: 15.4; range: 2.3–40.8). No significant difference in the rate of appearance was found between spontaneous occipital and epileptogenic HFOs (P = 0.5 on the Wilcoxon Signed Rank Test). Time‐frequency analysis demonstrated that such epileptogenic HFOs commonly involved a ripple band in all patients and a fast‐ripple band in nine patients (all but Patient #9); the spectral frequency band showing the maximum augmentation was 89 Hz on average across subjects (median: 85 Hz; SD: 20 Hz), which was somewhat, but not significantly, smaller than that of spontaneous occipital HFOs (P = 0.052). The maximum percent change of epileptogenic ripple HFOs was +741% on average (median: +636%; SD: 549%), and was not different from that of spontaneous occipital HFOs (P = 0.3; Fig. 4). The maximum percent change of epileptogenic fast‐ripple HFOs was +278% on average (median: +81%; SD: 447%), and was not different from that of spontaneous occipital HFOs (P = 0.6). Usage of absolute amplitude measures instead of percent changes in amplitude also failed to discriminate epileptogenic from spontaneous occipital HFOs with statistical significance (Fig. S1 on the website).
Figure 4.
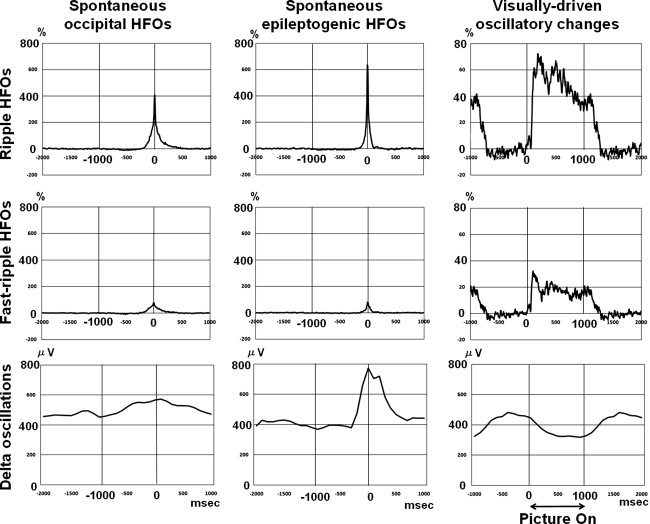
The temporal characteristics of high‐frequency oscillations (HFOs) and δ‐oscillations. Upper row: Grand median percent changes in the amplitude of ripple HFOs (at 80–150 Hz) are plotted. Middle row: Grand median percent changes in the amplitude of fast‐ripple HFOs (at 160–300 Hz) are plotted. Bottom row: Grand median amplitudes of δ‐oscillations (at 1–3 Hz) are plotted. Left column: The grand median amplitudes of spontaneous occipital ripple and fast‐ripple HFOs were increased up to 409% and 78% respectively, compared with the baseline period at −1,000 to −2,000 ms relative to the peak of HFOs. The amplitude of δ‐oscillations was minimally and gradually increased toward the peak of HFOs. Middle column: The grand median amplitudes of epileptogenic ripple and fast‐ripple HFOs were increased up to 636% and 81% respectively, compared with the baseline period. The amplitude of δ‐oscillations was significantly increased toward the peak of HFOs and decreased afterwards. Right column: Following the onset of visual stimuli, the amplitudes of ripple and fast‐ripple HFOs were augmented, and the amplitude of δ‐oscillations began to be attenuated. Following the offset of visual stimuli, augmentation of ripple and fast‐ripple HFOs gradually subsided, and the amplitude of δ‐oscillations began to be augmented.
The duration of significant augmentation of epileptogenic ripple HFOs was 190 ms on average (median, 180 ms; SD, 87 ms), and was smaller than that of spontaneous occipital ripple HFOs (P = 0.01). The duration of epileptogenic fast‐ripple HFOs was 115 ms on average (median, 125 ms; SD, 80 ms), and was not different from that of spontaneous occipital fast‐ripple HFOs (P = 0.1). Significant augmentation of epileptogenic ripple HFOs was preceded by significant ripple attenuation in nine patients (all but Patient #7) and followed by significant ripple attenuation in six patients (all but Patients #3, #5, #9, and #10). Significant augmentation of epileptogenic ripple HFOs involved adjacent 4.3 sites on average (median: 3.5 adjacent sites).
Visually Driven HFOs
In each patient, visually driven HFOs involved ≥80 Hz in each “occipital site of interest”. Time‐frequency analysis demonstrated that such visually driven HFOs involved a ripple band in all patients and a fast‐ripple band in seven patients (all but Patients #2, #4 and #8); the spectral frequency band showing the maximum augmentation was 112 Hz on average across subjects (median: 115 Hz; SD: 23 Hz), which was not different from that of spontaneous occipital HFOs (P = 0.5). The maximum percent change of visually driven HFOs at 80–150 Hz in each “occipital site of interest” was +107% on average (median: 102%; SD: 34%). The maximum percent change of visually driven HFOs at 160–300 Hz in each “occipital site of interest” was +44% on average (median: 44%; SD: 17%).
The duration of significant augmentation of visually driven ripple HFOs in each “occipital site of interest” was 1,033 ms on average (median: 1,108 ms; SD: 316 ms); that of fast‐ripple HFOs was 577 ms on average (median: 353 ms; SD: 599 ms). Significant augmentation of visually driven ripple HFOs measured in each “occipital site of interest” sequentially involved adjacent 2.8 sites on average (median, 3.0 adjacent sites). The spatial extent of significant augmentation of visually driven ripple HFOs was larger than that of spontaneous occipital ripple HFOs (P = 0.01) (Video S3 on the website).
Spontaneous Occipital HFOs Coupled with a Delta Phase
The peak of delta amplitude augmentation in each “occipital site of interest” occurred around the peak of spontaneous occipital HFOs (mean: +140 ms; median: +100 ms; the “+” sign indicates that the delta amplitude maximum followed the peak of HFOs). The delta amplitude at 1.0–3.0 Hz was slowly but significantly increasing within the period of 1,000 ms immediately preceding the peak of spontaneous occipital HFOs (mean rate of change of the delta amplitude: +0.15 μV per ms; 95%CI: +0.04 to +0.26 μV per ms; Fig. 4). Subsequently, a delta amplitude at 1.0–3.0 Hz did not alter in the period of 1,000 ms afterwards (mean slope: −0.08 μV/ms; 95%CI: −0.21 to +0.06 μV/ms).
The Rayleigh's test demonstrated that the distribution of delta phases at 1.0 through 3.0 Hz differed from a uniform distribution at the peak of spontaneous occipital HFOs (P < 0.01); the grand mean z‐value for delta phase at 1.0, 1.5, 2.0, 2.5, and 3.0 Hz was 22.3, 22.2, 17.1, 10.8, and 8.6, respectively. The strength of phase‐locking swiftly decayed from 1.0 to 3.0 Hz (grand mean slope: −7.8 z‐value/Hz; 95%CI: −11.5 to −4.0 z‐value/Hz) and mildly decayed from 3.5 to 8.0 Hz (grand mean slope: −0.74 z‐value/Hz; 95%CI: −0.97 to −0.51 z‐value/Hz) (Fig. 5). These findings suggest that spontaneous occipital HFOs were significantly locked to the delta phases, especially at slower frequencies. The grand mean absolute delta phase at 1.0, 1.5, 2.0, 2.5, and 3.0 Hz was 201°, 208°, 217°, 230°, and 262° at the trigger point (SD: 59°, 58°, 66°, 79°, and 86°).
Figure 5.
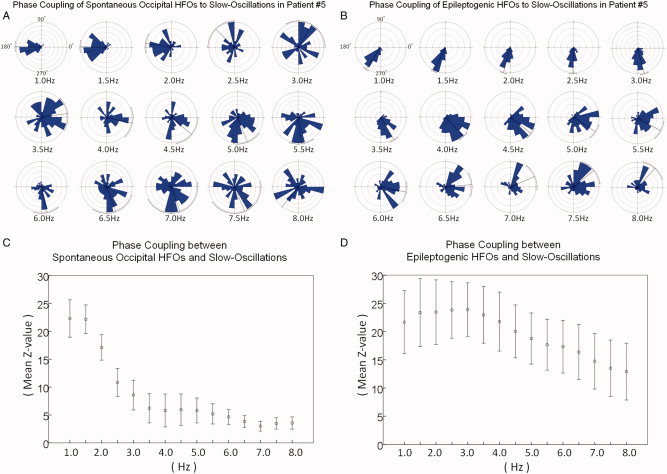
Distributions of phases of slow‐oscillations. A: Shown are the distributions of phases of slow‐oscillations at the peak of spontaneous occipital HFOs in patient #5. B: Similarly, those of epileptogenic HFOs are shown. C: The strength of phase locking to a slow‐oscillation, represented by the grand mean z‐value on the Rayleigh's test, is shown with a standard error bar. Spontaneous occipital HFOs were significantly coupled with delta phases at 1.0 through 3.0 Hz; the strength of phase locking decayed swiftly from 1.0 to 3.0 Hz and mildly from 3.5 to 8.0 Hz. D: Epileptogenic HFOs were strongly and equally coupled with δ‐phases at 1.0 through 3.0 Hz; the strength of phase locking significantly decayed from 3.5 to 8.0 Hz. [Color figure can be viewed in the online issue, which is available at wileyonlinelibrary.com.]
Epileptogenic HFOs Temporally Coupled with a Delta Phase
The peak of delta augmentation in each “epileptogenic site of interest” occurred around the peak of epileptogenic HFOs (mean, 0 m; median, +50 ms; Fig. 4). The delta amplitude at 1.0–3.0 Hz was gradually and significantly increasing in the period of 1,000 ms immediately preceding the peak of epileptogenic HFOs (mean slope: +0.22 μV per ms; 95%CI: +0.04 to +0.40 μV per ms) and subsequently decreasing in the period of 1,000 ms afterwards (mean slope, −0.41 μV/ms; 95%CI, −0.81 to −0.003 μV/ms). These findings suggest that epileptogenic HFOs were temporally coupled with augmentation of delta amplitudes at 1.0–3.0 Hz during slow‐wave sleep.
The Rayleigh's test demonstrated that the distribution of delta phases differed from a uniform distribution at the peak of epileptogenic HFOs (P < 0.01); the grand mean z‐value for delta phase at 1.0, 1.5, 2.0, 2.5, and 3.0 Hz was 21.7, 23.4, 23.4, 23.8, and 23.9, respectively. The strength of phase‐locking did not change from 1.0 to 3.0 Hz (grand mean slope: +1.0 z‐value/Hz; 95%CI: −0.1 to +2.0 z‐value/Hz) but significantly decayed from 3.5 to 8.0 Hz (grand mean slope: −2.2 z‐value/Hz; 95%CI: −2.4 to −2.0 z‐value/Hz) (Fig. 5). These findings suggest that epileptogenic HFOs were significantly locked with delta phases equally across 1.0 through 3.0 Hz. Receiver operating characteristic (ROC) analysis demonstrated that the strength of phase‐locking to 3‐Hz oscillation, represented by a z‐value on the Rayleigh's test, had a significant power to discriminate epileptogenic from spontaneous occipital HFOs in our cohort (P = 0.016; Fig. S2 on the website). The grand mean absolute delta phase at 1.0, 1.5, 2.0, 2.5, and 3.0 Hz for epileptogenic HFOs was 240°, 230°, 240°, 269°, and 289° at the trigger point (SD: 67°, 64°, 63°, 62°, and 59°).
Temporal Relationship Between Visually Driven HFOs and δ‐Oscillations in the Occipital Lobe
The amplitude of δ‐oscillations at each “occipital sites of interest” began to be attenuated around the onset of visual stimuli (mean slope of delta amplitude between the onset and offset of stimuli: −0.28 μV per ms; 95%CI: −0.54 to −0.01 μV per ms) and began to be augmented around the offset of visual stimuli (mean slope of delta amplitude between the offset and onset: +0.24 μV per ms; 95%CI: +0.03 to +0.46 μV per ms; Fig. 4).
DISCUSSION
Spontaneous HFOs Observed on Interictal ECoG Recording
Spontaneous HFOs at ≥80 Hz of physiological nature commonly emerge from the occipital lobe in the absence of visual input during interictal slow‐wave sleep. Taking into account the strictly employed inclusion and exclusion criteria, it is implausible to explain such spontaneous occipital HFOs as a fragment or propagation of pathological HFOs arising from elsewhere. Indeed, time‐frequency analysis, which may detect apparently invisible amplitude changes, demonstrated that spontaneous occipital HFOs were confined to the occipital lobe, whereas HFOs in epileptogenic areas did not spread to the occipital lobe (Fig. 3). Furthermore, a visual task elicited HFOs with a similar spectral frequency band in each “occipital site of interest”.
Our observations suggest that spontaneous occipital HFOs of physiological nature are difficult to distinguish from epileptogenic HFOs arising from elsewhere, based on their spectral frequency and amplitude measures. Neither spectral frequency band showing the maximum augmentation nor the amplitude of epileptogenic HFOs was statistically different from those of spontaneous occipital HFOs. The duration of spontaneous occipital ripple HFOs of physiological nature was significantly larger than that of epileptogenic ripple HFOs; these observations are still consistent with the hypothesis that the longer duration of HFOs may represent the longer excitatory neural processing [Koch et al.,2009; Niessing et al.,2005; Manning et al.,2009; Nishida et al.,2008; Ray et al.,2008]. Unexpectedly, the strength of phase‐locking to a 3‐Hz delta band, represented by a z‐value on the Rayleigh's test, had a significant power to discriminate spontaneous occipital HFOs of physiological nature from epileptogenic HFOs arising from elsewhere (Fig. S2 on the website). This result was attributed to the observation that the strength of phase coupling between spontaneous occipital HFOs and δ‐oscillation swiftly decayed from 1 to 3 Hz. A recent study of six adults with frontal and parietal lobe epilepsy using micro‐ and macro‐electrodes demonstrated that presumably nonepileptic HFOs at ripple range intermittently emerged from the frontal and parietal lobes during slow‐wave sleep and that such HFOs were tightly locked to δ‐oscillation at 1 Hz and around [Csercsa et al.,2010]. Connectivity networks are often altered in the seizure onset zone [Bettus et al.,2009]; difference in δ‐phase coupling between epileptogenic and spontaneous occipital HFOs could be explained by difference in responsiveness to larger network rhythms generated by healthy brain structures. Further studies are warranted to determine whether δ‐phase coupling distinguishes physiological from pathological HFOs or simply differs across anatomical locations.
From a clinical point of view, electroencephalographers take into consideration several measures independent of the morphology of waveforms, in order to avoid the pitfalls of EEG interpretation [Mizrahi,1996]. For example, sharply contoured waves arising from the occipital area immediately following saccadic eye movement are interpreted as lambda waves of physiological nature and not as interictal epileptiform discharges [Mizrahi,1996; Sperling,2003]. Similarly, interictal spontaneous HFOs are interpreted with caution during presurgical evaluation. On the basis of our observations, the occipital cortex spontaneously generates physiological HFOs which may stand out on ECoG traces as prominently as pathological HFOs arising from elsewhere. We propose that HFOs spontaneously and frequently emerging from the caudal portion of the occipital cortex should not be assumed to be epileptogenic unless ictal ECoG recording or neuroimaging provides compelling evidence. The location of primary visual cortex can be estimated using anatomy, electrical neurostimulation and event‐related ECoG analysis [Asano et al.,2009b; Lachaux et al.,2005; Murphey et al.,2009; Tallon‐Baudry et al.,2005].
A substantial proportion of our patients showed brief and weak, but still significant, attenuation of HFOs following its augmentation in both “epileptogenic sites of interest” and “occipital sites of interest”. Temporary amplitude attenuation following interictal pathological HFOs has been reported in studies of animal models of epilepsy and patients with focal epilepsy [Bragin et al.,1999; Kobayashi et al.,2009]; this phenomenon might represent the underlying GABA‐mediated inhibition [de Curtis and Avanzini,2001; Neckelmann et al.,2000]. It has been also reported that the primary visual cortex has an intrinsic mechanism of GABA‐mediated inhibition to maintain appropriate feedforward and feedback systems [Gonchar and Burkhalter,1997; Tsumoto et al.,1979]. On the other hand, a substantial proportion of our patients also showed brief and weak attenuation of HFOs prior to its augmentation in both “epileptogenic sites of interest” and “occipital sites of interest”. Such preceding attenuation of pathological HFOs was detected in interictal epileptiform discharges arising not from the neocortex but from the epileptogenic hippocampus [Kobayashi et al.,2009]. The mechanism of amplitude attenuation of pathological HFOs prior to its augmentation remains to be determined. A recent study of six adults with frontal and parietal lobe epilepsy showed that presumably nonepileptic HFOs at ripple range were alternatingly augmented and attenuated during slow‐wave sleep [Csercsa et al.,2010]; augmentation of such nonepileptic HFOs may be explained by increased cellular and synaptic activity (also known as up‐states), where as attenuation can be explained by hyperpolarization and cellular silence (also known as down‐states) [Steriade and Timofeev,2003].
Difference Between Spontaneous and Sensory‐Driven HFOs
Spontaneous occipital HFOs were spatially limited at a macro‐electrode recording level and confined to smaller areas in the occipital lobe, whereas visually driven HFOs were propagated to the rostral direction and involved larger sites in the visual pathway (Fig. 3). The spectral frequency band of spontaneous occipital HFOs was very similar to that of visually driven HFOs measured in the same site.
Previous studies of rodent sensory (i.e., visual, auditory, and somatosensory) cortex showed that spontaneous neuronal activities are characterized by structured patterns at a single unit level and that there are similarities and differences between spontaneous and sensory‐driven population activities [Luczak et al.,2009; Ringach,2009; Sakata and Harris,2009; Tsodyks et al.,1999]. A study of rodent visual cortex using single unit recording observed very similar spatial patterns in firing rate between spontaneous and visually driven population activities in an area of 2 × 2 mm2 within Brodmann Areas 17 and 18 [Tsodyks et al.,1999]. A study of rodent auditory cortex reported that both spontaneous and auditory‐driven population activities involved pyramidal cells in Layers 2, 3, and 5 as well as putative interneurons, and that spontaneous activity spread upward from deep layers and slowly across columns, whereas auditory‐driven activity initiated in presumptive thalamo‐recipient layers and spread rapidly across columns [Sakata and Harris,2009]. Our observations are consistent with those in previous rodent studies, taking into account that increased firing rate on single unit recording is tightly correlated to augmentation of HFOs [Manning et al.,2009; Ray et al.,2008].
Coupling Between Delta and HFOs in the Occipital Lobe in Humans
Spontaneous occipital HFOs during slow‐wave sleep were coupled with phases of delta oscillations at 1–3 Hz, especially with slower delta phases. This observation may increase the understanding of significance of δ‐oscillations during slow‐wave sleep in humans. Previous studies using scalp EEG recording showed that slow‐wave sleep plays a crucial role in the effective consolidation of visual perceptual learning; deprivation of slow‐wave sleep nullified visual perceptual learning, while the amount of slow‐wave sleep was correlated to improvement in visual perceptual learning [Gais et al.,2000; Stickgold et al.,2000]. It has been believed that sleep‐related visual perceptual learning involves a highly localized low‐level processing area in the primary visual cortex [Sasaki et al.,2010]. A study using functional MRI showed that training of visual perceptual learning resulted in increased blood oxygen level dependent (BOLD) signal in the trained region of the primary visual cortex during the initial non‐REM sleep largely comprising slow‐wave sleep, and the intensity of the BOLD signal was highly correlated with the increase in performance after arousal [Yotsumoto et al.,2009]. Taking into account that increased BOLD on functional MRI is tightly correlated to the amplitude of HFOs but not to δ‐oscillations [Koch et al.,2009; Niessing et al.,2005], it is plausible to hypothesize that increased BOLD elicited by visual perceptual learning may be associated with augmentation of HFOs coupled with δ‐oscillations during slow‐wave sleep.
Methodological Limitations
The benefits of ECoG recording include: (i) less artifacts from cranial muscles than scalp EEG [Brown et al.,2008; Fukuda et al.,2010b; Sinai et al.,2005; Towle et al.,2008], (ii) a better signal‐to‐noise ratio compared with scalp EEG and magnetoencephalography, which record cortical signals from outside of the scalp [Dalal et al.,2009; Gaetz et al.,2008; Zaveri et al.,2009] and (iii) a better temporal resolution compared with functional MRI [Menon and Kim,1999]. Inevitable limitations of ECoG recording include: sampling limitation, antiepileptic drugs, and inability to study healthy volunteers. In our study, patients had subdural electrodes placed only on the cortical surface of the presumed epileptogenic hemisphere; we were not able to evaluate the other hemisphere or subcortical structures. Since large bridging veins were present, we did not place large grid subdural electrodes but strip electrodes in the lateral‐polar occipital area. It is still uncertain whether HFOs with the maximum measures were obtained from one of the active electrodes placed at every 1 cm distance, or such activities occurred in some brain regions between subdural electrodes or the deeply situated cortex along a sulcus. Antiepileptic drugs might have affected the findings of time‐frequency ECoG analysis. It was reported that phenytoin elevated motor thresholds to transcranial magnetic stimulation but had no effect on motor‐evoked potential amplitudes [Chen et al.,1997]. A human study using macro‐electrodes showed that reduction of antiepileptic drugs was followed by a 3% increase in duration of ripple‐band pathological HFOs [Zijlmans et al.,2009]. Although none of the patients had a seizure focus or epileptogenic lesion in the occipital lobe, one cannot completely rule out the possibility of nonspecific dysfunction in the sampled occipital sites.
The topography of seizure foci may have had an impact on the spectral measures of epileptogenic HFOs. A previous ECoG study using macro‐electrodes demonstrated that augmentation of fast‐ripple pathological HFOs was more commonly observed in hippocampal compared to neocortical seizure onset zones [Jacobs et al.,2010a]. The size of subdural electrodes may have affected the results of time‐frequency analyses. A previous study of a rat model of epilepsy using macro‐electrodes demonstrated that 0.85 mm2 macro‐contacts detected pathological HFOs as accurately as 0.018 mm2 contacts did, and that the duration of pathological HFOs only minimally differed between the different size contacts [Chatillon et al.,2009].
Supporting information
Additional Supporting Information may be found in the online version of this article.
Supporting Figure 1.
Supporting Figure 2.
Supporting video 1.
Supporting video 2.
Supporting video 3.
Acknowledgements
The authors are grateful to Harry T. Chugani, M.D., Hiroki Nariai, M.D., Lunliya Thampratankul, M.D., Carol Pawlak, R.EEG/EP.T, Ruth Roeder, R.N., M.S. and the staff of the Division of Electroneurodiagnostics at Children's Hospital of Michigan, Wayne State University for the collaboration and assistance in performing the studies described above.
REFERENCES
- Alkonyi B, Juhász C, Muzik O, Asano E, Saporta A, Shah A, Chugani HT ( 2009): Quantitative brain surface mapping of an electrophysiologic/metabolic mismatch in human neocortical epilepsy. Epilepsy Res 87: 77–87. [DOI] [PMC free article] [PubMed] [Google Scholar]
- Arieli A, Sterkin A, Grinvald A, Aertsen A ( 1996): Dynamics of ongoing activity: Explanation of the large variability in evoked cortical responses. Science 273: 1868–1871. [DOI] [PubMed] [Google Scholar]
- Asano E, Juhász C, Shah A, Muzik O, Chugani DC, Shah J, Sood S, Chugani HT ( 2005): Origin and propagation of epileptic spasms delineated on electrocorticography. Epilepsia 46: 1086–1097. [DOI] [PMC free article] [PubMed] [Google Scholar]
- Asano E, Mihaylova T, Juhász C, Sood S, Chugani HT ( 2007): Effect of sleep on interictal spikes and distribution of sleep spindles on electrocorticography in children with focal epilepsy. Clin Neurophysiol 118: 1360–1368. [DOI] [PMC free article] [PubMed] [Google Scholar]
- Asano E, Juhász C, Shah A, Sood S, Chugani HT ( 2009a): Role of subdural electrocorticography in prediction of long‐term seizure outcome in epilepsy surgery. Brain 132: 1038–1047. [DOI] [PMC free article] [PubMed] [Google Scholar]
- Asano E, Nishida M, Fukuda M, Rothermel R, Juhász C, Sood S ( 2009b): Differential visually‐induced γ‐oscillations in human cerebral cortex. Neuroimage 45: 477–489. [DOI] [PMC free article] [PubMed] [Google Scholar]
- Axmacher N, Elger CE, Fell J ( 2008): Ripples in the medial temporal lobe are relevant for human memory consolidation. Brain 131: 1806–1817. [DOI] [PubMed] [Google Scholar]
- Bagshaw AP, Jacobs J, LeVan P, Dubeau F, Gotman J ( 2009): Effect of sleep stage on interictal high‐frequency oscillations recorded from depth macroelectrodes in patients with focal epilepsy. Epilepsia 50: 617–628. [DOI] [PMC free article] [PubMed] [Google Scholar]
- Bettus G, Guedj E, Joyeux F, Confort‐Gouny S, Soulier E, Laguitton V, Cozzone PJ, Chauvel P, Ranjeva JP, Bartolomei F, Guye M ( 2009): Decreased basal fMRI functional connectivity in epileptogenic networks and contralateral compensatory mechanisms. Hum Brain Mapp 30: 1580–1591. [DOI] [PMC free article] [PubMed] [Google Scholar]
- Bragin A, Engel J Jr, Wilson CL, Fried I, Mathern GW ( 1999): Hippocampal and entorhinal cortex high‐frequency oscillations (100–500 Hz) in human epileptic brain and in kainic acid–treated rats with chronic seizures. Epilepsia 40: 127–137. [DOI] [PubMed] [Google Scholar]
- Bragin A, Engel J Jr, Staba RJ ( 2010): High‐frequency oscillations in epileptic brain. Curr Opin Neurol 23: 151–156. [DOI] [PMC free article] [PubMed] [Google Scholar]
- Brown EC, Rothermel R, Nishida M, Juhász C, Muzik O, Hoechstetter K, Sood S, Chugani HT, Asano E ( 2008): In vivo animation of auditory‐language‐induced γ‐oscillations in children with intractable focal epilepsy. Neuroimage 41: 1120–1131. [DOI] [PMC free article] [PubMed] [Google Scholar]
- Canolty RT, Soltani M, Dalal SS, Edwards E, Dronkers NF, Nagarajan SS, Kirsch HE, Barbaro NM, Knight RT ( 2007): Spatiotemporal dynamics of word processing in the human brain. Front Neurosci 1: 185–196. [DOI] [PMC free article] [PubMed] [Google Scholar]
- Chatillon CE, Zelmann R, Bortel A, Avoli M, Dubeau F, Gotman J ( 2009): Smaller size of macrocontact does not improve HFO detection in intracerebral EEG recordings of the chronic epileptic rat. Epilepsia 50( Suppl 11): 18–19.19682044 [Google Scholar]
- Chen R, Samii A, Caños M, Wassermann EM, Hallett M ( 1997): Effects of phenytoin on cortical excitability in humans. Neurology 49: 881–883. [DOI] [PubMed] [Google Scholar]
- Crépon B, Navarro V, Hasboun D, Clemenceau S, Martinerie J, Baulac M, Adam C, Le Van Quyen M ( 2010): Mapping interictal oscillations greater than 200 Hz recorded with intracranial macroelectrodes in human epilepsy. Brain 133: 33–45. [DOI] [PubMed] [Google Scholar]
- Crone NE, Miglioretti DL, Gordon B, Lesser RP ( 1998): Functional mapping of human sensorimotor cortex with electrocorticographic spectral analysis. II. Event‐related synchronization in the gamma band. Brain 121: 2301–2315. [DOI] [PubMed] [Google Scholar]
- Crone NE, Boatman D, Gordon B, Hao L ( 2001): Induced electrocorticographic gamma activity during auditory perception. Brazier Award‐winning article, 2001. Clin Neurophysiol 112: 565–582. [DOI] [PubMed] [Google Scholar]
- Crone NE, Sinai A, Korzeniewska A ( 2006): High‐frequency gamma oscillations and human brain mapping with electrocorticography. Prog Brain Res 159: 275–295. [DOI] [PubMed] [Google Scholar]
- Csercsa R, Dombovári B, Fabó D, Wittner L, Eross L, Entz L, Sólyom A, Rásonyi G, Szucs A, Kelemen A, Jakus R, Juhos V, Grand L, Magony A, Halász P, Freund TF, Maglóczky Z, Cash SS, Papp L, Karmos G, Halgren E, Ulbert I ( 2010): Laminar analysis of slow wave activity in humans. Brain 133: 2814–2829. doi:10.1093/brain/awq169. [DOI] [PMC free article] [PubMed] [Google Scholar]
- Dalal SS, Edwards E, Kirsch HE, Barbaro NM, Knight RT, Nagarajan SS ( 2008): Localization of neurosurgically implanted electrodes via photograph‐MRI‐radiograph coregistration. J Neurosci Methods 174: 106–115. [DOI] [PMC free article] [PubMed] [Google Scholar]
- Dalal SS, Baillet S, Adam C, Ducorps A, Schwartz D, Jerbi K, Bertrand O, Garnero L, Martinerie J, Lachaux JP ( 2009): Simultaneous MEG and intracranial EEG recordings during attentive reading. Neuroimage 45: 1289–1304. [DOI] [PubMed] [Google Scholar]
- de Curtis M, Avanzini G ( 2001): Interictal spikes in focal epileptogenesis. Prog Neurobiol 63: 541–567. [DOI] [PubMed] [Google Scholar]
- Engel AK, Moll CK, Fried I, Ojemann GA ( 2005): Invasive recordings from the human brain: clinical insights and beyond. Nat Rev Neurosci 6: 35–47. [DOI] [PubMed] [Google Scholar]
- Engel J, van Ness J, Rasmussen PC, Ojemann TB, Ojemann LM ( 1993): Outcome with respect to epileptic seizures Raven Press, New York: In: Engel J, editor. Surgical Treatment of the Epilepsies. pp 609–622. [Google Scholar]
- Engel J Jr, Bragin A, Staba R, Mody I ( 2009): High‐frequency oscillations: What is normal and what is not? Epilepsia 50: 598–604. [DOI] [PubMed] [Google Scholar]
- Fukuda M, Nishida M, Juhász C, Muzik O, Sood S, Chugani HT, Asano E ( 2008): Short‐latency median‐nerve somatosensory‐evoked potentials and induced γ‐oscillations in humans. Brain 131: 1793–1805. [DOI] [PMC free article] [PubMed] [Google Scholar]
- Fukuda M, Juhász C, Hoechstetter K, Sood S, Asano E ( 2010a): Somatosensory‐related gamma‐, β‐and α‐augmentation precedes α‐and β‐attenuation in humans. Clin Neurophysiol 121: 366–375. [DOI] [PMC free article] [PubMed] [Google Scholar]
- Fukuda M, Rothermel R, Juhász C, Nishida M, Sood S, Asano E ( 2010b): Cortical γ‐oscillations modulated by listening and overt repetition of phonemes. Neuroimage 49: 2735–2745. [DOI] [PMC free article] [PubMed] [Google Scholar]
- Gaetz W, Otsubo H, Pang EW ( 2008): Magnetoencephalography for clinical pediatrics: The effect of head positioning on measurement of somatosensory‐evoked fields. Clin Neurophysiol 119: 1923–1933. [DOI] [PubMed] [Google Scholar]
- Gais S, Plihal W, Wagner U, Born J ( 2000): Early sleep triggers memory for early visual discrimination skills. Nat Neurosci 3: 1335–1339. [DOI] [PubMed] [Google Scholar]
- Gonchar Y, Burkhalter A ( 1997): Three distinct families of GABAergic neurons in rat visual cortex. Cereb Cortex 7: 347–358. [DOI] [PubMed] [Google Scholar]
- Gotman J ( 2010): High frequency oscillations: The new EEG frontier? Epilepsia 51( Suppl 1): 63–65. [DOI] [PMC free article] [PubMed] [Google Scholar]
- Grigg‐Damberger M, Gozal D, Marcus CL, Quan SF, Rosen CL, Chervin RD, Wise M, Picchietti DL, Sheldon SH, Iber C ( 2007): The visual scoring of sleep and arousal in infants and children. J Clin Sleep Med 3: 201–240. [PubMed] [Google Scholar]
- Hoechstetter K, Bornfleth H, Weckesser D, Ille N, Berg P, Scherg M ( 2004): BESA source coherence: A new method to study cortical oscillatory coupling. Brain Topogr 16: 233–238. [DOI] [PubMed] [Google Scholar]
- Jacobs J, Levan P, Châtillon CE, Olivier A, Dubeau F, Gotman J ( 2009): High frequency oscillations in intracranial EEGs mark epileptogenicity rather than lesion type. Brain 132: 1022–1037. [DOI] [PMC free article] [PubMed] [Google Scholar]
- Jacobs J, Kobayashi K, Gotman J ( 2010a): High frequency changes during interictal spikes detected by time‐frequency analysis. Clin Neurophysiol 122: 32–42. doi: 10.1016/j.clinph.2010.05.033. [DOI] [PMC free article] [PubMed] [Google Scholar]
- Jacobs J, Zijlmans M, Zelmann R, Chatillon CE, Hall J, Olivier A, Dubeau F, Gotman J ( 2010b): High Frequency EEG Oscillations Correlate with Outcome of Epilepsy Surgery. Ann Neurol 67: 209–220. [DOI] [PMC free article] [PubMed] [Google Scholar]
- Kenet T, Bibitchkov D, Tsodyks M, Grinvald A, Arieli A ( 2003): Spontaneously emerging cortical representations of visual attributes. Nature 425: 954–956. [DOI] [PubMed] [Google Scholar]
- Kobayashi K, Jacobs J, Gotman J ( 2009): Detection of changes of high‐frequency activity by statistical time‐frequency analysis in epileptic spikes. Clin Neurophysiol 120: 1070–1077. [DOI] [PMC free article] [PubMed] [Google Scholar]
- Kobayashi K, Agari T, Oka M, Yoshinaga H, Date I, Ohtsuka Y, Gotman J ( 2010): Detection of seizure‐associated high‐frequency oscillations above 500Hz. Epilepsy Res 88: 139–144. [DOI] [PMC free article] [PubMed] [Google Scholar]
- Koch SP, Werner P, Steinbrink J, Fries P, Obrig H ( 2009): Stimulus‐induced and state‐dependent sustained gamma activity is tightly coupled to the hemodynamic response in humans. J Neurosci 29: 13962–13970. [DOI] [PMC free article] [PubMed] [Google Scholar]
- Lachaux JP, George N, Tallon‐Baudry C, Martinerie J, Hugueville L, Minotti L, Kahane P, Renault B ( 2005): The many faces of the gamma band response to complex visual stimuli. Neuroimage 25: 491–501. [DOI] [PubMed] [Google Scholar]
- Lakatos P, Karmos G, Mehta AD, Ulbert I, Schroeder CE ( 2008): Entrainment of neuronal oscillations as a mechanism of attentional selection. Science 320: 110–113. [DOI] [PubMed] [Google Scholar]
- Le Van Quyen M, Staba R, Bragin A, Dickson C, Valderrama M, Fried I, Engel J ( 2010): Large‐scale microelectrode recordings of high‐frequency gamma oscillations in human cortex during sleep. J Neurosci 30: 7770–7782. [DOI] [PMC free article] [PubMed] [Google Scholar]
- Luczak A, Barthó P, Marguet SL, Buzsáki G, Harris KD ( 2007): Sequential structure of neocortical spontaneous activity in vivo. Proc Natl Acad Sci USA 104: 347–352. [DOI] [PMC free article] [PubMed] [Google Scholar]
- Luczak A, Barthó P, Harris KD ( 2009): Spontaneous events outline the realm of possible sensory responses in neocortical populations. Neuron 62: 413–425. [DOI] [PMC free article] [PubMed] [Google Scholar]
- Manning JR, Jacobs J, Fried I, Kahana MJ ( 2009): Broadband shifts in local field potential power spectra are correlated with single‐neuron spiking in humans. J Neurosci 29: 13613–13620. [DOI] [PMC free article] [PubMed] [Google Scholar]
- Menon RS, Kim SG ( 1999): Spatial and temporal limits in cognitive neuroimaging with fMRI. Trends Cogn Sci 3: 207–216. [DOI] [PubMed] [Google Scholar]
- Miller KJ, Leuthardt EC, Schalk G, Rao RP, Anderson NR, Moran DW, Miller JW, Ojemann JG ( 2007a): Spectral changes in cortical surface potentials during motor movement. J Neurosci 27: 2424–2432. [DOI] [PMC free article] [PubMed] [Google Scholar]
- Miller KJ, Makeig S, Hebb AO, Rao RP, denNijs M, Ojemann JG ( 2007b): Cortical electrode localization from X‐rays and simple mapping for electrocorticographic research: The “Location on Cortex” (LOC) package for MATLAB. J Neurosci Methods 162: 303–308. [DOI] [PubMed] [Google Scholar]
- Mizrahi EM ( 1996): Avoiding the pitfalls of EEG interpretation in childhood epilepsy. Epilepsia 37( Suppl 1): S41–S51. [DOI] [PubMed] [Google Scholar]
- Murphey DK, Maunsell JH, Beauchamp MS, Yoshor D ( 2009): Perceiving electrical stimulation of identified human visual areas. Proc Natl Acad Sci USA. [DOI] [PMC free article] [PubMed] [Google Scholar]
- Muzik O, Chugani DC, Zou G, Hua J, Lu Y, Lu S, Asano E, Chugani HT ( 2007): Multimodality Data Integration in Epilepsy. Int J Biomed Imaging doi:10.1155/2007/13963. [DOI] [PMC free article] [PubMed] [Google Scholar]
- Nagasawa T, Rothermel R, Juhasz C, Fukuda M, Nishida M, Akiyama T, Sood S, Asano E ( 2010): Cortical γ‐oscillations modulated by auditory‐motor tasks—Intracranial recording in patients with epilepsy— Hum Brain Mapp 31: 1627–1642. [DOI] [PMC free article] [PubMed] [Google Scholar]
- Neckelmann D, Amzica F, Steriade M ( 2000): Changes in neuronal conductance during different components of cortically generated spike‐wave seizures. Neuroscience 96: 475–485. [DOI] [PubMed] [Google Scholar]
- Niessing J, Ebisch B, Schmidt KE, Niessing M, Singer W, Galuske RA ( 2005): Hemodynamic signals correlate tightly with synchronized gamma oscillations. Science 309: 948–951. [DOI] [PubMed] [Google Scholar]
- Nishida M, Juhász C, Sood S, Chugani HT, Asano E ( 2008): Cortical glucose metabolism positively correlates with γ‐oscillations in nonlesional focal epilepsy. Neuroimage 42: 1275–1284. [DOI] [PMC free article] [PubMed] [Google Scholar]
- Ogren JA, Wilson CL, Bragin A, Lin JJ, Salamon N, Dutton RA, Luders E, Fields TA, Fried I, Toga AW, Thomson PM, Engel J Jr, Staba RJ ( 2009): 3D surface maps link local atrophy and fast ripples in human epileptic hippocampus. Ann Neurol 66: 783–791. [DOI] [PMC free article] [PubMed] [Google Scholar]
- Papp N, Ktonas P ( 1977): Critical evaluation of complex demodulation techniques for the quantification of bioelectrical activity. Biomed Sci Instrum 13: 135–145. [PubMed] [Google Scholar]
- Pfurtscheller G, Lopes da Silva FH ( 1999): Event‐related EEG/MEG synchronization and desynchronization: Basic principles. Clin Neurophysiol 110: 1842–1857. [DOI] [PubMed] [Google Scholar]
- Ray S, Crone NE, Niebur E, Franaszczuk PJ, Hsiao SS ( 2008): Neural correlates of high‐gamma oscillations (60‐200 Hz) in macaque local field potentials and their potential implications in electrocorticography. J Neurosci 28: 11526–11536. [DOI] [PMC free article] [PubMed] [Google Scholar]
- Ringach DL ( 2009): Spontaneous and driven cortical activity: Implications for computation. Curr Opin Neurobiol 19: 439–444. [DOI] [PMC free article] [PubMed] [Google Scholar]
- Sakata S, Harris KD ( 2009): Laminar structure of spontaneous and sensory‐evoked population activity in auditory cortex. Neuron 64: 404–418. [DOI] [PMC free article] [PubMed] [Google Scholar]
- Salmelin R, Hari R ( 1994): Spatiotemporal characteristics of sensorimotor MEG rhythms related to thumb movement. Neuroscience 60: 537–550. [DOI] [PubMed] [Google Scholar]
- Sasaki Y, Nanez JE, Watanabe T ( 2010): Advances in visual perceptual learning and plasticity. Nat Rev Neurosci 11: 53–60. [DOI] [PMC free article] [PubMed] [Google Scholar]
- Scherg M, Ille N, Bornfleth H, Berg P ( 2002): Advanced tools for digital EEG review: Virtual source montages, whole‐head mapping, correlation, and phase analysis. J Clin Neurophysiol 19: 91–112. [DOI] [PubMed] [Google Scholar]
- Schevon CA, Trevelyan AJ, Schroeder CE, Goodman RR, McKhann G Jr, Emerson RG ( 2009): Spatial characterization of interictal high frequency oscillations in epileptic neocortex. Brain 132: 3047–3059. [DOI] [PMC free article] [PubMed] [Google Scholar]
- Simes RJ ( 1986): An improved Bonferroni procedure for multiple tests of significance. Biometrika 73: 751–754. [Google Scholar]
- Sinai A, Bowers CW, Crainiceanu CM, Boatman D, Gordon B, Lesser RP, Lenz FA, Crone NE ( 2005): Electrocorticographic high gamma activity versus electrical cortical stimulation mapping of naming. Brain 128: 1556–1570. [DOI] [PubMed] [Google Scholar]
- Sperling MR ( 2003): Intracranial electroencephalography In: Ebersole JS, Pedley TA, editors. Current Practice of Clinical Electroencephalography. New York: Lippincott Williams and Wilkins; pp 639–680. [Google Scholar]
- Staba RJ, Wilson CL, Bragin A, Jhung D, Fried I, Engel J Jr ( 2004): High‐frequency oscillations recorded in human medial temporal lobe during sleep. Ann Neurol 56: 108–115. [DOI] [PubMed] [Google Scholar]
- Steriade M, Timofeev I ( 2003): Neuronal plasticity in thalamocortical networks during sleep and waking oscillations. Neuron 37: 563–576. [DOI] [PubMed] [Google Scholar]
- Stickgold R, James L, Hobson JA ( 2000): Visual discrimination learning requires sleep after training. Nat Neurosci 3: 1237–1238. [DOI] [PubMed] [Google Scholar]
- Tallon‐Baudry C, Bertrand O, Hénaff MA, Isnard J, Fischer C ( 2005): Attention modulates γ‐band oscillations differently in the human lateral occipital cortex and fusiform gyrus. Cereb Cortex 15: 654–662. [DOI] [PubMed] [Google Scholar]
- Towle VL, Yoon HA, Castelle M, Edgar JC, Biassou NM, Frim DM, Spire JP, Kohrman MH ( 2008): ECoG gamma activity during a language task: Differentiating expressive and receptive speech areas. Brain 131: 2013–2027. [DOI] [PMC free article] [PubMed] [Google Scholar]
- Tsodyks M, Kenet T, Grinvald A, Arieli A ( 1999): Linking spontaneous activity of single cortical neurons and the underlying functional architecture. Science 286: 1943–1946. [DOI] [PubMed] [Google Scholar]
- Tsumoto T, Eckart W, Creutzfeldt OD ( 1979): Modification of orientation sensitivity of cat visual cortex neurons by removal of GABA‐mediated inhibition. Exp Brain Res 34: 351–363. [DOI] [PubMed] [Google Scholar]
- Urrestarazu E, Chander R, Dubeau F, Gotman J ( 2007): Interictal high‐frequency oscillations (100‐500 Hz) in the intracerebral EEG of epileptic patients. Brain 130: 2354–2366. [DOI] [PubMed] [Google Scholar]
- von Stockhausen HM, Thiel A, Herholz K, Pietrzyk U ( 1997): A convenient method for topographical localization of intracranial electrodes with MRI and a conventional radiograph. Neuroimage 5: S514. [Google Scholar]
- Wellmer J, von Oertzen J, Schaller C, Urbach H, König R, Widman G, Van Roost D, Elger CE ( 2002): Digital photography and 3D MRI‐based multimodal imaging for individualized planning of resective neocortical epilepsy surgery. Epilepsia 43: 1543–1550. [DOI] [PubMed] [Google Scholar]
- Worrell GA, Gardner AB, Stead SM, Hu S, Goerss S, Cascino GJ, Meyer FB, Marsh R, Litt B ( 2008): High‐frequency oscillations in human temporal lobe: Simultaneous microwire and clinical macroelectrode recordings. Brain 131: 928–937. [DOI] [PMC free article] [PubMed] [Google Scholar]
- Yotsumoto Y, Sasaki Y, Chan P, Vasios CE, Bonmassar G, Ito N, Náñez JE Sr, Shimojo S, Watanabe T ( 2009): Location‐specific cortical activation changes during sleep after training for perceptual learning. Curr Biol 19: 1278–1282. [DOI] [PMC free article] [PubMed] [Google Scholar]
- Zaveri HP, Duckrow RB, Spencer SS ( 2009): Concerning the observation of an electrical potential at a distance from an intracranial electrode contact. Clin Neurophysiol 120: 1873–1875. [DOI] [PubMed] [Google Scholar]
- Zelmann R, Jacobs J, Zijlmans M, Chatillon CE, Dubeau F, Gotman J ( 2009): Is there a natural division between ripples and fast ripples in humans. Epilepsia 50( Suppl 11): 32–33.19941519 [Google Scholar]
- Zijlmans M, Jacobs J, Zelmann R, Dubeau F, Gotman J ( 2009): High‐frequency oscillations mirror disease activity in patients with epilepsy. Neurology 72: 979–986. [DOI] [PMC free article] [PubMed] [Google Scholar]
Associated Data
This section collects any data citations, data availability statements, or supplementary materials included in this article.
Supplementary Materials
Additional Supporting Information may be found in the online version of this article.
Supporting Figure 1.
Supporting Figure 2.
Supporting video 1.
Supporting video 2.
Supporting video 3.