Abstract
Although in vivo and cell culture studies have provided useful information about the regulation of the sodium phosphate (NaPi) cotransporters, such studies are unable to provide information at the molecular level about interactions between proteins. The NaPi proteins are found within both intestinal and renal brush border microvilli, and previous work has shown that these microvilli contain scaffolding proteins (PDZ proteins) and myosin motors. The recent development of several advanced imaging techniques has allowed detailed analysis of how NaPi proteins interact with scaffolding proteins and myosin motors. Using techniques such as apical total internal reflection fluorescence microscopy, fluorescence correlation spectroscopy, raster image correlation spectroscopy, and fluorescence lifetime imaging-Förster resonance energy transfer, we have found that a myosin motor is involved in trafficking of the NaPi cotransporters and also that Npt2a and Npt2c seem to have different affinities for the PDZ protein Na+/H+ exchanger regulatory factor 1. Further application of these techniques will provide additional insights into NaPi trafficking and regulation.
Keywords: CKD, Sodium phosphate cotransporters, Advanced imaging techniques, Protein-protein interactions
Although much of our knowledge of phosphorus regulation has come from biochemical assays, imaging techniques have provided valuable insights into the dynamic regulation of the sodium phosphate (NaPi) cotransporters in living cells. Advanced imaging techniques have allowed detailed examination of the molecular interactions between NaPi cotransporters and scaffolding post synaptic density protein (PSD95), drosophila disc large tumor suppressor (DlgA), zona-occludens 1 (zo-1) (PDZ) proteins as well as trafficking of the cotransporters at the cell membrane. This article will summarize some of the recent advances in imaging the NaPi proteins, including total internal reflection fluorescence microscopy (TIR-FM), fluorescence correlation spectroscopy (FCS), raster image correlation spectroscopy (RICS), and fluorescence lifetime imaging-Förster resonance energy transfer (FLIM-FRET).
Total Internal Reflection Fluorescence Microscopy
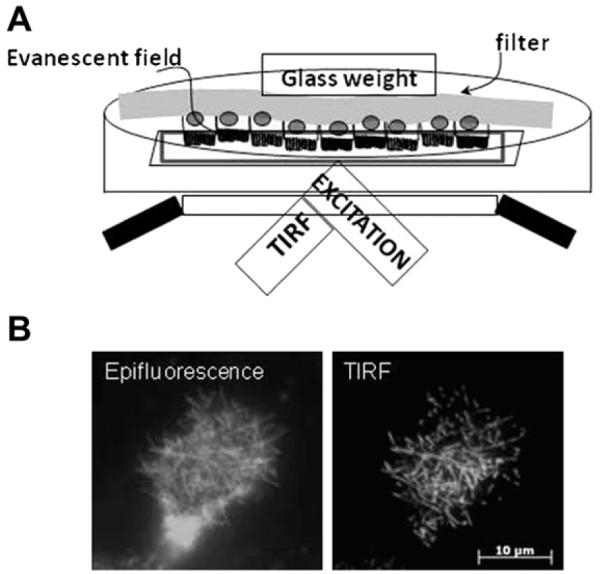
TIR-FM or evanescent field microscopy allows selective examination of events within 100 nm of the coverslip.1,2 In this technique, incident laser light is totally internally reflected producing a field of electromagnetic radiation called the evanescent wave that illuminates objects within approximately 100 nm of the coverslip. Because contributions from fluorophores deeper within the cell are not visible, TIR-FM is an excellent method for studying events at the cell membrane. Traditionally, TIR-FM has been applied to the basolateral surface of the cell. However, changes in the amount of phosphate absorbed or excreted in response to diet or phosphaturic hormones are primarily brought about by alterations in the apical brush border abundance of the NaPi cotransporters.3,4 We have thus developed a method to use TIR-FM to study events at the apical membrane.5 In this method, opossum kidney (OK) cells, which represent a well-established model of the renal proximal tubule,6 are grown to confluence on filters. The confluent opossum kidney responsive to parathyroid hormone (OKP) monolayer is then transfected with fluorescent-tagged Npt2a or Npt2c. The filters are then cut out and placed face down so that the apical brush border membrane (BBM) containing the fluorescent NaPi of interest is in contact with the coverslip (Fig 1A). This gives much better resolution of fluorescent proteins within BBM microvilli as compared with conventional epifluorescence (Fig 1B).
Figure 1.

Total internal reflection fluorescence microscopy (TIR-FM) can be used to study events at the apical membrane. (A) Schematic of apical TIR-FM setup. OKP cells transfected with a fluorescent-tagged protein of interest are grown to confluence on a filter. The filter is cut out and placed upside down in a dish with a coverslip bottom. A glass weight is used to keep the filter in place. Incident laser light is totally internally reflected to produce an evanescent field that only illuminates the brush border microvilli. (B) Comparison between an opossum kidney cell transfected with green fluorescent protein-tagged Npt2a and imaged with conventional epifluorescence (left) versus apical TIR-FM (right). Note that, with apical TIR-FM, the resolution of Npt2a within the microvilli of the brush border membrane is much better than that of conventional epifluorescence. Figure has been adapted from Blaine et al. Am J Physiol Cell Physiol. 2009;297:C1339-C1346.
Using apical TIR-FM, we have been able to follow the time course of parathyroid hormone (PTH)-induced removal of Npt2a5 or Npt2c (Lanzano et al., under revision, 2011) from the BBM in OKP cells. We have found that a dynamic actin cytoskeleton and the unconventional myosin motor myosin VI are necessary for PTH-induced removal of both Npt2a and Npt2c from renal microvilli. In these experiments, apical TIR-FM has provided us with a high resolution window into trafficking events at the apical membrane of living cells.
Fluorescence Correlation Spectroscopy and Raster Image Correlation Spectroscopy
Although TIR-FM gives better resolution of events at the apical membrane as compared with conventional microscopy, it is unable to provide information at the molecular level about interactions between proteins. Interactions between NaPi and PDZ proteins are important to NaPi function and recently mutations in a scaffolding protein (Na+/H+ exchanger regulatory factor 1 [NHERF-1]) have been shown to cause phosphaturia and nephrolithiasis in human beings.7 Interactions between NaPi and scaffolding proteins are better studied using FCS or RICS. Attempts to characterize molecular interactions directly by using visible light microscopy in the intracellular environment are not always trivial because of the intrinsic limited optical resolution, which allows visualization of only coarse subcellular localization. Therefore, protein–protein interactions, lipid–protein interactions, and interactions between small cell organelles are not directly accessible through standard microscopy methods. These processes can only be analyzed with indirect techniques such as RICS,8 cross-correlation raster image correlation spectroscopy (cc-RICS),9 FCS, and/or fluorescence cross-correlation spectroscopy (FCCS).10 >These correlation techniques, by extracting information from molecular dynamics, grant access to processes on a molecular scale, such as diffusion,11 binding stoichiometry,11,12 and clustering.13 Because of their noninvasive character and their single molecule sensitivity, these techniques are very appropriate for studies in living cell environment and, therefore, have become valuable tools for modern live cell investigations.9,14
Fluorescence Correlation Spectroscopy
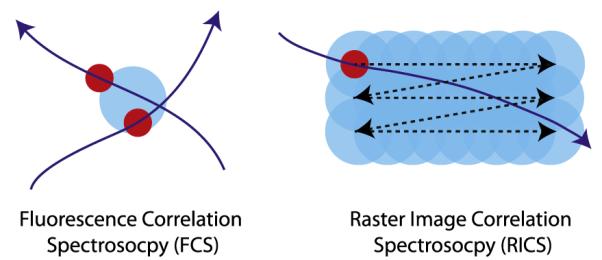
FCS analyzes the fluctuations of the fluorescence intensity of molecules diffusing in and out of a tightly focused excitation beam focal volume (left panel in Fig 2). The correlation of the variations in fluorescence intensity can reveal details about the concentration and mobility of the fluorescent-labeled diffusing species.
Figure 2.

Illustration of the measurement principles of fluorescence correlation spectroscopy and raster image correlation spectroscopy. For interpretation of the references to color in this figure legend, the reader is referred to the Web version of this article.
Fluorescence Cross-Correlation Spectroscopy
FCCS provides information about the co-localization (co-diffusion) of multiple diffusing species on a molecular level. The different species must be spectrally distinct labeled and their fluorescence intensity fluctuations must be recorded in separate channels. In the absence of spectral cross-talk between 2 channels, their cross-correlation can unveil whether the 2 corresponding species are bound to each other or not.
Raster Image Correlation Spectroscopy
RICS is another fluorescence microscopic technique that can measure diffusion coefficients of fluorescent-tagged proteins inside the cytoplasm and on the membrane of a living cell. In FCS, the excitation laser is focused onto the sample at a fixed location to monitor the fluorescence signal as a function of time, whereas for RICS, fluorescence images are taken to calculate the spatial–temporal correlation. In RICS, similar to conventional confocal imaging, the laser is focused and is scanned across the sample line by line to form an image. The scanning focal light volume probes the sample with a pixel scanning time on the order of several microseconds to several milliseconds in the horizontal direction and a line scanning time on the order of several milliseconds to several seconds in the vertical direction. The pixel dwell time and the line scanning time can be considered as an internal clock to measure the diffusion coefficient of a protein. Illustratively, as shown in Figure 2, as the protein is traveling roughly at the scanning speed of the focal light volume, it is continuously being sampled and forming a line in the image. Conversely, if the protein is traveling much slower, the line formed will be much shorter with gradually decreasing line intensity. In living cells, the number of proteins residing in the focal light volume varies depending on the concentration of the protein and proteins diffuse in all directions, thus making the measurement impossible without mathematical correlation techniques to analysis the measured data. A 2-dimensional spatial correlation of the acquired fluorescence images is calculated and because the pixel and line scanning time are known, the diffusion coefficients can be determined from the 2-dimensional spatial correlation.
Cross-Correlation Raster Image Correlation Spectroscopy
cc-RICS is similar to FCCS, in which 2 detectors are used to measure fluorescence signals emitting from 2 different proteins labeled with different fluorescent dyes. If the 2 proteins are aggregating together, they will be scanned by the focal light volume at the same time, thus resulting in a strong spatial cross-correlation from the 2 channels. If the 2 proteins are separated, the 2 fluorescence signals will not be measured at the same time, resulting in no spatial cross-correlation in the acquired images.
RICS and FCS have been applied to measure the diffusion coefficients of the NaPi cotransporter (Npt2b) and NHERF-1 on the apical membrane of intestinal epithelial cells (IECs). IECs were cotransfected with enhanced green fluorescent protein-tagged Npt2b and mCherry-tagged NHERF-1. Both FCS and RICS measurements were performed on an Olympus Fluoview-1000 confocal microscope system (Olympus Corporation, Center Valley, PA) using the photon-counting detection mode for data acquisition. The acquired data were further analyzed using the SimFCS software developed by Enrico Gratton at the University of California, Irvine. The diffusion coefficients were determined to be 0.15 ± 0.06 μm2/s and 0.19 ± 0.9 μm2/s for Npt2b and NHERF-1, respectively, in IEC cells, which are within the range of diffusion coefficients that have been reported for other membrane proteins. Samples of RICS and FCS data acquisition and analysis are shown in Fig 3.
Figure 3.
Diffusion coefficient measurement of Npt2b-enhanced green fluorescent proteins in intestinal epithelial cells using raster image correlation spectroscopy and fluorescence correlation spectroscopy. For interpretation of the references to color in this figure legend, the reader is referred to the Web version of this article.
Fluorescence Lifetime Imaging Microscopy to Determine Förster Resonance Energy Transfer
Another technique to evaluate interactions between 2 proteins is FLIM-FRET. The proximity of 2 fluorescent-labeled proteins can be probed through a process called Förster resonance energy transfer (FRET), in which one of 2 fluorescent species (donor) may transfer its excitation energy to the second (acceptor), if the distance between the 2 is within a proper range (~10 nm).15 Because of this energy transfer, a reduction in the fluorescence intensity of the donor and an increase in that of the acceptor can be observed. FRET has been used extensively for the study of intra- and intermolecular protein interactions by measuring these variations in the fluorescence intensity of fluorescent protein pairs. The intensity-based FRET approaches include: (1) measurement of the donor to acceptor emission ratio, (2) quantification of the recovery of donor fluorescence after acceptor photo-bleaching, (3) or the analysis of the donor fluorescence decay. However, there are several potential artifacts related to FRET intensity measurements, most of them related to cross-talk between the 2 fluorophore colors, which can lead to misleading results if proper controls are not used Another way to study FRET is through the measurement of the variations in the lifetime of the donor and/or acceptor. In the presence of FRET, the lifetime of the donor excited state gets shorter because of the additional decay pathway represented by the transfer of energy to a close acceptor. Fluorescence lifetime imaging microscopy is a microscopy technique that helps to acquire images, where every pixel is characterized not only by a value of the intensity but also by a certain lifetime, and can be used to determine occurrence of FRET. Fluorescence lifetime imaging microscopy is the most rigorous method for measuring FRET, providing advantages with respect to the intensity-based methods. These advantages are mainly the independence of the measurement from the concentration of the fluorophores in the sample and the suppression of problems related to fluorescence cross-talk because only donor fluorescence is measured.
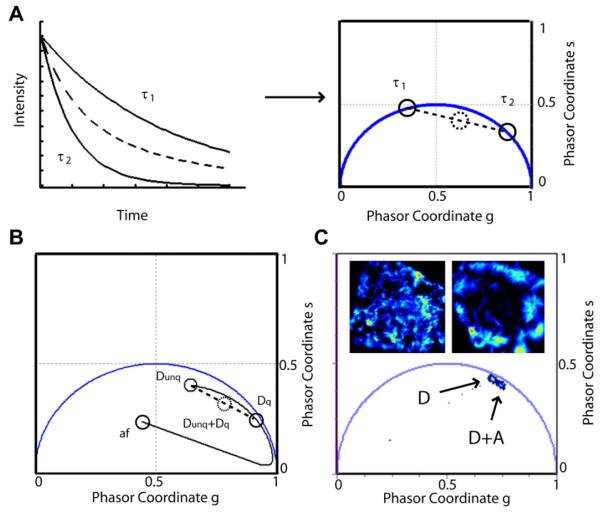
In contrast, the analysis of lifetime data can be complex and somewhat misleading. This is especially true when the decay of the observed species is not a single exponential but is characterized instead by the sum of 2 or more exponential decays (Fig 4A), as is the case of fluorescent proteins. The analysis to extract the multiple components of the decay can be difficult or at least not straightforward. To overcome this issue, a different approach has been recently introduced to represent lifetime data in a more intuitive way, making use of phasors.16
Figure 4.
Analysis of fluorescence lifetime imaging-Förster resonance energy transfer in the phasor plot. (A) Single-exponential lifetimes τ1 and τ2 (solid lines) are transformed into distinct phasors (solid circles) lying along the universal circle of the phasor plot. However, a multi-exponential decay (dashed line) transformed to a phasor will lie inside the universal circle (dashed circle). (B) Förster resonance energy transfer efficiency is calculated by using a trajectory linking the background because of autofluorescence and the unquenched donor phasor. The acceptor + donor shifted phasor (dashed circle) corresponds to a mixture of unquenched and quenched donors. The intersection with the trajectory corresponds to a FRET efficiency E of the pure species of quenched donors. (C) Fluorescence lifetime imaging-Förster resonance energy transfer measurement of Npt2a/Na+/H+ exchanger regulatory factor 1 interactions. Cells transfected with only sodium phosphate-2a (D) are compared with cells transfected with Npt2a and Na+/H+ exchanger regulatory factor 1 (D + A). The phasor of (D + A) is shifted toward the region of lower lifetime showing the occurrence of FRET. For interpretation of the references to color in this figure legend, the reader is referred to the Web version of this article.
In the phasor method, data are analyzed in a Fourier-transformed space, where each fluorescence decay measurement is represented in the form of a phasor, that is, a point in the complex plane, as shown in Figure 4A. That is, each measurement value is transformed to a vector (or phasor) that has a position in the plot representation. Phasors corresponding to mono-exponential decays lie on the “universal circle” (blue line), with lifetimes getting shorter on moving away from the origin; phasors of multi-exponential decays lie within the universal circle because they are linear combinations of mono-exponential phasor components.
FRET can be analyzed in the phasor plot without fitting to multiple exponential components. The quantification of FRET is achieved by analyzing the shift occurring between the phasors of the donor only and the donor in presence of the acceptor. Therefore, this method measures relative differences of lifetime phasor between 2 or more conditions instead of obtaining a numeric lifetime value for each condition. Knowing the background phasors (due to autofluorescence and unquenched donors Dunq) a trajectory of variable efficiency (0%-100%) can be calculated (Fig 4B). A phasor along this trajectory corresponds to pure species of donor quenched (Dq) with FRET efficiency E.
However, especially in the case of intermolecular FRET,17 a pixel may contain a mixture of Dq and Dunq with quenched fractions (fq) and unquenched fraction (funq), respectively. For this pixel, the phasor will be a normalized linear combination of the phasors of Dq and Dunq and will be located along the segment connecting them, at a distance from Dunq proportional to the fraction of interacting donors, fq (Fig 4B). It follows that from the measurement of FRET between 2 proteins, the shift in the phasor plot depends on 2 quantities: the efficiency of FRET in the bound state and the fraction of donors that are interacting effectively.
Application of FLIM-FRET to Measure Interaction of Npt2a and Npt2c with NHERF-1 and PDZK1 in OK Cells
We have successfully used the FLIM-FRET approach to study the differential interactions between the NaPi cotransporters and the scaffolding PDZ proteins NHERF-1 and postsynaptic density protein (PSD95), drosophila disc large tumor suppressor (DlgA), zonula occludens-1 protein (zo-1) domain containing 1 (PDZK1) (Giral et al, JBC under revision, 2011). The molecular interaction with these PDZ proteins may be related with the differential adaptation of the NaPi transporters to hormonal and dietary conditions.
Different NaPi and PDZ proteins constructs, using the FRET pair Cerulean and enhanced yellow fluorescent protein, were expressed in live OK cells. FRET occurrence of these protein pairs was probed by the shift toward the direction of lower lifetimes when comparing cells transfected with donor only (D) with cells expressing donor plus acceptor (D + A) species. Figure 4C shows an example of these results, where cells expressing only Cerulean-Npt2a (D) are compared with cells expressing Cerulean-Npt2a + enhanced yellow fluorescent protein-NHERF-1 (D + A). The corresponding phasors plot below the images show a shift of the lifetimes, involving the occurrence of FRET and therefore the interaction between Npt2a and NHERF-1.
On comparing the interactions of NHERF-1 with the 2 NaPi cotransporters, we observed that the shift of the phasor was much greater for Npt2a/NHERF-1 than for Npt2c/NHERF-1. As shown previously, the shift of the phasor depends on the efficiency of FRET and the fraction of interacting donors for each pair studied, and these parameters can be quantified. Calculated FRET efficiency is indeed significantly higher for Npt2a/NHERF-1 than for Npt2c/NHERF-1, suggesting that NHERF-1 interacts stronger with Npt2a than with Npt2c. We followed a similar approach to study the interactions of PDZK1 with the NaPi cotransporters and found that Npt2c/PDZK1 has slightly but significantly higher FRET efficiency than Npt2a/PDZK1. This may partially explain the differential response of Npt2a and Npt2c to PTH. Although the PTH-induced removal of Npt2a from the renal BBM occurs within an hour, the same process takes several hours for Npt2c.
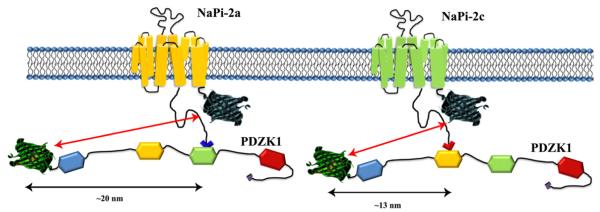
This approach offers us very important information about the interaction of different proteins but we have to be careful in the interpretation of these findings. FRET dependence on the distance between the fluorophores is very sharp, reducing efficiency by a power of 6 when those distances increase. However, that strong dependence on distance complicates the comparison between different interacting proteins. For example, in our study, we assumed that we could compare the FRET efficiency for the interactions with NHERF-1 because both NaPi cotransporters interact with the same PDZ domain, the fluorescent proteins are attached in the same position, and the structure of the 2 NaPi transporters, although unknown, is considered to be very similar. Conversely, Npt2a interacts with the third PDZ domain and Npt2c with the second domain of PDZK1, thus the distances between their fluorophores are most likely different (Fig 5). In this respect, we can say that both NaPi transporters are interacting with PDZK1 but we cannot tell which interaction is stronger.
Figure 5.
Representation of interactions of Npt2a/PDZK1 and Npt2c/PDZK1. Npt2a and Npt2c interact with different PDZ domains of PDZK1, PDZ3 and PDZ2, respectively. Therefore, during the interaction of the pairs Npt2a/PDZK1 and Npt2c/PDZK1, the distance of the fluorophores is likely to be different between the 2 pairs and the FRET efficiencies are not comparable. For interpretation of the references to color in this figure legend, the reader is referred to the Web version of this article.
Another interesting approach that the phasor FLIM-FRET measurements offer us is to quantify the relative fraction of interacting proteins under different experimental conditions. If the interactions between 2 proteins are transitory and can be modified under stimuli, as it happens in most of the cases, we can compare the shift of the phasor and quantify if there is an increase or reduction in the fraction of proteins undergoing FRET. We studied the interactions between Na/Pi transporters and PDZ proteins under different Pi concentrations in the extracellular medium (2, 1, and 0.1 mM Pi). The FRET efficiency measured from cells adapted to different contents of Pi did not change significantly for any of the NaPi/PDZ protein pairs under study. Instead, a significant increase was observed in the fraction of interacting donors for Npt2c/PDZK1 and Npt2a/NHERF-1 pairs in response to low Pi.
Conclusions
Recent advances in dynamic imaging techniques have provided detailed knowledge at the molecular level of the response of the NaPi cotransporters and their interacting proteins to alterations in phosphate and phosphaturic hormones. This knowledge will likely be broadened as new techniques are developed and applied to the study of these proteins in regulation of phosphate homeostasis.
Acknowledgments
This work was supported in part by National Institutes of Health, RO1 DK066029 (M.L., E.G., L.L., and H.G.), supplemental grant 3RO1 AG026259 (Y.C.), NIH K08 DK080989 (J.B.), NIH P41-RRO3155 (E.G., L.L.), and P50-GM076516 (E.G., L.L.).
References
- 1.Toomre D, Steyer JA, Keller P, Almers W, Simons K. Fusion of constitutive membrane traffic with the cell surface observed by evanescent wave microscopy. J Cell Biol. 2000;149:33–40. doi: 10.1083/jcb.149.1.33. [DOI] [PMC free article] [PubMed] [Google Scholar]
- 2.Beaumont V. Visualizing membrane trafficking using total internal reflection fluorescence microscopy. Biochem Soc Trans. 2003;31(Pt 4):819–823. doi: 10.1042/bst0310819. [DOI] [PubMed] [Google Scholar]
- 3.Miyamoto K, Segawa H, Ito M, Kuwahata M. Physiological regulation of renal sodium-dependent phosphate cotransporters. Jpn J Physiol. 2004;54:93–102. doi: 10.2170/jjphysiol.54.93. [DOI] [PubMed] [Google Scholar]
- 4.Forster IC, Hernando N, Biber J, Murer H. Proximal tubular handling of phosphate: a molecular perspective. Kidney Int. 2006;70:1548–1559. doi: 10.1038/sj.ki.5001813. [DOI] [PubMed] [Google Scholar]
- 5.Blaine J, Okamura K, Giral H, et al. PTH-induced internalization of apical membrane NaPi2a: role of actin and myosin VI. Am J Physiol. 2009;297:C1339–C1346. doi: 10.1152/ajpcell.00260.2009. [DOI] [PMC free article] [PubMed] [Google Scholar]
- 6.Malstrom K, Stange G, Murer H. Identification of proximal tubular transport functions in the established kidney cell line, OK. Biochim Biophys Acta. 1987;902:269–277. doi: 10.1016/0005-2736(87)90305-1. [DOI] [PubMed] [Google Scholar]
- 7.Karim Z, Gerard B, Bakouh N, et al. NHERF1 mutations and responsiveness of parathyroid hormone. N Engl J Med. 2008;359:1128–1135. doi: 10.1056/NEJMoa0802836. [DOI] [PubMed] [Google Scholar]
- 8.Rossow MJ, Sasaki JM, Digman MA, Gratton E. Raster image correlation spectroscopy in live cells. Nat Protoc. 2010;5:1761–1774. doi: 10.1038/nprot.2010.122. [DOI] [PMC free article] [PubMed] [Google Scholar]
- 9.Digman MA, Wiseman PW, Horwitz AR, Gratton E. Detecting protein complexes in living cells from laser scanning confocal image sequences by the cross correlation raster image spectroscopy method. Biophys J. 2009;96:707–716. doi: 10.1016/j.bpj.2008.09.051. [DOI] [PMC free article] [PubMed] [Google Scholar]
- 10.Bacia K, Kim SA, Schwille P. Fluorescence cross-correlation spectroscopy in living cells. Nat Methods. 2006;3:83–89. doi: 10.1038/nmeth822. [DOI] [PubMed] [Google Scholar]
- 11.Digman MA, Gratton E. Analysis of diffusion and binding in cells using the RICS approach. Microsc Res Tech. 2009;72:323–332. doi: 10.1002/jemt.20655. [DOI] [PMC free article] [PubMed] [Google Scholar]
- 12.Kim SA, Heinze KG, Bacia K, Waxham MN, Schwille P. Two-photon cross-correlation analysis of intracellular reactions with variable stoichiometry. Biophys J. 2005;88:4319–4336. doi: 10.1529/biophysj.104.055319. [DOI] [PMC free article] [PubMed] [Google Scholar]
- 13.Patel RC, Kumar U, Lamb DC, et al. Ligand binding to somatostatin receptors induces receptor-specific oligomer formation in live cells. Proc Natl Acad Sci U S A. 2002;99:3294–3299. doi: 10.1073/pnas.042705099. [DOI] [PMC free article] [PubMed] [Google Scholar]
- 14.Gratton E, Breusegem S, Barry N, Ruan Q, Eid J. Fluctuation correlation spectroscopy in cells: determination of molecular aggregation. In: Shen X, Van Wijk R, editors. Biophotonics-Optical Science and Engineering for the 21st Century. Kluwer Academic/Plenum Publishers; New York, NY: 2005. pp. 1–14. [Google Scholar]
- 15.Piston DW, Kremers GJ. Fluorescent protein FRET: the good, the bad and the ugly. Trends Biochem Sci. 2007;32:407–414. doi: 10.1016/j.tibs.2007.08.003. [DOI] [PubMed] [Google Scholar]
- 16.Digman MA, Caiolfa VR, Zamai M, Gratton E. The phasor approach to fluorescence lifetime imaging analysis. Biophys J. 2008;94:L14–L16. doi: 10.1529/biophysj.107.120154. [DOI] [PMC free article] [PubMed] [Google Scholar]
- 17.Truong K, Ikura M. The use of FRET imaging microscopy to detect protein-protein interactions and protein conformational changes in vivo. Curr Opin Struct Biol. 2001;11:573–578. doi: 10.1016/s0959-440x(00)00249-9. [DOI] [PubMed] [Google Scholar]


