

Abstract
Glutathione (GSH) and glutathione disulfide (GSSG) form the principal thiol redox couple in the endoplasmic reticulum (ER); however, few studies have attempted to quantify GSH redox status in this organelle. To address this gap, GSH and GSSG levels and the extent of protein glutathionylation were analyzed in rat liver microsomes. Because of the likelihood of artifactual GSH oxidation during the lengthy microsomal isolation procedure, iodoacetic acid (IAA) was used to preserve the physiological thiol redox state. Non-IAA-treated microsomes exhibited a GSH:GSSG ratio between 0.7:1 to 1.2:1 compared to IAA-treated microsomes that yielded a GSH:GSSG redox ratio between 4.7:1 and 5.5:1. The majority of artifactual oxidation occurred within the first 2 h of isolation. Thus, the ER GSH redox ratio is subject to extensive ex vivo oxidation and when controlled, the microsomal GSH redox state is significantly higher than previously believed. Moreover, in vitro studies showed that PDI reductase activity was markedly increased at this higher thiol redox ratio versus previously reported GSH:GSSG ratios for the ER. Lastly, we show by both HPLC and Western blot analysis that ER proteins are highly resistant to glutathionylation. Together, these results may necessitate a re-evaluation of GSH and its role in ER function.
Introduction
The endoplasmic reticulum (ER) plays an essential role in many vital cellular functions, including synthesis of macromolecules, regulation of cellular calcium homeostasis, and the maturation, processing, and transport of secretory and membrane-associated proteins (11). Generally, proteins assembled in the ER are rich in disulfide bonds that help to promote efficient folding and oligomerization of nascent polypeptide chains (9). While disulfide bond formation occurs spontaneously and independently of enzymatic processes, to ensure correct intramolecular disulfide bonding is achieved, the ER contains chaperones and oxidoreductases to ultimately produce a properly folded protein (20, 25, 32, 33, 41). The activities of resident ER folding enzymes are highly dependent on the reduction/oxidation (redox) environment, and even small perturbations in redox status greatly affects enzymatic activity and, as a result, protein folding kinetics (27, 28, 30, 31).
To ensure protein processing, the ER lumen appears to be more oxidizing than other compartments of the cell (2, 17). This environment likely serves to maintain critical enzymes in their preferred redox state to ensure optimal enzymatic activity in mammals (2, 17). For example, members of the ryanodine receptor superfamily, responsible for Ca2+ release from ER stores, contain sulfhydryl groups that function as a redox “switch” which either induces or inhibits Ca2+ release (7, 22, 40, 42, 44). Generally, oxidation activates these receptors, whereas thiol reduction is inhibitory (7). Furthermore, protein disulfide isomerase (PDI) requires its active site thiols to be oxidized to catalyze disulfide bond formation for activity, and only a slight reductive shift in the ER converts PDI to a reduced state (31).
Due to its shear amount, glutathione (GSH) is the principal thiol compound of the ER and has been implicated in maintaining the ER thiol redox environment (1). However, the precise role of GSH in the ER remains unclear. For example, GSH may act as an antioxidant in scavenging reactive oxygen species (6), as a reductant to maintain protein sulfhydryls in a reduced state (9), or conversely, as an adjunct in forming native disulfide bonds within proteins entering the secretory pathway (5). Despite the lack of a consensus regarding its precise role in the ER, there is a general appreciation that GSH is directly tied to normal ER function, and changes in the GSH redox state have been associated with pathophysiologies that target and disrupt the ER (1, 30, 31).
Because of its importance to the ER, it is surprising that only a few studies have attempted to directly quantify ER GSH levels and determine its redox state. An initial study by Hwang et al. used a tetrapeptide probe to measure the general ER redox environment in a hybridoma cell line (17). This group determined the probe’s thiol redox ratio, and thus the ER glutathione:glutathione disulfide (GSH:GSSG) ratio, to be between 1.5:1 to 3.3:1 (17). Recently, a more direct measurement of rat liver microsomal ER GSH redox status was made using monobromobimane as a thiol derivatizing agent in isolated rat liver microsomes (2). The GSH:GSSG ratio was more precisely estimated to be 3:1, which again suggested that the ER was a generally more oxidizing environment than other compartments of the cell (2). However, both studies failed to control for ex vivo oxidation during sample preparation. Thus, the potential exists that thiol oxidation occurs during cell culture (38) and microsomal isolation which may be a confounding factor in the proper assessment of thiol redox status. Given the importance of GSH redox state as a determinant in ER function, it is the goal of the current study to define more accurately the ER glutathione redox status by controlling for the likelihood of ex vivo oxidation.
By modifying an established method previously used to quantify glutathione in other subcellular organelles (10, 12–14, 19, 39), we show that both GSH and GSSG can be quantified simultaneously in microsomes isolated from rat liver. As such, iodoacetic acid (IAA) was incorporated into the microsomal isolation procedure to preserve the GSH redox state. Herein, we show that ex vivo oxidation is extensive during microsomal isolation, and its control reveals the ER GSH:GSSG ratio to be significantly higher than previously reported. Moreover, we show that ER protein glutathionylation, which was previously shown to be extensive (2), is actually quite small with only a select number of proteins modified. These results may necessitate a re-evaluation of the precise role that microsomal GSH:GSSG redox state plays in normal ER function.
Materials and Methods
Materials
High performance liquid chromatography (HPLC) solvents were all HPLC grade (Fisher Scientific, Pittsburgh, PA). All other chemicals were reagent grade or the highest quality available from Sigma-Aldrich (St. Louis, MO).
Isolation of rat liver microsomes
Fischer 344 rats (8–11 mo old; National Institute on Aging animal colonies) were anesthetized with diethyl ether, the livers perfused with ice-cold phosphate buffered saline, pH 7.5 (PBS), to remove blood, and then sacrificed according to Institutional Animal Care and Use Committee (IACUC)-approved guidelines. The livers were quickly excised and placed on ice. Microsomes were isolated as previously reported with some modifications (21). Briefly, liver was homogenized 1:7 [wt/vol] in ice-cold homogenization buffer (10 mM potassium phosphate [monobasic], 10 mM potassium phosphate [dibasic], 150 mM HEPES, 75 nM potassium chloride, 1 mM EDTA; pH 7.5) and microsomes isolated by differential centrifugation. The microsomal pellet was further washed (100 mM potassium pyrophosphate and 1 mM EDTA, pH 7.4) to remove heme and spun again at 100,000 g for 95 min at 4°C. The microsomal pellet was resuspended in 750 μl of 100 mM potassium phosphate buffer containing 30% glycerol [vol/vol] and 1 mM EDTA, pH 7.25. Only freshly isolated microsomes were used for experimentation. Assays for purity revealed that microsomal preparations using this procedure had minimal contamination of Golgi using the 59 kDa Golgi protein (Abcam #ab23932) as a marker, but were highly enriched for Calnexin (Abcam #ab22595) (data not shown). Thus, the procedure employed in this study results in microsomes relatively free of contaminating membranes.
Incorporation of iodoacetic acid
In some experiments, the portal veins of rats were cannulated, immediately perfused with homogenization buffer containing 70 mM iodoacetic acid (IAA; Sigma-Aldrich) to immediately arrest thiol/disulfide exchange at the time of animal sacrifice, and microsomes were isolated. In other studies, livers were perfused to remove blood and then homogenized in buffer containing 70 mM IAA. To determine if and when artifactual thiol oxidation occurred during microsome isolation, timecourse experiments were undertaken where IAA (70 mM, final concentration) was added at 2 h intervals throughout the ~ 6 h microsomal isolation procedure.
Preparation of microsomal samples for free glutathione analysis
Immediately following isolation of microsomes, 300 μl of the microsomal suspension was added directly to an equal volume of 15% (vol/vol) perchloric acid (PCA; Fisher Scientific) containing 10 mM diethylenetriaminepentaacetic acid (DTPA; Sigma-Aldrich), and incubated on ice for 15 min. Acidified samples were then spun at 15,000 g for 15 min, the supernatant removed, and stored at −20°C until derivatization and glutathione analysis. PCA (300 μl of a 15% stock, containing 10 mM DTPA) was then added back to the pellet, snap-frozen in liquid nitrogen, and stored at −80°C for protein-bound glutathione analysis (described below).
Determination of protein glutathionylation
To determine the amount of glutathione present as mixed disulfides with proteins, three validation protocols were followed. First, freshly isolated microsomes treated with or without IAA were incubated with dithiothreitol (DTT; 0.1 mM) for 1 h at room temperature, and the extent of GSH liberated was quantified by HPLC. Second, a stronger thiol reductant, tris(2-carboxyethyl)phosphine hydrochloride (TCEP; 10 mM), was similarly used to release GSH bound to proteins (3). Lastly, acid-precipitated protein pellets were re-solublized in 0.1 M phosphate buffer and the pH adjusted to 7.4 with 3 M KOH. These samples were then incubated in the presence of 1 mM DTT for 24 h at 4°C and the amount of GSH released determined.
High performance liquid chromatography for glutathione
GSH quantification was performed as described, using dansyl chloride as a fluorophore and γ-glutamylglutamate (γ-GG) as an internal standard for derivatization efficiency (10, 19). Analyte separation was achieved using a 3-aminopropyl column (200 × 2.6 mm i.d.; Custom LC, Houston, TX) using a gradient of two buffers (Buffer A, 80/20 methanol/water (vol/vol); Buffer B, 62.5% MeOH (vol/vol), 20% acetate stock (217.6 g sodium acetate trihydrate [Fisher Scientific] in 400 ml glacial acetic acid) and 17.5% glacial acetic acid (vol/vol). By this means, both GSH and GSSG can be simultaneously separated and quantified relative to authentic standards from a single biological sample.
Western blot analysis for glutathionylated ER proteins
As a negative control, microsomes were incubated in 50 mM Tris buffer, pH 7.25, containing 5 mM EDTA, 1% Triton-X 100, and 1 mM DTT for 1 h at 25°C to release and remove all glutathione present as mixed disulfides. As a positive control, microsomal samples were incubated with 1 or 10 mM GSSG in identical conditions as described above. Freshly isolated rat liver microsomes were added directly to 3X loading buffer (0.5 M Tris-HCl, pH 6.8, 10% SDS [wt/vol], 25% glycerol [vol/vol], and 0.5% bromphenol blue [wt/vol]). Protein was separated on 10% polyacrylamide gels (Pierce, Rockford, IL) and transferred to PVDF membranes (Millipore, Billerica, MA). The levels of glutathionylated proteins were detected using a mouse monoclonal antibody (Fitzgerald Industries, Concord, MA), standardized to BiP/Grp78 levels as a loading control (Stressgen, Ann Arbor, MI), visualized using appropriate horseradish peroxidase-conjugated secondary antibodies (Amersham Pharmacia Biotech, Buckinghamshire, UK) in conjunction with a chemiluminescent substrate (Amersham Pharmacia) and Enhanced Chemiluminescent Film (Amersham Pharmacia).
Insulin turbidity assay
The insulin turbidity assay, a means to assess how modulating GSH redox state affects PDI-catalyzed reduction of insulin disulfides, was performed essentially as described (16). Briefly, 0.25 μM recombinant PDI (RayBiotech, Norcross, GA) was incubated in 0.1 M HEPES buffer, pH 7.25, containing 2 mM EDTA. Aliquots of the protein suspension were incubated with 5 mM GSH equivalents, but the GSH:GSSG ratio in each aliquot was varied from 1:1 to 15:1. The resulting mixture was allowed toequilibrate at 25°C for 1 h, whereupon the reaction was initiated by the addition of insulin (1 mg/ml, final volume). The rate of disulfide bond reduction was monitored spectrophotometrically at 650 nm in kinetic mode for 60 min using a DU800 spectrophotometer (Beckman-Coulter, Fullerton, CA). The rate of the reaction was monitored relative to control preparations where either PDI and/or insulin were omitted from the reaction mixture.
Statistical analysis
Statistical significance between means of two independent groups was determined by Student’s t test, assuming equal variances. For comparison of treatment effects, one-way analysis of variance (ANOVA) with Tukey’s post hoc test was used. All of the results were considered significant if the p value was < 0.05. Statistical analysis was performed using PRISM 4.0b software (GraphPad Software, San Diego, CA).
RESULTS
Analytical method for microsomal glutathione
The well-known method first established by Reed and coworkers was chosen to monitor ER GSH status (10, 19). This HPLC technique allows the simultaneous determination of both GSH and GSSG from a single sample. Adapting this protocol to monitor ER GSH was achieved with minimal changes from the published method (see Materials and Methods). As assessed using γ–GG as an internal standard to monitor the efficiency of analyte derivatization, acid-soluble thiol-containing compounds of the ER were reproducibly derivatized with near complete efficiency (data not shown). Baseline separation of both GSH and GSSG standards were also reproducibly achieved (Fig. 1A and B) and easily detectable in microsomal samples (Fig. 1C). These results show that the method employed in this study is acceptable to quantify free GSH and GSSG in complex microsomal mixtures.
Figure 1.
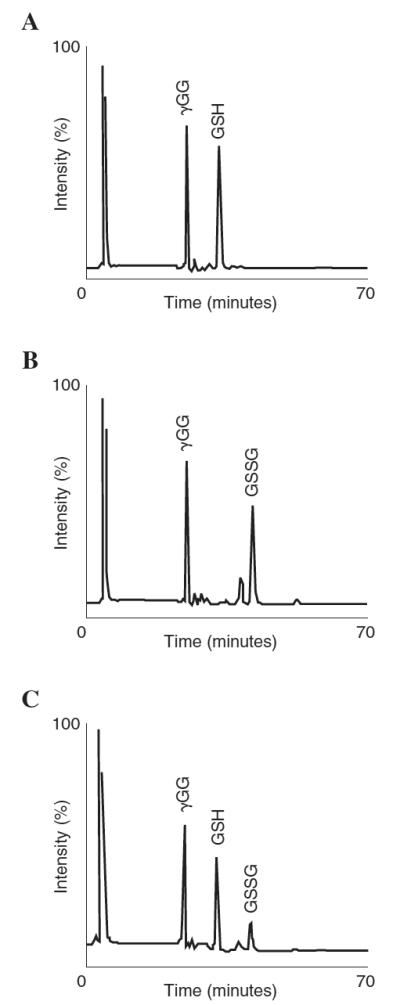
Chromatographic separation of γ-GG, GSH, and GSSG. GSH and GSSG standards were prepared and injected (50 μl) onto a 3-aminopropyl column for HPLC separation and fluorescence detected at 315 nm excitation/585 nm emission. Depicted are representative chromatograms for (A) GSH and (B) GSSG. γ-GG was used as an internal standard to monitor derivatization efficiency. (C) Baseline separation of microsomal GSH and GSSG by HPLC with fluorescence detection. Microsomes (6 mg protein) were acidified with PCA and acid-soluble thiols derivatized as described. Results show that baseline separation of the analytes is easily achieved using this method.
Ex vivo oxidation occurs during isolation of microsomes
Quantification of the total microsomal glutathione pool (GSH + 2GSSG) shows that the ER contains significant quantities of this tripeptide. Overall microsomal GSH equivalents were calculated to be 0.32 nmoles/mg protein with a notably small (20%) coefficient of variation (data not shown). In contrast to the highly stable nature of the overall GSH pool, both GSH and GSSG levels varied markedly, with a calculated coefficient of variance of 69% and 34%, respectively (data not shown). Variability in the GSH:GSSG ratios ranged over 114% (0.12:1 to 3.0:1; n≥11). The extensive range in values was in accordance with Hwang et al. (17) who also observed significant variability in the ER thiol redox state. Because of this marked variability, the rapid nature of thiol–disulfide exchange, and the long isolation procedure, ex vivo oxidation was suspected as a confounding factor in quantifying the GSH:GSSG ratio in microsomal preparations.
Use of iodoacetic acid to preserve ER glutathione and its redox ratio
Iodoacetic acid (IAA) is used routinely as a thiol acetylating agent, which would chemically preserve GSH redox status by protecting free thiolates from oxidation or thiol–disulfide exchange (15, 18). Homogenization of rat livers in the presence of 70 mM IAA did not adversely interfere with the chemical derivatization method for quantifying glutathione, which was shown by the complete separation of γ-GG, GSH, and GSSG from IAA-treated microsomes (data not shown). Moreover, incorporating IAA into the microsomal isolation method resulted in markedly higher reduced GSH levels (0.07 nmoles/mg protein without IAA versus 0.26 nmoles/mg protein with IAA), and significantly lower GSSG concentrations (0.12 nmoles/mg protein without IAA versus 0.06 nmoles/mg protein with IAA) than observed in non-IAA-treated samples (Figs. 2A and B). This IAA trapping method resulted in a microsomal GSH:GSSG ratio over 5-fold higher (4.7:1) than untreated controls (0.7:1) (Fig. 2C). These results reveal that the GSH redox couple in IAA-treated microsomes is in a more reduced state than previously observed.
Figure 2.
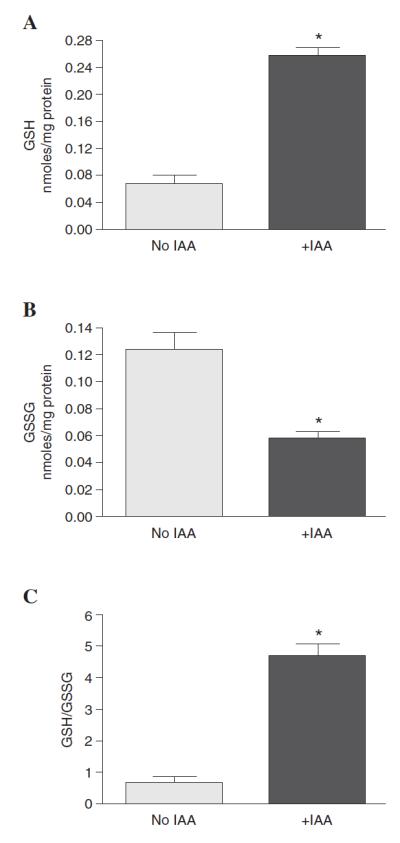
GSH oxidation during microsomal isolation. Microsomes (6 mg protein) were isolated in the presence or absence of IAA and GSH and GSSG monitored by HPLC and quantified relative to standards. The presence of IAA resulted in significantly (A) higher GSH and (B) lower GSSG than observed when IAA was omitted. (C) Calculation of the GSH:GSSG ratio revealed that IAA results in an ~ 5-fold higher GSH redox ratio in microsomes containing IAA versus non-IAA-treated control samples. Results are expressed as mean ± SEM; n = 11 animals per group. Asterisks indicate p < 0.01 versus non-IAA-treated samples.
Ex vivo oxidation occurs rapidly during the microsomal isolation procedure
To determine the rapidity of ex vivo oxidation, IAA was either directly perfused into the liver at the time of sacrifice or added to liver homogenates at different stages of microsomal isolation and the GSH:GSSG ratio determined. Figure 3A shows a schematic of the isolation procedure and the times when IAA was added to microsomes. Overall, microsomal isolation required 6 h to complete and IAA could be conveniently added by perfusion, directly into the homogenization buffer, and at 2 h intervals thereafter. Immediate perfusion of rat livers with IAA followed by microsomal isolation resulted in a GSH:GSSG ratio of 5.6:1 (Fig. 3B). Furthermore, homogenization in the presence of IAA resulted in a GSH:GSSG ratio of 4.8:1 (Fig. 3B), which was not significant (p > 0.05) from the observed ratio found in the perfusion experiments. Thus, microsomal GSH and its redox state appear to be much higher than previously reported in the literature.
Figure 3.

Ex vivo GSH oxidation occurs very rapidly during microsomal isolation. Rat liver homogenates or microsomal preparations were treated with IAA at different times during the isolation of microsomes and GSH redox state monitored by HPLC. (A) Schematic representation of the microsomal isolation procedure and the times at which IAA (70 mM, final concentration) was added [at perfusion (Per), homogenization, or at 2 h intervals]. Bars under the timeline indicate the length of time that a particular sample was incubated with IAA. (B) The GSH redox ratio falls rapidly when liver homogenates are not immediately treated with IAA. Results show that the GSH:GSSG ratio was highest when liver tissue was either directly perfused or immediately homogenized in IAA-containing buffer (see Per and 6 h timepoints). However, significantly lower (p < 0.05) ratios were observed in all samples that were not initially treated with IAA (see 4–0 h timepoints). (C) Results show loss of GSH within the first 2 h of the microsomal isolation procedure when IAA is not present which becomes significant at the 2 and 0 h timepoints (p < 0.05). (D) The initial loss of GSH corresponds to a significant increase in the levels of GSSG (p < 0.05). (E) Nonprotein-bound total glutathione (GSH + 2GSSG) levels become lower in the last timepoint (0 h) versus longer IAA treatment (6 h timepoint) (p < 0.05). Results are expressed as mean ± SEM; n = 3 animals for perfusion group and n = 6 animals for all other groups. Different letters indicate statistical significance (p < 0.05).
Adding IAA at times increasingly closer to final microsome purification revealed that extensive ex vivo oxidation occurred rapidly, mostly within the first 2 h of the isolation procedure (Fig. 3B; p < 0.05). Thereafter, only minimal oxidation was observed which indicates that steps need to be taken early in microsome isolation to minimize ex vivo oxidation and to accurately assess glutathione status.
To determine if a loss of GSH and/or an increase in GSSG was responsible for the low GSH:GSSG ratio when no IAA is present (compare Fig. 2C and 3B), free GSH and GSSG were quantified. To achieve this, IAA was again introduced into tissue by immediate perfusion or at various times throughout the isolation procedure as described in the Materials and Methods. We observed an initial nonsignificant (p > 0.05) loss of GSH within the first 2 h which became significant by 4 h post-isolation (Fig. 3C). This loss was accompanied by a concomitant increase in GSSG (Fig. 3D) which did not decline further following the 2 h timepoint (Fig. 3C), and plateaued after 4 h (Fig. 3D). The final result reflected the GSH:GSSG ratio as observed in Figure 2B when no IAA was added.
To further gauge the impact of GSH oxidation during microsomal isolation, total GSH equivalents (GSH+2GSSG) was calculated. Results showed that overall GSH levels were lowest in microsomes treated with IAA for the shortest time (2 h and 0 h timepoints), becoming significant (p < 0.05) at the 0 h timepoint (Fig. 3E). Taken together, samples either directly perfused or homogenized in 70 mM IAA display significantly higher levels of GSH, lower levels of GSSG, and increased total GSH equivalents relative to nontreated preparations.
Minimal glutathionylation of ER proteins
Previous reports indicate that the majority of GSH in rat liver microsomes is present as mixed disulfides with proteins (2). However, the general loss of GSH and increase in GSSG evident in Fig. 3C and D suggest that ER protein glutathionylation may be a by-product of ex vivo oxidation. First, to understand the extent of GSH-protein mixed disulfides in our system, freshly isolated microsomes treated with or without IAA were incubated with dithiothreitol (DTT; 0.1 mM) and the extent of GSH liberation was quantified. Approximately 5% of total ER GSH was bound to proteins in IAA-treated microsomes (data not shown). Second, to determine whether this relatively low percentage of glutathionylation was because of inadequate reducing power of DTT, a stronger thiol reductant, tris(2-carboxyethyl)phosphine hydrochloride (TCEP), was used to release protein-bound GSH (3). Again < 5% of the total GSH found in the ER was bound to proteins (data not shown). Lastly, to further verify low levels of glutathionylation, resolubilized PCA-precipitated proteins were incubated with DTT (1 mM) to liberate any protein-bound GSH. Using this method, only 3.3% of the total ER glutathione is present as mixed disulfides with proteins in IAA-treated samples (Fig. 4A). Interestingly, non-IAA-treated microsomes displayed similar amounts of protein glutathionylation (5.7%) as IAA-containing controls (Fig. 4A). This was contrary to expectations from the increase in GSSG noted when microsomes were isolated without IAA (see Fig. 3).
Figure 4.
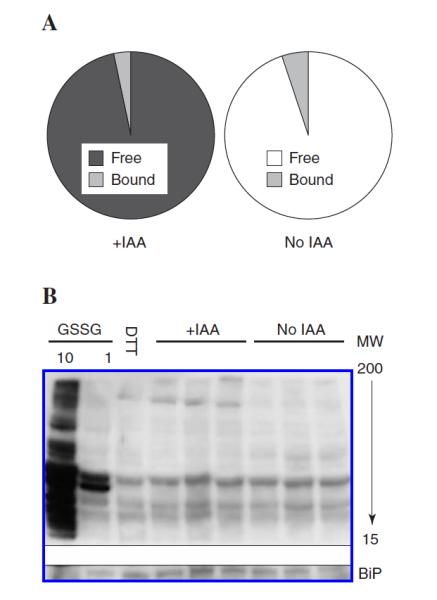
Minimal glutathione is present as mixed disulfides with proteins in rat liver microsomes. Acid precipitated protein pellets were re-solubilized and incubated with DTT (1 mM) to liberate any glutathione bound to proteins. (A) Results show the distribution of free versus protein-bound GSH. Only minimal glutathione was observed bound to protein regardless of the presence or absence of IAA. (B) Western blot analysis of microsomal glutathionylated proteins. When compared to the DTT control, very little glutathione is bound to proteins regardless of IAA treatment. Furthermore, incubation of microsomes with 1 mM GSSG resulted in minimal glutathionylation and only addition of supraphysiological GSSG concentrations (10 mM GSSG) resulted in extensive glutathione-protein mixed disulfides. (n = 3 animals per group).
To further corroborate that only a small percentage of GSH is present as mixed disulfides, the soluble ER proteome was quantified immunochemically. Figure 4B shows a representative blot confirming that there is very little glutathione bound to proteins when compared to DTT-treated samples as a negative control (Fig. 4B, DTT lane). Furthermore, this blot also indicates that microsomal proteins may be relatively resistant to glutathionylation. When microsomes were incubated with a physiological concentration of GSSG (1 mM) as a positive control, only two bands near 40 kDa become glutathionylated. It is not until microsomes were incubated with a supraphysiological concentration of GSSG (10 mM) that glutathionylation became overt. Together, these results indicate that there is only a small amount of glutathione found present as mixed disulfides with proteins in microsomes isolated from rat livers. Furthermore, it appears that the proteins of the ER are not easily glutathionylated, indicating this may be a highly regulated process.
Modulating GSH:GSSG ratios significantly alters protein disulfide isomerase (PDI) activity
To determine the biological relevancy of a higher thiol redox state residing in the ER, we performed experiments to directly monitor the consequences of a higher GSH:GSSG ratio to protein disulfide reduction, a basic function of ER-dependent protein processing. Specifically, an assay was used to determine the effect of varying the GSH:GSSG ratio on PDI-dependent reduction of intramolecular disulfide bonds in insulin. Results showed that PDI activity increased rapidly as the GSH:GSSG ratio also increased (Fig. 5A and B). The maximal rate of reduction occurred at a GSH:GSSG ratio = 9:1 (Fig. 5B). Interestingly, the rate of disulfide reduction was only 23% lower than the maximum rate when PDI was incubated with a GSH:GSSG redox state of 5:1, the approximate ratio observed in our studies. In contrast, PDI-dependent reduction was significantly impaired when PDI was given a GSH:GSSG redox environment at levels previously observed for microsomes (2, 17). As shown in Fig. 5B, when the GSH:GSSG ratios were clamped at either 3:1 or 1:1, the rate of disulfide bond reduction was 67% and 76% lower than the maximal activity, respectively. Thus, the seemingly small change in the GSH:GSSG ratio described herein versus previous literature reports (2, 17) may have profound effects on disulfide reductase activity and ER function.
Figure 5.
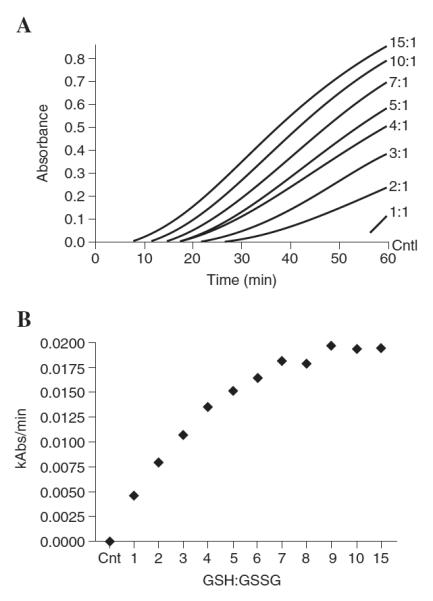
Small changes in GSH redox state markedly affect disulfide bond reduction by PDI. PDI reductase activity was monitored using the insulin turbidity assay of Holmgren (16). PDI (0.25 μM), insulin (1 mg/ml), and glutathione (5 mM) concentrations were kept constant while altering the GSH:GSSG ratio (1:1 to 15:1) and changes in turbidity was monitored spectrophotometrically at 650 nm. (A) Kinetic traces of PDI reduction of insulin intramolecular disulfide bonds. (B) Rates of PDI reductase activity were calculated and plotted against varying GSH:GSSG ratios.
Discussion
The present work establishes that rat liver microsomes contain very high amounts of GSH equivalents. Based on our data showing total ER glutathione (GSH+2GSSG) to be between 0.34 and 0.38 nmol/mg protein and literature reports indicating that microsomal ER volume is ~ 4.5 μl/mg protein (8, 37), we estimate that microsomal GSH levels are ~ 4.5 mM. Considering parenchymal hepatocellular GSH concentrations have been variously reported to be between 1 and 11 mM (34), our results suggest that ER GSH levels largely reflect that found in the cell as a whole. Thus, GSH may be considered the most abundant low molecular weight thiol present in the ER. Even though this has been suggested previously, to our knowledge, this is the first report that actually quantifies microsomal GSH.
Despite both the cytosolic and microsomal GSH pools being similar in concentration, it is thought that the ER GSH redox status may be far more oxidized than the cellular thiol redox environment. This was most recently shown by Bass et al. (2) who reported a GSH:GSSG ratio to be 3:1. Their results also support those of Hwang et al. (17) who indicated that the microsomal thiol redox ratio ranged between 1:1 to 3:1. Although we observed a significantly higher GSH:GSSG ratio, our data confirm that the ER is indeed a much more oxidizing environment than the cytosol and thus may be a uniquely regulated GSH pool. Thus, GSH may also have specific role(s) unique for the ER though these putative functions are still ill-defined.
The poorly defined role(s) of ER GSH is in part a reflection of the limited information on its overall levels and redox state. By incorporating IAA into the microsomal isolation procedure, we show that the GSH:GSSG ratio is significantly higher than that observed for non-IAA-treated samples. IAA-protected microsomes displayed 60% higher GSH, and concomitantly lower GSSG (see Fig. 3). Overall GSH levels (GSH+2GSSG) were also 30% higher over non-IAA-treated samples (see Fig. 3). It is possible that GSH may have been converted to higher oxidation states that could not be detected by the HPLC technique employed or lost during isolation. However, this discrepancy remains unelucidated and subject to future analysis. Our data suggests that the unaccounted for GSH equivalents are not the result of artifactual protein glutathionylation as there were no differences evident in protein-GSH mixed disulfides with or without IAA. One possibility is that GSSG may be exported from the ER when levels increase beyond a specific threshold. This is generally supported by our data showing that free GSSG levels plateau despite the continued loss of GSH during our timecourse experiments (see Fig. 3). However, much work remains in order to elucidate the mechanisms governing steady-state ER glutathione. Regardless, the use of IAA provides a strikingly different profile of both the GSH:GSSG redox ratio and the overall concentrations of glutathione in the ER.
The differences in microsomal GSH redox state reported here versus literature values are not trivial. This may best be illustrated by estimating the differences in GSH reducing capacity in microsomes with and without IAA treatment. Using the Nernst equation ΔE = ΔE 2 pH7.5 − ((RT/F) ) • log ([GSH]2/[GSSG]) and a calculated Eo at pH 7.5 for the GSH:GSSG redox couple of −255 mV, our data would estimate the microsomal GSH reducing capacity at −205 and −176 mV in microsomes with or without IAA treatment, respectively. This 30 mV difference suggests a significantly higher reducing capacity in the ER than previously believed, which would be expected to have a significant impact on the protein dithiol/disulfide ratio. Considering a midpoint potential of −200 mV, a more accurate microsomal protein dithiol/disulfide ratio would thus be near 1:1 versus 1:10 if the 2GSH:GSSG couple were 30 mV more oxidized. For example, protein disulfide isomerases have two active sites with similar CXXC motifs and, depending on whether the active site sulfhydryls are in a disulfide or dithiol form, converts the enzyme from an oxidase involved in disulfide formation to a reductase involved in reducing disulfides (4, 29, 30). Thus, it is important to note that the estimated GSH reducing capacity places the GSH:GSSG redox couple in closer equilibrium with the midpoint potential of PDI than previously believed.
These theoretical calculations are supported by our in vitro studies showing that a GSH:GSSG of 5:1 yields a significantly increased reductase activity for PDI versus its activity when the GSH:GSSG redox ratio is clamped at 3:1 or lower. Furthermore, it has also previously been reported that PDI-dependent refolding/isomerization is optimal at a GSH:GSSG ratio of 5:1 (23, 24, 36). Thus, there is little controversy regarding the consequences of glutathione levels and thiol redox status on enzymes of the ER. It is our contention that the greater unknown is the precise physiological thiol redox status of the ER by which to put these in vitro studies into context.
Our HPLC studies indicate that protein/glutathione mixed-disulfides to be only ~ 5% of the total glutathione found in the ER, regardless of the presence or absence of IAA. This was further confirmed using Western blot analysis. Because only specific proteins appeared to be glutathionylated and that high levels of GSSG are needed to increase glutathionylation, one interpretation of these results is that steady-state protein glutathionylation in the ER is a highly regulated process. This concept is not only consistent with our results but also fits with other work showing that mixed disulfides between GSH and ER client proteins is the rate-limiting step in enzyme catalyzed folding (23). Therefore, glutathionylation may be normally kept to a minimum to limit protein transit time through the secretory pathway; conversely, conditions that induce protein/GSH mixed disulfides may increase protein transit time. Thus, protein glutathionylation may be a yet heretofore underappreciated aspect of regulating both protein maturation and degradation in the ER. However, more work will be necessary to understand the potential role of glutathionylation in the ER.
Future perspective.
The goal of this study was to develop proper methodologies for assessing the GSH and the GSH redox balance in the ER. Based on our results, there is the distinct possibility that the general function and precise redox nature of microsomal GSH may have to be re-evaluated in light of its more reduced state. For instance, outside of protein processing, the GSH:GSSG ratio may be a potent “redox switch” that senses, and ultimately initiates, an ER stress response through affecting redox sensitive proteins (1). Furthermore, perturbations in the ER thiol redox balance have been noted during diabetes and in protein aggregation diseases (1, 26, 30, 31, 35, 43). Interestingly, these pathologies have noted a reductive shift in the ER thiol redox balance (31). Thus, not controlling for ex vivo oxidation during microsomal isolation may fail to detect a critical nuance in the ER GSH:GSSG ratio under normal and pathophysiological conditions. Whether alterations in the thiol redox status are a cause or consequence for these pathologies remains unknown and should be the focus of future studies.
ACKNOWLEDGMENTS
We gratefully acknowledge the expert technical assistance of Mr. Alan Taylor of the Oxidative and Nitrative Stress Laboratory, Linus Pauling Institute. This research was supported by grants generously awarded from National Institutes of Health RO1 2AG17141, PO1 AT002034-01 (to TMH), the Environmental Health Sciences Center, Oregon State University ES00210, and a Pilot Project Grant from the Center for Healthy Aging Research, Oregon State University.
Abbreviations
- ANOVA
analysis of variance
- dansyl chloride
1-dimethylaminonaphthalene-5-sulphoylchloride
- DTT
dithiolthreitol
- EDTA
ethylenediaminetetraacetic acid
- ER
endoplasmic reticulum
- γ-GG
gamma L-glutamyl-glutamate
- GSH
reduced glutathione
- GSSG
glutathione disulfide
- HEPES
4-(2-hydroxyethyl)-1-piperazineethanesulfonic acid
- HPLC
high performance liquid chromatography
- IAA
iodoacetic acid
- LC/MS/MS
liquid chromatography mass spectrophotometric, mass spectrophotometric analysis
- PBS
phosphate buffered saline
- Per
perfusion
- PDI
protein disulfide isomerase
- PVDF
polyvinylidene difluoride
- TCEP
tris(2-carboxyethyl)phosphine hydrochloride
- UV
ultraviolet
REFERENCES
- 1.Banhegyi G, Benedetti A, Csala M, Mandl J. Stress on redox. FEBS Lett. 2007;581:3634–3640. doi: 10.1016/j.febslet.2007.04.028. [DOI] [PubMed] [Google Scholar]
- 2.Bass R, Ruddock LW, Klappa P, Freedman RB. A major fraction of endoplasmic reticulum-located glutathione is present as mixed disulfides with protein. J Biol Chem. 2004;279:5257–5262. doi: 10.1074/jbc.M304951200. [DOI] [PubMed] [Google Scholar]
- 3.Burns JA, Butler JC, Moran J, Whitesides GM. Selective reduction of disulfides by tris(2-carboxythyl)phosphine. J Org Chem. 1991;56:2648–2650. [Google Scholar]
- 4.Carelli S, Ceriotti A, Cabibbo A, Fassina G, Ruvo M, Sitia R. Cysteine and glutathione secretion in response to protein disulfide bond formation in the ER. Science. 1997;277:1681–1684. doi: 10.1126/science.277.5332.1681. [DOI] [PubMed] [Google Scholar]
- 5.Chakravarthi S, Bulleid NJ. Glutathione is required to regulate the formation of native disulfide bonds within proteins entering the secretory pathway. J Biol Chem. 2004;279:39872–39879. doi: 10.1074/jbc.M406912200. [DOI] [PubMed] [Google Scholar]
- 6.Chakravarthi S, Jessop CE, Bulleid NJ. The role of glutathione in disulphide bond formation and endoplasmic-reticulum-generated oxidative stress. EMBO Rep. 2006;7:271–275. doi: 10.1038/sj.embor.7400645. [DOI] [PMC free article] [PubMed] [Google Scholar]
- 7.Csala M, Fulceri R, Mandl J, Benedetti A, Banhegyi G. Glutathione transport in the endo/sarcoplasmic reticulum. Biofactors. 2003;17:27–35. doi: 10.1002/biof.5520170104. [DOI] [PubMed] [Google Scholar]
- 8.Duggan PF, Martonosi A. Sarcoplasmic reticulum: The permeability of sarcoplasmic reticulum membranes. J Gen Physiol. 1970;56:147–167. doi: 10.1085/jgp.56.2.147. [DOI] [PMC free article] [PubMed] [Google Scholar]
- 9.Ellgaard L. Catalysis of disulphide bond formation in the endoplasmic reticulum. Biochem Soc Trans. 2004;32:663–667. doi: 10.1042/BST0320663. [DOI] [PubMed] [Google Scholar]
- 10.Fariss MW, Reed DJ. High-performance liquid chromatography of thiols and disulfides: dinitrophenol derivatives. Methods Enzymol. 1987;143:101–109. doi: 10.1016/0076-6879(87)43018-8. [DOI] [PubMed] [Google Scholar]
- 11.Gorlach A, Klappa P, Kietzmann T. The endoplasmic reticulum:folding, calcium homeostasis, signaling, and redox control. Antioxid Redox Signal. 2006;8:1391–1418. doi: 10.1089/ars.2006.8.1391. [DOI] [PubMed] [Google Scholar]
- 12.Hagen TM, Ingersoll RT, Lykkesfeldt J, Liu J, Wehr CM, Vinarsky V, Bartholomew JC, Ames AB. (R)-alpha-lipoic acid-supplemented old rats have improved mitochondrial function, decreased oxidative damage, and increased metabolic rate. FASEB J. 1999;13:411–418. doi: 10.1096/fasebj.13.2.411. [DOI] [PubMed] [Google Scholar]
- 13.Hagen TM, Ingersoll RT, Wehr CM, Lykkesfeldt J, Vinarsky V, Bartholomew JC, Song MH, Ames BN. Acetyl-L-carnitine fed to old rats partially restores mitochondrial function and ambulatory activity. Proc Natl Acad Sci USA. 1998;95:9562–9566. doi: 10.1073/pnas.95.16.9562. [DOI] [PMC free article] [PubMed] [Google Scholar]
- 14.Hagen TM, Vinarsky V, Wehr CM, Ames BN. (R)-alpha-lipoic acid reverses the age-associated increase in susceptibility of hepatocytes to tert-butylhydroperoxide both in vitro and in vivo. Antioxid Redox Signal. 2000;2:473–483. doi: 10.1089/15230860050192251. [DOI] [PubMed] [Google Scholar]
- 15.Hirs CH. Reduction and S- carboxymethylation of proteins. In: Hirs CH, editor. Methods in Enzymology. Academic Press; New York: 1967. pp. 199–203. [Google Scholar]
- 16.Holmgren A. Thioredoxin catalyzes the reduction of insulin disulfides by dithiothreitol and dihydrolipoamide. J Biol Chem. 1979;254:9627–9632. [PubMed] [Google Scholar]
- 17.Hwang C, Sinskey AJ, Lodish HF. Oxidized redox state of glutathione in the endoplasmic reticulum. Science. 1992;257:1496–1502. doi: 10.1126/science.1523409. [DOI] [PubMed] [Google Scholar]
- 18.Jocelyn PC. Biochemistry of SH Group. Academic Press; New York: 1972. p. 94. [Google Scholar]
- 19.Jones DP, Carlson JL, Samiec PS, Sternberg P, Jr., Mody VC, Jr., Reed RL, Brown LA. Glutathione measurement in human plasma. Evaluation of sample collection, storage and derivatization conditions for analysis of dansyl derivatives by HPLC. Clin Chim Acta. 1998;275:175–184. doi: 10.1016/s0009-8981(98)00089-8. [DOI] [PubMed] [Google Scholar]
- 20.Koivu J, Myllyla R. Interchain disulfide bond formation in types I and II procollagen. Evidence for a protein disulfide isomerase catalyzing bond formation. J Biol Chem. 1987;262:6159–6164. [PubMed] [Google Scholar]
- 21.Krueger SK, Yueh MF, Martin SR, Pereira CB, Williams DE. Characterization of expressed full-length and truncated FMO2 from rhesus monkey. Drug Metab Dispos. 2001;29:693–700. [PubMed] [Google Scholar]
- 22.Liu G, Pessah IN. Molecular interaction between ryanodine receptor and glycoprotein triadin involves redox cycling of functionally important hyperreactive sulfhydryls. J Biol Chem. 1994;269:33028–33034. [PubMed] [Google Scholar]
- 23.Lundstrom–Ljung J, Holmgren A. Glutaredoxin accelerates glutathione-dependent folding of reduced ribonuclease A together with protein disulfide-isomerase. J Biol Chem. 1995;270:7822–7828. doi: 10.1074/jbc.270.14.7822. [DOI] [PubMed] [Google Scholar]
- 24.Lyles MM, Gilbert HF. Catalysis of the oxidative folding of ribonuclease A by protein disulfide isomerase: dependence of the rate on the composition of the redox buffer. Biochemistry. 1991;30:613–619. doi: 10.1021/bi00217a004. [DOI] [PubMed] [Google Scholar]
- 25.Lyles MM, Gilbert HF. Catalysis of the oxidative folding of ribonuclease A by protein disulfide isomerase: pre-steady-state kinetics and the utilization of the oxidizing equivalents of the isomerase. Biochemistry. 1991;30:619–625. doi: 10.1021/bi00217a005. [DOI] [PubMed] [Google Scholar]
- 26.Marciniak SJ, Ron D. Endoplasmic reticulum stress signaling in disease. Physiol Rev. 2006;86:1133–1149. doi: 10.1152/physrev.00015.2006. [DOI] [PubMed] [Google Scholar]
- 27.Mezghrani A, Fassio A, Benham A, Simmen T, Braakman I, Sitia R. Manipulation of oxidative protein folding and PDI redox state in mammalian cells. EMBO J. 2001;20:6288–6296. doi: 10.1093/emboj/20.22.6288. [DOI] [PMC free article] [PubMed] [Google Scholar]
- 28.Molteni SN, Fassio A, Ciriolo MR, Filomeni G, Pasqualetto E, Fagioli C, Sitia R. Glutathione limits Ero1-dependent oxidation in the endoplasmic reticulum. J Biol Chem. 2004;279:32667–32673. doi: 10.1074/jbc.M404992200. [DOI] [PubMed] [Google Scholar]
- 29.Narayan M, Welker E, Wedemeyer WJ, Scheraga HA. Oxidative folding of proteins. Acc Chem Res. 2000;33:805–812. doi: 10.1021/ar000063m. [DOI] [PubMed] [Google Scholar]
- 30.Nardai G, Korcsmaros T, Papp E, Csermely P. Reduction of the endoplasmic reticulum accompanies the oxidative damage of diabetes mellitus. Biofactors. 2003;17:259–267. doi: 10.1002/biof.5520170125. [DOI] [PubMed] [Google Scholar]
- 31.Nardai G, Stadler K, Papp E, Korcsmaros T, Jakus J, Csermely P. Diabetic changes in the redox status of the microsomal protein folding machinery. Biochem Biophys Res Commun. 2005;334:787–795. doi: 10.1016/j.bbrc.2005.06.172. [DOI] [PubMed] [Google Scholar]
- 32.Petersen JG, Dorrington KJ. An in vitro system for studying the kinetics of interchain disulfide bond formation in immunoglobulin G. J Biol Chem. 1974;249:5633–5641. [PubMed] [Google Scholar]
- 33.Saxena VP, Wetlaufer DB. Formation of three-dimensional structure in proteins. I. Rapid nonenzymic reactivation of reduced lysozyme. Biochemistry. 1970;9:5015–5023. doi: 10.1021/bi00827a028. [DOI] [PubMed] [Google Scholar]
- 34.Schafer FQ, Buettner GR. Redox environment of the cell as viewed through the redox state of the glutathione disulfide/glutathione couple. Free Radic Biol Med. 2001;30:1191–1212. doi: 10.1016/s0891-5849(01)00480-4. [DOI] [PubMed] [Google Scholar]
- 35.Schroder M, Kaufman RJ. ER stress and the unfolded protein response. Mutat Res. 2005;569:29–63. doi: 10.1016/j.mrfmmm.2004.06.056. [DOI] [PubMed] [Google Scholar]
- 36.Schwaller M, Wilkinson B, Gilbert HF. Reduction-reoxidation cycles contribute to catalysis of disulfide isomerization by protein/disulfide isomerase. J Biol Chem. 2003;278:7154–7159. doi: 10.1074/jbc.M211036200. [DOI] [PubMed] [Google Scholar]
- 37.Share L, Hansrote RW. Permeability of rat liver microsomes to sucrose and carboxypolyglucose in vitro. J Biophys Biochem Cytol. 1960;7:239–242. doi: 10.1083/jcb.7.2.239. [DOI] [PMC free article] [PubMed] [Google Scholar]
- 38.Smith AR, Visioli F, Hagen TM. Vitamin C matters: increased oxidative stress in cultured human aortic endothelial cells without supplemental ascorbic acid. FASEB J. 2002;16:1102–1104. doi: 10.1096/fj.01-0825fje. [DOI] [PubMed] [Google Scholar]
- 39.Suh JH, Heath SH, Hagen TM. Two subpopulations of mitochondria in the aging rat heart display heterogenous levels of oxidative stress. Free Radic Biol Med. 2003;35:1064–1072. doi: 10.1016/s0891-5849(03)00468-4. [DOI] [PMC free article] [PubMed] [Google Scholar]
- 40.Sun J, Xu L, Eu JP, Stamler JS, Meissner G. Classes of thiols that influence the activity of the skeletal muscle calcium release channel. J Biol Chem. 2001;276:15625–15630. doi: 10.1074/jbc.M100083200. [DOI] [PubMed] [Google Scholar]
- 41.Wetlaufer DB, Branca PA, Chen GX. The oxidative folding of proteins by disulfide plus thiol does not correlate with redox potential. Protein Eng. 1987;1:141–146. doi: 10.1093/protein/1.2.141. [DOI] [PubMed] [Google Scholar]
- 42.Xia R, Stangler T, Abramson JJ. Skeletal muscle ryanodine receptor is a redox sensor with a well defined redox potential that is sensitive to channel modulators. J Biol Chem. 2000;275:36556–36561. doi: 10.1074/jbc.M007613200. [DOI] [PubMed] [Google Scholar]
- 43.Yoshida H. ER stress and diseases. FEBS J. 2007;274:630–658. doi: 10.1111/j.1742-4658.2007.05639.x. [DOI] [PubMed] [Google Scholar]
- 44.Zable AC, Favero TG, Abramson JJ. Glutathione modulates ryanodine receptor from skeletal muscle sarcoplasmic reticulum. Evidence for redox regulation of the Ca2+ release mechanism. J Biol Chem. 1997;272:7069–7077. doi: 10.1074/jbc.272.11.7069. [DOI] [PubMed] [Google Scholar]