Abstract
Background
Intracardiac echocardiography (ICE) has played a limited role in defining the substrate for ventricular tachycardia (VT). The purpose of this study was to assess whether ICE could identify abnormal epicardial substrate in patients (pts) with nonischemic cardiomyopathy (NICM) and VT.
Methods and Results
We studied 18 pts with NICM and recurrent VT who had abnormal echogenicity identified on ICE imaging. Detailed LV endocardial (ENDO) and epicardial (EPI) electroanatomic mapping was performed in all pts. Low voltage areas (< 1.0mV) in the epicardium were analyzed. ICE imaging in the NICM group was compared to a control group of 30 pts with structurally normal hearts who underwent ICE imaging for other ablation procedures. In 18 pts (53 ± 13 years, 17 men) with NICM (EF: 37 ± 13%) increased echogenicity was identified in the lateral LV by ICE imaging. LV ENDO electroanatomic mapping identified normal voltage in 9 pts and at least one, confluent low voltage area [6.6 cm2 (minimum 2.1 to maximum 31.7 cm2)] in 9 pts (5 posterolateral LV and 4 perivalvular LV). Detailed EPI mapping revealed areas of low voltage [39 cm2 (minimum 18.5 to maximum 96.3 cm2)] and abnormal, fractionated electrograms (EGMs) in all 18 pts (15 posterolateral LV and 3 lateral LV). In all pts, the EPI scar identified by electroanatomic mapping correlated with the echogenic area identified on ICE imaging. ICE imaging identified no areas of increased echogenicity in the control group.
Conclusions
ICE imaging identified increased echogenicity in the lateral wall of the LV that correlated to abnormal EPI substrate. These findings suggest that ICE imaging may be useful to identify EPI substrate in NICM.
Keywords: Catheter Ablation, Imaging, Echocardiography, Ventricular Tachycardia, Epicardial
Introduction
Intracardiac echocardiography (ICE) is routinely used during catheter ablation for atrial fibrillation to facilitate transseptal catheterization, assess cardiac anatomy, monitor pulmonary vein flows, provide real time imaging of catheter tip position and lesion formation, and monitor for complications. Despite its widespread use in ablation for atrial fibrillation, ICE imaging has not been routinely used during catheter ablation for ventricular tachycardia (VT). (1) Several studies have highlighted the use of ICE in VT ablation to guide catheter placement on specific anatomic targets such as the papillary muscles, to facilitate mapping and ablation of aortic cusp VT, and to monitor lesion development. (1–4) There is limited information on the ability of ICE to assess for abnormal substrate during VT ablation. (5–7)
We present a unique series of patients with nonischemic cardiomyopthy (NICM) and recurrent VT in whom ICE imaging identified abnormal echogenicity in the lateral wall of the left ventricle (LV). We characterized this substrate by detailed endocardial and epicardial mapping, analysis of electrograms (EGMs) in low voltage areas, and correlation with other imaging modalities including magnetic resonance imaging (MRI) and computed tomographic angiography (CTA).
Methods
Study Population
The study population consisted of 18 patients with NICM and recurrent VT who underwent radiofrequency ablation at our institution. These 18 patients had increased echogenicity in the lateral wall of the LV identified by ICE imaging. We compared the ICE imaging in the NICM group to a control group of 30 patients with structurally normal hearts who underwent ablation procedures for atrial fibrillation and premature ventricular contractions (PVC). These patients underwent detailed ICE imaging as part of their procedures. All patients gave written informed consent in accordance with the institutional guidelines of the University of Pennsylvania Health System.
Imaging
Imaging was performed using a Sequoia ® ultrasound system (Acuson Corporation, Mountain View, CA) with a 8 or 10 Fr phased-array ultrasound catheter (Acuson AcuNav Catheter ™). The ultrasound catheter has a changeable ultrasound frequency (5.5 – 10MHz) and a four-way steerable tip (anteroposterior or left-right direction). The imaging catheter was placed in the left femoral vein and advanced across the tricuspid annulus into the right ventricle (RV). 2D slices were obtained with slight clockwise or counterclockwise rotation of the imaging catheter along its long axis.
ICE imaging was analyzed by an echocardiographer who was blinded to the mapping data obtained from the ablation procedure in the study population. The echocardiographer was blinded to the indication for the ablation procedure, patient/clinical characteristics, mapping data, and prior echocardiographic evaluations in the control group.
The ICE survey was analyzed for the presence of increased echogenicity as compared to the adjacent structures. If increased echogenicity was present, the gain functions on the Sequoia ® ultrasound system were systematically decreased to exclude background noise artifacts in the LV cavity to assess this finding. The full thickness of the myocardium was assessed in both real time and still ICE images. The myocardium was divided into three layers and qualitatively assessed for echogenicity. The layer adjacent to the LV cavity was defined as endocardial, the middle layer was defined as mid-myocardial, and the distal layer was defined as epicardial. Epicardial echogenicity appears as a linear structure and we applied this criterion to the definition as well. The following criteria were applied to the finding of increased echogenicity: 1) location by LV segment 2) LV layer (endocardial, mid-myocardial, epicardial) 3) degree of extension (base only, base to mid, base to apex).
Twelve patients underwent MRI or CTA imaging prior to the ablation procedure. The MRI was performed with a 1.5 Tesla magnetic resonance imaging Avanto scanner (Siemens, Erlangen, Germany) with a 4- or 8-element phased array coil placed over the chest of patients in the supine position. ECG-gated cardiac CT acquisition was performed on a dual source Somatom Definition scanner (Siemens, Erlangen, Germany) with intravenous iodinated contrast. MRI and CTA imaging studies were analyzed off-line by an experienced radiologist who was blinded to the ICE and mapping data obtained from the ablation procedure.
Electroanatomic Mapping
A 7-Fr, 3.5mm tip open-irrigated (Navistar Thermocool™, Biosense Webster) catheter was placed in the right femoral artery and advanced to the LV in a retrograde fashion to create a 3D electroanatomic voltage map (CARTO, Biosense-Webster) in sinus rhythm. Intravenous heparin was administered to maintain an activated clotting time > 250 seconds during LV endocardial mapping. Bipolar electrograms were recorded with a band pass filter at 30–500 Hz and displayed at 100mm/s. The reference value for defining normal electrogram voltage in the LV endocardium with electroanatomical mapping was previously established at 1.5mV. (8)
Protamine was routinely given to reverse anticoagulation prior to epicardial mapping. Access to the pericardial space was obtained by the technique described by Sosa et al. (9) Detailed electroanatomic mapping of the epicardium was performed during sinus rhythm with a 3.5mm tip Thermocool™ catheter. The reference value for defining abnormal electrograms in the epicardium was previously established with normal epicardial electrograms defined as > 1.0mV, which corresponds to 95% of the signals from normal epicardium recorded at a distance of at least 1 cm from large-vessel coronary vasculature. (10)
The extent of abnormal LV endocardial and epicardial bipolar voltage signals was estimated by measuring contiguous areas of abnormal electrograms using the area calculation algorithm included in the CARTO system. To further limit the influence of epicardial fat and coronary vasculature on the low voltage region, the contiguous low voltage electrograms had to demonstrate low amplitude signals and discrete late potentials (recorded after the QRS) and/or broad >80 ms multicomponent or split signals. (10) Confluent areas of low voltage were labeled as homogenous scar. Areas of low voltage that were interspersed with “normal voltage” (> 1.0 mV), but displaying abnormal electrograms, were labeled as heterogeneous scar.
Electrophysiology Study and Ablation
Programmed stimulation was performed from RV and LV endocardial sites. The stimulation protocol included the delivery of up to triple extrastimuli from ≥ 2 ventricular sites at ≥ 2 drive cycle lengths. Each VT that was induced was analyzed for 12 lead electrocardiographic characteristics suggestive of an epicardial origin. (11) If the induced VT was stable and hemodynamically tolerated, endocardial and/or epicardial activation mapping and entrainment mapping were utilized. If the induced VT was not hemodynamically stable or reproducibly initiated, detailed characterization of the arrhythmia substrate was performed and all sites demonstrating distinct late potentials were tagged. Pacemapping was utilized in the area of abnormal substrate to approximate the exit site of the VT circuit or to identify locations manifesting delayed conduction (long stimulus to QRS interval during pacemapping) that matched the clinical VT. A substrate-based ablation strategy targeted the abnormal substrate by incorporating the best pacemap sites and areas of abnormal electrograms. (12–14)
We elected to perform endocardial ablation prior to epicardial ablation if pacemapping in the abnormal endocardial substrate was similar to the inducible VTs or if we were able to define outer loop sites on the LV endocardium that suggested proximity to the circuit. If these patients remained inducible after endocardial ablation, then epicardial ablation was performed.
Statistical Analysis
Continuous variables are expressed as mean ± standard deviation or median (minimum to maximum). A Fisher exact test was used to assess the significance of abnormal echogenicity identified by ICE imaging in the NICM group and in the control group.
Results
Patient Characteristics
The study population consisted of 18 patients (53 ± 13yo, 17 men) with NICM and recurrent VT in whom ICE imaging identified abnormal echogenicity. All 18 patients presented with recurrent VT documented by implantable cardioverter defibrillator (ICD) stored data (n=16) or ECG documentation (n=2) that was refractory to medical therapy with antiarrhythmic medications (n=17) and/or beta-blocker therapy (n=1). Eleven patients underwent unsuccessful LV endocardial mapping/ablation prior to the initial endocardial/epicardial ablation procedure. Echocardiography performed prior to the procedure revealed a LV ejection fraction (EF) of 37 ± 13%.
The control group consisted of 30 patients (55 ± 14 yo, 23 men) with structurally normal hearts (LV ejection fraction 62 ± 6%) who underwent ablations for atrial fibrillation and PVCs. These patients underwent detailed ICE imaging as part of their procedures.
Imaging
Increased echogenicity was identified in the lateral wall of the LV by ICE imaging in 18/18 patients with NICM and in 0/30 patients in the control group (p < .0001). The echogenicity was located in the following segments: posterolateral LV (n=11) posterolateral/lateral LV (n=2), and posterolateral/inferior LV (n=5). The abnormal echogenicity was identified in both the mid-myocardium and epicardium in 10/18 patients (Figures 1–4) and only the epicardium in 8/18 pts. (Figure 5) In 15/18 patients, the echogenicity extended from base to mid LV and in 3/18 patients, it extended from the base to near the apex. (Table 1)
Figure 1.
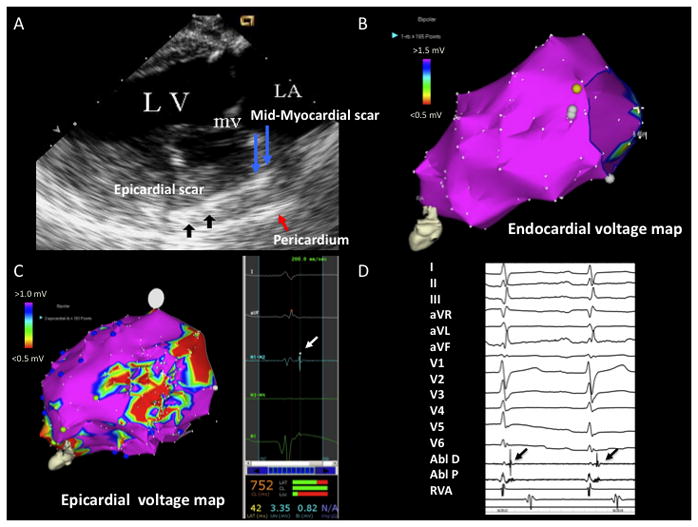
A) ICE image with increased echogenicity in epicardium (black arrows) and mid-myocardium (blue arrows) identified on posterolateral wall. Pericardium is marked by red arrow B) LV endocardial voltage map with normal voltage. C) LV epicardial voltage map with area of low voltage on the posterolateral wall. The white arrow points to a late potential identified in the epicardial scar. D) Epicardial late potentials on ABL D (back arrows). LA = left atrium, LV = left ventricle, mv = mitral valve, Abl D = ablator distal, Abl P = ablator proximal, RVA = right ventricular apex
Figure 4.
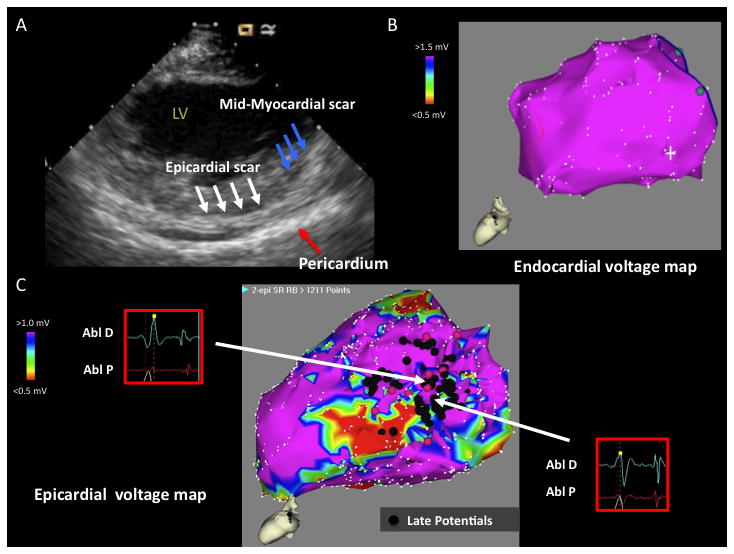
A) ICE image with increased echogenicity in epicardium (white arrows) and mid-myocardium (blue arrows) identified on posterolateral wall. Pericardium is marked by red arrow. B) LV endocardial voltage map with normal voltage. C) LV epicardial voltage map with area of low voltage on posterolateral wall. Late potentials are denoted by black tags. The epicardial scar calculation includes the area of late potentials in “normal voltage (> 1 mV)” and the area of low voltage more distal. Electrograms (EGMs) of representative late potentials are shown. LV = left ventricle, Abl D = Ablator distal; Abl P = Ablator proximal
Figure 5.
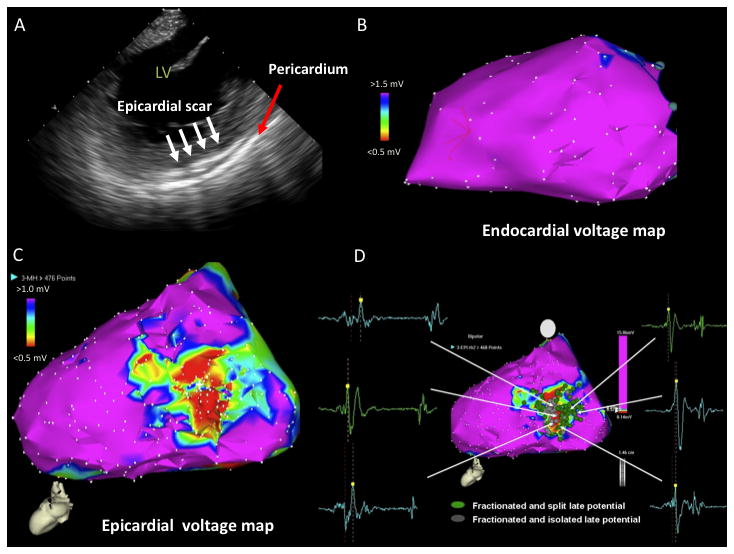
A) ICE image with increased echogenicity in epicardium (white arrows) identified on posterolateral wall. Pericardium is noted by red arrow. B) LV endocardial voltage map with normal voltage. C) LV epicardial voltage map with area of low voltage on the posterolateral wall. D) Late potentials identified on LV epicardium (fractionated, split, and isolated). LV = left ventricle
Table 1.
Intracardiac Echo (Echogenicity), Electroanatomic Mapping, MRI, CTA Data
| Pt | ICE Location | ICE Level | ICE Extension | LV ENDO VA/cm2 | LV EPI VA/cm2 | MRI (DE) | CTA |
|---|---|---|---|---|---|---|---|
| 1 | PL | M-Myo, Epi | Base to Mid | Normal | PL/33.7 | PL Thinning | |
| 2 | PL, Lat | Epi | Base to near apex | Normal | PL/28.9 | Lat, AL | Lat Hypokinesis |
| 3 | PL | Epi | Base to Mid | Normal | PL/22.7 | PL Thinning | |
| 4 | PL | Epi | Base to near apex | PL/19.7 | PL/96.3 | Lat thinning | |
| 5 | PL, Inf | Epi | Base to Mid | PL/17.6 | PL, IL/22.1 | IL thinning | |
| 6 | PL, Lat | M-Myo, Epi | Base to Mid | Perivalvular/6.3 | Lat/14.6 | Ant, AL, Lat, IL | |
| 7 | PL, Inf | Epi | Base to Mid | Normal | PL, IL/49.3 | ||
| 8 | PL | Epi | Base to Mid | PL/2.1 | Lat/43.9 | ||
| 9 | PL | Epi | Base to Mid | Perivalvular/4 | Lat/26.1 | Artifact | |
| 10 | PL | M-Myo, Epi | Base to near apex | Normal | PL/41.4 | Artifact | |
| 11 | PL | M-Myo, Epi | Base to Mid | Normal | PL/18.5 | AL, Lat, IL | IL Hypokinesis |
| 12 | PL | M-Myo, Epi | Base to Mid | Normal | PL/43.5 | Lat, IL | |
| 13 | PL | M-Myo, Epi | Base to Mid | Perivalvular/17 | PL/37 | IL | |
| 14 | PL, Inf | Epi | Base to Mid | PL/31.7 | PL/49.1 | ||
| 15 | PL, Inf | M-Myo, Epi | Base to Mid | PL/6.6 | PL/44.1 | ||
| 16 | PL | M-Myo, Epi | Base to Mid | Perivalvular/2.8 | PL/42.3 | ||
| 17 | PL | M-Myo, Epi | Base to Mid | Normal | PL/63.9 | ||
| 18 | PL,Inf | M-Myo, Epi | Base to Mid | Normal | PL, IL/30 | IL |
Abbreviations - ICE: Intracardiac Echocardiography, VA: Voltage Abnormality, MRI: Magnetic Resonance Imaging, DE: Delayed Enhancement, CTA: Computed Tomographic Angiography, PL: Posterolateral, AL: Anterolateral, Lat: Lateral, Inf: Inferior, IL: Inferolateral, M-Myo: Mid-Myocardium, Epicardium
Eight patients underwent MRI imaging prior to the ablation procedure. In two of the eight patients, there was significant artifact from the internal cardiac defibrillator (ICD) which was placed in the left pectoral area and thus, it was difficult to assess for delayed enhancement on the lateral wall. In the remaining six patients, there were areas of delayed enhancement on the lateral, anterolateral, and inferolateral walls. (Table 1/Figures 2,3) Six patients underwent CTA imaging which revealed thinning in the lateral, posterolateral, and inferolateral walls and hypokinesis in the lateral and inferolateral walls. (Table 1)
Figure 2.
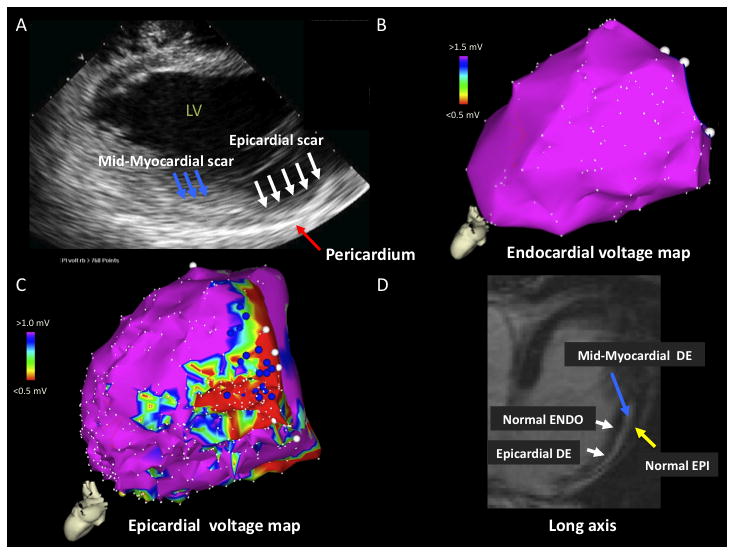
A) ICE image with increased echogenicity in epicardium (white arrows) and mid-myocardium (blue arrows) identified on posterolateral wall. Pericardium is marked by red arrow. B) LV endocardial voltage map with normal voltage. C) LV epicardial voltage map with area of low voltage on the posterolateral wall. D) MRI image (long axis) with extensive areas of delayed enhancement (DE) in epicardium (white arrow) and mid-myocardium (blue arrow). Normal epicardium (yellow arrow) and normal endocardium (white arrow) are noted. LV = left ventricle, ENDO = endocardium, EPI = epicardium
Figure 3.
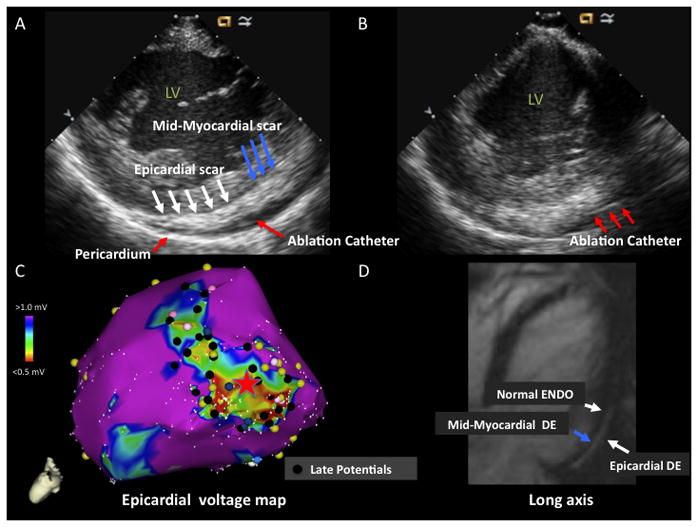
A) ICE image with increased echogenicity in epicardium (white arrows) and mid-myocardium (blue arrows) identified on posterolateral wall. Pericardium is marked by red arrow. Ablation catheter in pericardial space is marked by red arrow. B) ICE image with ablation catheter (red arrows) in pericardial space with catheter tip adjacent to area of mid-myocardial/epicardial echogenicity. C) LV epicardial voltage map with area of low voltage on the posterolateral wall. The red star marks the location of the catheter tip on the epicardial voltage map that is seen on the ICE image in panel B. Late potentials are denoted by black tags. D) MRI image (long axis) with extensive areas of delayed enhancement (DE) in epicardium (white arrow) and mid-myocardium (blue arrow). Normal endocardium (white arrow) is noted. LV = left ventricle, ENDO = endocardium, EPI = epicardium
Electroanatomic Mapping
Detailed LV endocardial [248 points (minimum 95 to maximum 617)] and epicardial [615 points (minimum 342 to maximum 1243)] electroanatomic mapping was performed in all 18 patients. All 18 patients demonstrated normal or small LV endocardial voltage abnormalities and more extensive epicardial substrate. LV endocardial voltage mapping identified completely normal voltage in 9 patients and small areas of low voltage < 1.5 mV [6.6 cm2 (minimum 2.1 to maximum 31.7 cm2)] in the posterolateral LV (n=5) and perivalvular LV (n=4). These smaller areas of low voltage on the LV endocardium were opposite to larger areas of epicardial low voltage.
The areas of low voltage (< 1.0 mV) on the LV epicardium [39 cm2 (minimum 18.5 to maximum 96.3 cm2)] were localized to the following areas: posterolateral LV (n=12), posterolateral and inferolateral LV (n=3), and lateral LV (n=3). The epicardial scar was homogeneous in 14 patients and heterogeneous in 4 patients. These 4 patients had patchy areas of low voltage on the lateral wall of the LV epicardium, interspersed with areas of normal voltage (> 1.0 mV), but displaying abnormal, fractionated electrograms with split and late potentials. (Figure 4) The low voltage areas on the epicardium were located at the basal LV in 7 patients and basal to mid LV in 11 patients.
Correlation Between ICE imaging, electroanatomic mapping, and MRI
In all 18 patients, the abnormal echogenicity identified on ICE imaging correlated to the areas of low voltage documented on the LV epicardium. During epicardial mapping of the low voltage areas, the catheter tip was tagged and located on ICE imaging. (Figure 3) In all cases, the catheter tip location over abnormal epicardial substrate was adjacent to the ICE echogenicity.
As stated above, in 10/18 patients there was increased echogenicity in both the mid-myocardium and epicardium. Five of these patients underwent MRI imaging which revealed areas of delayed enhancement in the lateral wall that extended from the myocardium to the epicardium. In 3 of these patients, we were able to identify low voltage areas on the epicardium, but they were not as extensive as the MRI findings. (Figure 2)
Electrophysiology Study and Ablation
A median of 3.5 (minimum 1 to maximum 6) VTs were induced by programmed stimulation. Seven of 18 patients underwent initial LV endocardial ablation targeting abnormal substrate guided by pacemapping (n=5) or targeting outer loop sites based on entrainment mapping (n=2), prior to proceeding to LV epicardial mapping. A substrate-based ablation strategy on the LV epicardium was performed in 17 of 18 patients given the hemodynamic instability of the targeted VTs. Ablation was performed by targeting the abnormal epicardial substrate and incorporating sites with the best pacemaps and areas of abnormal electrograms. In total, 12 of the 18 patients underwent combined endocardial and epicardial ablation.
Discussion
In our series of NICM patients undergoing VT ablation, we demonstrated that ICE imaging was useful in identifying regions of abnormal epicardial substrate. In all 18 patients, ICE imaging identified abnormal echogenicity in the lateral wall of the LV that correlated anatomically to electroanatomic findings of low voltage and abnormal electrograms manifested by split and late potentials. The majority of patients underwent MRI or CT imaging that confirmed abnormal substrate in the lateral wall by either delayed enhancement or thinning in the lateral wall, correlating to the ICE defined abnormality.
Our findings suggest that ICE imaging has an important role in identifying abnormal substrate and thereby facilitating VT ablation. Increased echogenicity on ICE imaging coupled with normal or small areas of low voltage on LV endocardial electroanatomic mapping suggest the need for detailed epicardial mapping/ablation. Electroanatomic mapping is currently the gold standard for identification of abnormal epicardial substrate and the strength of this study is that it validates ICE imaging in identifying abnormal substrate. MRI imaging in patients with ICDs is not uniformly performed and there remains the issue of ICD generator artifact when interpreting MRIs in these patients. In our study, two patients had ICD generator artifact on the lateral wall, limiting interpretation.
ICE imaging identified both mid-myocardial and epicardial echogenicity in 10/18 patients and these findings were confirmed in 5 of these patients with MRI imaging which revealed extensive areas of delayed enhancement. In 3 of these patients, we were able to identify low voltage areas on the epicardium, but they were not as extensive as the mid-myocardial MRI findings. Thus, one must hypothesize that these patients had larger areas of mid-myocardial scar that were identified by ICE imaging and MRI, with a smaller epicardial component that was confirmed with electroanatomic mapping. (Figure 2) This finding documents the limitation of bipolar mapping to identify mid-myocardial scar and the need to explore other modalities such as unipolar substrate mapping, in conjunction with ICE imaging and MRI, to identify abnormal, myocardial substrate. (15)
In most cases, the epicardial low voltage areas were homogenous with abnormal, fractionated EGMs. In 4 patients, there was heterogeneous areas of low voltage on the lateral wall of the LV epicardium, interspersed with areas of normal voltage (> 1.0 mV), but displaying abnormal, fractionated EGMs with split and late potentials. This patchy epicardial scar may be related to undersampling, a cutoff value of 1 mV for identifying low voltage on the epicardium, or reflect sampling of mid-myocardial substrate as two of these patients had mid-myocardial and epicardial substrate identified by ICE imaging. (Figure 4)
Conclusion
We present a unique series of patients with nonischemic cardiomyopathy (NICM) and recurrent VT who demonstrated predominantly normal left ventricular (LV) endocardial voltage and abnormal epicardial substrate identified by ICE imaging. ICE imaging identified abnormal echogenicity in the lateral wall of the LV that correlated to epicardial low voltage areas identified by electroanatomic mapping. This epicardial scar had abnormal electrograms with split and late potentials. In a subset of patients, MRI imaging confirmed abnormal substrate in the lateral wall, correlating to the ICE defined abnormality.
Limitations
In this study, MRI imaging was performed in 8 of 18 patients. In 2 of these patients, there was significant artifact from the ICD generator in the left pectoral area and it was difficult to assess for delayed enhancement on the lateral wall. Four of the eight patients did not have ICDs at the time of MRI imaging. Thus, it may be difficult to acquire quality MRI images due to artifact which may limit our ability to judge the extent of abnormal substrate in the lateral wall.
This study included 18 patients with increased echogenicity in the lateral wall defined on the initial ICE survey. Other regions in the LV were not studied and thus, our findings are limited to a site-specific region. The sensitivity and specificity of this finding in NICM are unknown. Further studies are required to assess this finding as well as identifying abnormal substrate in other regions of the LV.
The ICE imaging was interpreted by an echocardiographer with extensive experience in ICE acquisition and interpretation. Operators less experienced with ICE interpretation may encounter difficulty in analysis.
Abbreviations
- CTA
Computed tomographic angiography
- EGMs
Electrograms
- ICE
Intracardiac echocardiography
- LV
Left ventricle
- MRI
Magnetic resonance imaging
- NICM
Nonischemic cardiomyopathy
- PS
Programmed stimulation
- RFA
Radiofrequency ablation
- VAs
Ventricular arrhythmias
- VT
Ventricular tachycardia
Footnotes
Conflict of Interest Disclosures: Rupa Bala, MD, Mathew D. Hutchinson, MD, Edward P. Gerstenfeld, MD, Sanjay Dixit, MD, Fermin Garcia, MD, Joshua Cooper, MD, David Lin, MD, Michael P. Riley, MD, David J. Callans, MD, and Francis E. Marchlinski, MD have all participated in clinical research protocols on endocardial VT ablation in patients with coronary artery disease sponsored by Biosense Webster, but unrelated to the manuscript content, and have also received honoraria for educational lectures. Mathew D. Hutchinson, MD and David J. Callans have received honoraria from Acuson Corporation for educational lectures.
References
- 1.Ren JF, Marchlinski FE. Utility of Intracardiac Echocardiography in Left Heart Ablation for Tachyarrhythmias. Echocardiography. 2007;24:533–540. doi: 10.1111/j.1540-8175.2007.00426.x. [DOI] [PubMed] [Google Scholar]
- 2.Jongbloed MRM, Bax JJ, Borger van der Burg AE, Van der Wall EE, Schalij MJ. Radiofrequency catheter ablation of ventricular tachycardia guided by intracardiac echocardiography. Eur J Echocardiography. 2004;5:34–40. doi: 10.1016/s1525-2167(03)00051-9. [DOI] [PubMed] [Google Scholar]
- 3.Seiler J, Lee JC, Roberts-Thomson KC, Stevenson WG. Intracardiac echocardiography guided catheter ablation of incessant ventricular tachycardia from the posterior papillary muscle causing tachycardia-mediated cardiomyopathy. Heart Rhythm. 2009;6:389–392. doi: 10.1016/j.hrthm.2008.11.029. [DOI] [PubMed] [Google Scholar]
- 4.Lamberti F, Calo L, Pandozi C, Castro A, Loricchio ML, Boggi A, Toscano S, Ricci R, Drago F, Santini M. Radiofrequency Catheter Ablation of Idiopathic Left Ventricular Outflow Tract Tachycardia. J Cardiovasc Electrophysiol. 2001;12:529–535. doi: 10.1046/j.1540-8167.2001.00529.x. [DOI] [PubMed] [Google Scholar]
- 5.Bala R, Garcia FC, Ren JF, Marchlinski FE. Multiple Ventricular Tachycardias from Intracardiac Echo Defined Left Ventricular Epicardial Scar: Successful Ablation Targeting Anatomic Substrate. Heart Rhythm. 2006;3:S296. [Google Scholar]
- 6.Bala R, Hutchinson MD, Cooper JM, Garcia FC, Sussman J, Riley MP, Gerstenfeld EP, Dixit S, Lin D, Callans DJ, Russo AM, Verdino RJ, Ren J-F, Marchlinski FE. The Use of Intracardiac Echo to define Ventricular Tachycardia Substrate in Nonischemic CM. Heart Rhythm. 2008;5:S69. [Google Scholar]
- 7.Bala R, Cano O, Hutchinson MD, Garcia FC, Riley MP, Gerstenfeld EP, Cooper JM, Lin D, Dixit S, Callans DJ, Marchlinski FE. Unique Epicardial Substrate in Nonischemic Cardiomyopathy: Echo Signature, Electrogram Correlates and Outcome with Substrate Based Ablation. Circulation. 2008;118:S826. [Google Scholar]
- 8.Marchlinski F, Callans D, Gottlieb C, Zado E. Linear Ablation lesions for control of unmappable ventricular tachycardia in patients with ischemic and nonischemic cardiomyopathy. Circulation. 2000;101:1288–1296. doi: 10.1161/01.cir.101.11.1288. [DOI] [PubMed] [Google Scholar]
- 9.Sosa E, Scanavacca M, D’Avila A, Pilleggi E. A New Technique to Perform Epicardial Mapping in the Electrophysiology Laboratory. J Cardiovasc Electrophysiol. 1996;7:531–536. doi: 10.1111/j.1540-8167.1996.tb00559.x. [DOI] [PubMed] [Google Scholar]
- 10.Cano O, Hutchinson M, Lin D, Garcia F, Zado E, Bala R, Riley M, Cooper J, Dixit S, Gerstenfeld E, Callans D, Marchlinski FE. Electroanatomic Substrate and Ablation outcome for Suspected Epicardial Ventricular Tachycardia in Left Ventricular Nonischemic Cardiomyopathy. J Am Coll Cardiol. 2009;54:799–808. doi: 10.1016/j.jacc.2009.05.032. [DOI] [PubMed] [Google Scholar]
- 11.Bazan V, Gerstenfeld EP, Garcia FC, Bala R, Rivas N, Dixit S, Zado E, Callans DJ, Marchlinski FE. Site-specific twelve lead ECG features to identify an epicardial origin for left ventricular tachycardia in the absence of myocardial infarction. Heart Rhythm. 2007;4:1403–1410. doi: 10.1016/j.hrthm.2007.07.004. [DOI] [PubMed] [Google Scholar]
- 12.Stevenson WG, Khan H, Sager P, Saxon LA, Middlekauff HR, Natterson PD, Wiener I. Identification of reentry circuit sites during catheter mapping and radiofrequency ablation during catheter mapping and radiofrequency ablation of ventricular tachycardia late after myocardial infarction. Circulation. 1993;88:1647–1670. doi: 10.1161/01.cir.88.4.1647. [DOI] [PubMed] [Google Scholar]
- 13.Soejima K, Suzuki M, Maisel WH, Brunckhorst CB, Delacretaz E, Blier L, Tung S, Khan H, Stevenson WG. Catheter ablation in patients with multiple and unstable ventricular tachycardias after myocardial infarction: short ablation times guided by reentry circuit isthmuses and sinus rhythm mapping. Circulation. 2001;104:664–669. doi: 10.1161/hc3101.093764. [DOI] [PubMed] [Google Scholar]
- 14.Arenal A, Glez-Torrecilla E, Oritz M, Villacastin J, Fdez-Portales J, Sousa E, del Castillo S, Perez de Isla L, Jimenez J, Almendral J. Ablation of electrograms with an isolated, delayed component as treatment of unmappable monomorphic ventricular tachycardias in patients with structural heart disease. J Am Coll Cardiol. 2003;41:81–92. doi: 10.1016/s0735-1097(02)02623-2. [DOI] [PubMed] [Google Scholar]
- 15.Hutchinson MD, Gerstenfeld EP, Desjardins B, Bala R, Riley MP, Garcia FC, Dixit S, Lin D, Tzou WS, Cooper JM, Verdino RJ, Callans DJ, Marchlinski FE. Endocardial Unipolar Volatge Mapping to Detect Epicardial Substrate in Patients with Nonischemic Left Ventricular Cardiomyopathy. Circ Arrhythm Electrophysiol. 2011;4:49–55. doi: 10.1161/CIRCEP.110.959957. [DOI] [PMC free article] [PubMed] [Google Scholar]


