Abstract
Visualization tools that allow both optimization of instrument's parameters for data acquisition and specific quality control (QC) for a given sample prior to time-consuming database searches have been scarce until recently and are currently still not freely available. To address this need, we have developed the visualization tool LogViewer, which uses diagnostic data from the RAW files of the Thermo Orbitrap and linear trap quadrupole-Fourier transform (LTQ-FT) mass spectrometers to monitor relevant metrics. To summarize and visualize the performance on our test samples, log files from RawXtract are imported and displayed. LogViewer is a visualization tool that allows a specific and fast QC for a given sample without time-consuming database searches. QC metrics displayed include: mass spectrometry (MS) ion-injection time histograms, MS ion-injection time versus retention time, MS2 ion-injection time histograms, MS2 ion-injection time versus retention time, dependent scan histograms, charge-state histograms, mass-to-charge ratio (M/Z) distributions, M/Z histograms, mass histograms, mass distribution, summary, repeat analyses, Raw MS, and Raw MS2. Systematically optimizing all metrics allowed us to increase our protein identification rates from 600 proteins to routinely determine up to 1400 proteins in any 160-min analysis of a complex mixture (e.g., yeast lysate) at a false discovery rate of <1%. Visualization tools, such as LogViewer, make QC of complex liquid chromotography (LC)-MS and LC-MS/MS data and optimization of the instrument's parameters accessible to users.
Keywords: bioinformatics, LC-MS/MS, visualization tool
INTRODUCTION
Complex biological samples analyzed by liquid chromotography (LC)-mass spectrometry (MS)/MS do not lend themselves easily to quality control (QC) measurements, yet they are urgently needed. Although it is standard procedure to check whether LC is fully conditioned and a mass spectrometer is calibrated and tuned correctly for a simple, defined standard, this is not necessarily true for a complex, unknown sample.
Performance of a MS-based proteomics experiment is known to be highly dependent on the sample itself with detrimental effects when salt, detergent, or keratin contaminations are present. Even if a sample is optimally prepared, a proteomics experiment can still fail if the chosen LC and MS instrument parameters are not optimized for the sample to be investigated. Variances in setups and instrumentation itself also influence achievable performance. All of these factors certainly contribute to the relative scarcity of performance criteria. Recently, the Clinical Proteomic Technology Assessment for Cancer (CPTAC) group was the first to develop a set of performance criteria for linear trap quadrupole (LTQ) and Orbitrap instrumentation, mostly in a tabulated format.1–3 Independently from this multicenter group, we have developed a visualization tool, LogViewer, which uses diagnostic data from the RAW files of Thermo Orbitrap and LTQ-FT mass spectrometers to monitor relevant metrics such as MS and MS2 ion-injection times, precursor ion-charge states, repeat analyses, and other metrics, allowing a quick and easy assessment of specific QC parameters for each sample prior to time-consuming database searches. Prior to the development of this tool, we used Microsoft Excel to display most of the parameters but found the selection and display of 25,000–30,000 entries/parameter too cumbersome to be used routinely. The benefit of data visualization lies mostly in its speed and its accessibility to human interpretation, making it easier for novices and experts alike to gain insights that cannot be obtained with other formats. The LogViewer is also flexible, in that it allows users to optimize the performance of their individual LC-MS instrumentation (e.g., Thermo LTQ, LTQ-FT, Orbitrap Classic, Orbitrap Velos) to their respective samples.
MATERIALS AND METHODS
LogViewer Software
LogViewer is a python script, which loads data from log files generated by RawXtract,4 and displays the various QC metrics using Qt4 and Matplotlib libraries. The frequency of repeat analyses is approximated by performing hierarchical clustering on each scan's precursor mass-to-charge ratios (M/Z) using single-linkage clustering and maximum linkage of 10 ppm and tallying the number of scans in each cluster. A precompiled version of the tool and a sample log file are available at http://pel.caltech.edu/software/.
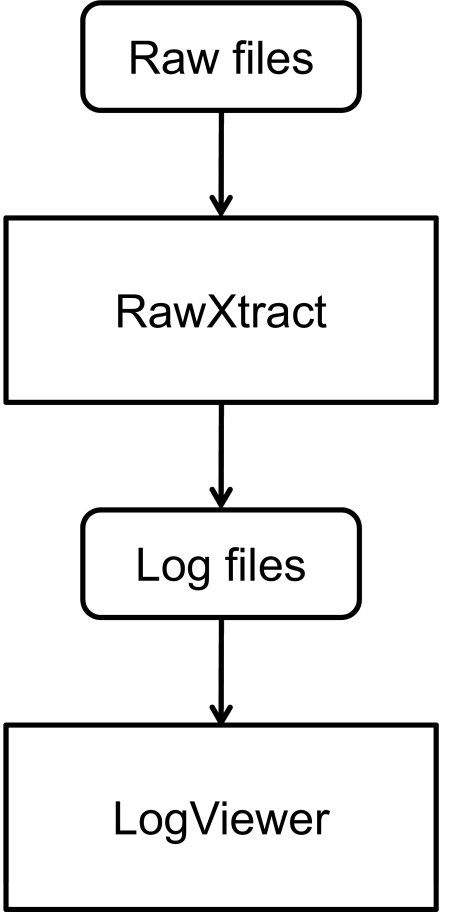
After downloading the installer on a computer with Windows (95 or higher), execute the installer to unpack the executable, and create a start menu entry. LogViewer can then be accessed from the Caltech folder in the start menu. After launching LogViewer, log files are loaded by clicking on the “Open File…” button in the lower right corner. Log files are generated from RawXtract as outlined in Fig. 1. Please note that .ms2 files as well as .log files from RawXtract need to be exported for the log files to be generated properly. After opening the log file, minimum and maximum retention times are set automatically. A smaller retention time window can be selected by adjusting the values and clicking the “Update” button.
FIGURE 1.
LogViewer uses the log files created by RawXtract. For LogViewer to display the parameters properly, it is necessary that .ms2 files as well as .log files are exported from RawXtract.
The various QC metrics displayed include: MS ion-injection time histograms, MS ion-injection time versus retention time, MS2 ion-injection time histograms, MS2 ion-injection time versus retention time, dependent scan histograms, charge-state histograms, M/Z distributions, M/Z histograms, mass histograms, mass distribution, summary, repeat analyses, Raw MS, and Raw MS2. All plots can be panned by selecting the pan icon. Additionally, plots can be zoomed to a particular region by selecting the icon with a magnifying glass and rectangle. Zoom to full extents is achieved by selecting the home icon. These icons are located on the lower left corner of the software. All plots can be saved at once by selecting the “File → Save Images” menu item. This will save Portable Network Graphics (.png) images of all plots in the same directory as the log file. Alternatively, individual plots can be saved by clicking on the disk icon in the desired tabbed window.
RESULTS
We have developed the visualization tool LogViewer to quickly and easily assess and evaluate the overall instrument's performance, as well as individual sample quality. LogViewer allows for visualization of diagnostic output data from log files generated by RawXtract4 and routine monitoring of important QC metrics. It displays those metrics that are important for a successful LC-MS/MS experiment: metrics that change during a routine analysis and are affected by user-specified parameters (e.g., ion-injection time, charge-state selection). The use of LogViewer to optimize instrument parameters using yeast lysate is illustrated and discussed in the following subsections.
MS- and MS2-Injection Times
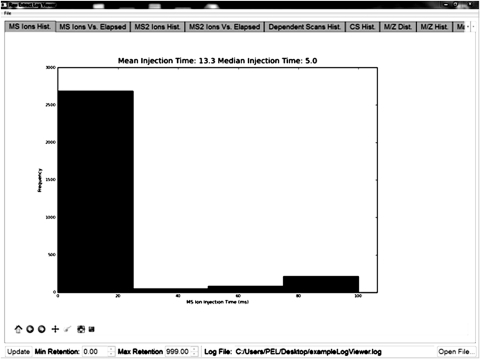
The rate-determining step of an ion trap analytical cycle is the MS- and MS2-injection time, the time it takes for precursor (MS) or fragment ions (MS2) to fill the trap. In a given setup, short MS (and MS2) ion-injection times are thus indicative of an optimized spray. MS (and MS2) ion-injection times are displayed as histograms to monitor overall performance or versus retention time, to display variations during an analysis. Although ionization efficiency has an effect on MS and MS2, we found short MS ionization times to indicate mostly optimized spray conditions. On an Orbitrap Classic or LTQ-FT collision-induced dissociation (CID) experiment, we generally see for automatic gain control target values of 1 × 10⁶ (MS) and 5 × 10³(MS/MS) ion-injection times of <50 ms in an optimized spray throughout the analysis. Fig. 2 shows a screenshot of the MS histogram showing a median ion-injection time of 5 ms. It should be noted that analogous values for an Orbitrap Velos should be considerably lower, as the Orbitrap Velos has a significantly improved ion transmission. During a spray-optimized analysis, larger variations may be observed before the sample is actually loaded on the column, indicating a lack of ionizable peptides at this time. Spray instabilities are detected with increased mean-injection times in the histograms and in the ion-injection time versus retention time display. This feature can also be helpful when samples are analyzed unsupervised (overnight and over weekends), and performance has decreased over this time period. If the spray has become unstable in the middle of a sequence, it can detect exactly when this happened and which samples need to be reanalyzed, as the occurrence of spray instability during a LC run can be easily determined using LogViewer.
FIGURE 2.
MS ion histogram. An optimized sample showed a median-injection time of 5 ms. Additional screenshots of all parameters of an optimized sample are available in the Supplemental information.
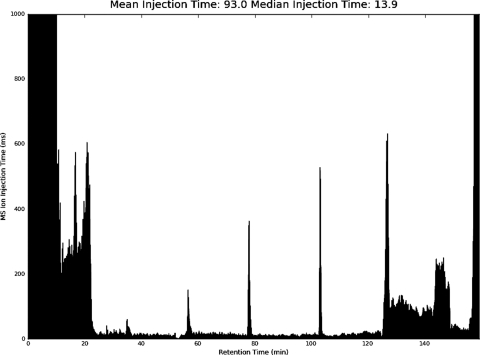
This metric was also useful to identify valve-closing irregularities on a previously used UltraPerformance LC (UPLC) pump. These irregularities presented themselves as spikes ca. every 25 min (Fig. 3) with the median-injection time still on target (below 20 ms). Here, the benefit of visualization tools, such as LogViewer, becomes apparent immediately. Even an untrained eye recognizes the spiked pattern and can start to investigate the underlying reason. In addition to optimized spray conditions, short MS2-injection times indicate optimization of sample load to the chosen instrument parameters.
FIGURE 3.
Injection time versus retention time shows spikes ca. every 25 min, revealing valve-closing irregularities of the UPLC pump.
Dependent Scan Histograms
When surveying the literature, it is often difficult to judge how many MS/MS data-dependent scans should be chosen for every precursor scan. For CID experiments, recommendations vary mostly between three and 10 data-dependent scans/precursor scan. When displaying the dependent scan number, we were able to identify performance problems when the frequency of dependent scans dropped as a result of inappropriate instrument settings (e.g., when the ACG targets for MS and MS2 were not optimized).
Charge-State Histograms
When peptides are ionized, their protonation status and thus, their charge states vary. It has been described previously5,6 that doubly charged ions fragment better in CID experiments than triply charged ions, wheras triply charged ions fragment better in electron transfer dissociation (ETD) experiments. In an effort to optimize for the preferential formation of doubly charged ions in CID, we experimented with different needle-tip materials (silica, coated and uncoated, metal). With the use of LogViewer, we found that the tip material influenced the generation of different charge states. A needle generating preferentially doubly charged ions was the New Objective PicoTip emitter with a P200P coating creating >70% doubly charged ions, followed by ca. 25% triply charged ions and few quadruply or higher charged ions. In contrast, uncoated emitters regularly produce less doubly charged ions (data not shown). In our optimized settings, we exclude singly charged ions, as many background ions are singly charged. Once optimized for the preferred charge state, unexpected run-to-run changes in charge-state distributions can be indicative of changes in sample composition (e.g., as a result of contamination, insufficient digestion).
M/Z Distribution and Histograms
Literature reports also often vary widely in the use of the M/Z range for the precursor scan (scan event 1). For instance, the CPTAC study recommended the use of 300–2000 M/Z. When monitoring the M/Z distribution, we noticed that for instance, yeast lysates rarely display M/Z above 1600. Thus, we limited the M/Z range to 300–1600 for yeast lysates. The narrower the M/Z window, the faster the scans can be performed, increasing the duty cycle and thus, the number of scans that can be analyzed in a given timeframe.
Mass Distribution and Histograms
The mass of a protonated peptide is calculated by multiplying its M/Z value with its charge state and subtracting its charge state times the proton mass. This additional information can be useful to identify incomplete digestion when an unexpected large number of polypeptides larger than 3500 Da are detected. Like most of the other metrics, this observation is dependent on the chosen LC and MS sample conditions. If, for instance, charge states are accepted or rejected, it will influence the observed mass distribution. A useful feature is the color coding in the mass distribution tab. Charge state 1 is displayed in red (not shown), charge state 2 is displayed in green, charge state 3 in blue, and charge state 4 and higher in cyan. Thus, an increase of singly or multiply charged ions can be visualized easily.
Repeat Analyses
In the Xcalibur software, LC and MS settings can be theoretically matched so that every ion is supposedly analyzed only once. In practice, this is not the case. Even in our currently best optimizations, we observe an average of ca. four repeat analyses, as the observable peak width varies for different peptides. In addition, high abundant peptides may leach out over longer periods of time. Ideally, each peptide would be analyzed only once (at its most intense point in the chromatogram). If every peptide is analyzed more than once, the number of identified peptides could be increased significantly by just allowing the dynamic exclusion list to be long enough to accommodate every observable ion into this list. Changes can be monitored using LogViewer.
Summary
In addition to the individual plots, a summary table shows the number of MS events, number of MS2 events, number of MS ion-injection times, number of MS2 ion-injection times at the chosen maximum-injection times, and number of MS2 scans with charge state 1+, 2+, 3+, 4+, 5+, 6+, 7+.
Raw MS and Raw MS2
Finally, all scan numbers and their associated retention times, injection times, M/Z, and charge states (in case of MS2) are listed in a table to allow the specific interrogation of a certain scan.
DISCUSSION
Most metrics in complex LC-MS/MS analyses show high interdependency and are best used in comparison. To optimize our system, we use biological samples that are similar to the samples of interest (e.g., yeast cell lysates or HeLa cell lysates when analyzing yeast or HeLa cells). Similar to commercially available protein standards, any self-generated standard contains unknown proteins, but self-generated standards do have the advantage that they are being processed in the same way that the sample will eventually be processed. Although we do use synthetic peptide standards for an initial system check, we found that they generally lack sufficient complexity that is needed for optimization of complex biological samples in global proteomics studies.
This is apparent immediately when just one metric, such as MS-injection times, is monitored and compared: a complex biological sample will produce an abundance of ions throughout the chromatogram, but a standard containing only a few low-concentrated peptides may only produce enough ions during the time interval when the peptides elute. A comparison between a sample of high and low complexity would thus be meaningless. Therefore, it is recommended to use a standard with the same complexity as the investigated sample.
LogViewer is designed to accommodate different instrument setups (e.g., Thermo LTQ, LTQ-FT, Orbitrap Classic, Orbitrap Velos) and sample requirements (e.g., low- and high-complexity samples). This allows for further optimization (e.g., when a different fragmentation technique, such as ETD, is used, or new instruments are incorporated into a lab) and for run-to-run QC. If in a sequence of unsupervised samples, the spray deteriorates for one sample, this sample can be identified and reanalyzed, whereas the remaining samples do not require reanalysis. Systematically optimizing all metrics allowed us to increase our protein identification rates from 600 proteins to routinely determine up to 1400 proteins in any 160-min Orbitrap Classic analysis at a protein and peptide false discovery rate of <1%. In addition to optimization of the instrument's parameters for data acquisition, specific QC for a given sample prior to time-consuming database searches is enabled by LogViewer analysis.
Supplemental Information
Supplemental information displays all 14 LogViewer screenshots of an optimized sample.
ACKNOWLEDGMENTS
This research was supported by the Betty and Gordon Moore Foundation and the Beckman Institute. We acknowledge Raymond Deshaies and Natalie Kolawa for their continued interest and investment in optimizing sample acquisition.
REFERENCES
- 1. Tabb DL, Vega-Montoto L, Rudnick PA, et al. Repeatability and reproducibility in proteomic identifications by liquid chromatography-tandem mass spectrometry. J Proteome Res 2010;9:761–776 [DOI] [PMC free article] [PubMed] [Google Scholar]
- 2. Paulovich AG, Billheimer D, Ham AJ, et al. Interlaboratory study characterizing a yeast performance standard for benchmarking LC-MS platform performance. Mol Cell Proteomics 2010;9:242–254 [DOI] [PMC free article] [PubMed] [Google Scholar]
- 3. Rudnick PA, Clauser KR, Kilpatrick LE, et al. Performance metrics for liquid chromatography-tandem mass spectrometry systems in proteomics analyses. Mol Cell Proteomics 2010;9:225–241 [DOI] [PMC free article] [PubMed] [Google Scholar]
- 4. McDonald WH, Tabb DL, Sadygov RG, et al. MS1, MS2, and SQT—three unified, compact, and easily parsed file formats for the storage of shotgun proteomic spectra and identifications. Rapid Commun Mass Spectrom 2004;18:2162–2168 [DOI] [PubMed] [Google Scholar]
- 5. Swaney DL, McAlister GC, Coon JJ. Decision tree-driven tandem mass spectrometry for shotgun proteomics. Nat Methods 2008;5:959–964 [DOI] [PMC free article] [PubMed] [Google Scholar]
- 6. Huang Y, Triscari JM, Tseng GC, et al. Statistical characterization of the charge state and residue dependence of low-energy CID peptide dissociation patterns. Anal Chem 2005;77:5800–5813 [DOI] [PMC free article] [PubMed] [Google Scholar]
Associated Data
This section collects any data citations, data availability statements, or supplementary materials included in this article.


