Figure 2.

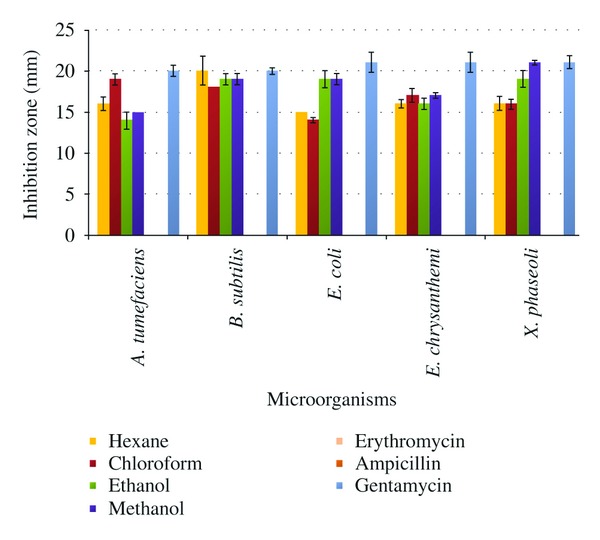
Inhibition zones (in mm) observed in methanol, ethanol, chloroform, and hexane extracts as compared to ampicillin, erythromycin, and gentamycin. Bar represents standard errors and mean value of inhibition zone.

Inhibition zones (in mm) observed in methanol, ethanol, chloroform, and hexane extracts as compared to ampicillin, erythromycin, and gentamycin. Bar represents standard errors and mean value of inhibition zone.