Abstract
Purpose: In digital breast tomosynthesis (DBT), a volumetric reconstruction of the breast is generated from a limited range of x-ray projections. One trade-off of DBT is resolution loss in the projections due to non-normal (i.e., oblique) x-ray incidence. Although degradation in image quality due to oblique incidence has been studied using empirical data and Monte Carlo simulations, a theoretical treatment has been lacking. The purpose of this work is to extend Swank’s calculations of the transfer functions of turbid granular phosphors to oblique incidence. The model is ultimately used as a tool for optimizing the design of DBT detectors.
Methods: A quantum-limited system and 20 keV x-rays are considered. Under these assumptions, the modulation transfer function (MTF) and noise power spectra (NPS) are derived using the diffusion approximation to the Boltzmann equation to model optical scatter within the phosphor. This approach is applicable to a nonstructured scintillator such as gadolinium oxysulfide doped with terbium (Gd2O2S:Tb), which is commonly used in breast imaging and which can reasonably approximate other detector materials. The detective quantum efficiency (DQE) is then determined from the Nishikawa formulation, where it is written as the product of the x-ray quantum detection efficiency, the Swank factor, and the Lubberts fraction. Transfer functions are calculated for both front- and back-screen configurations, which differ by positioning the photocathode at the exit or entrance point of the x-ray beam, respectively.
Results: In the front-screen configuration, MTF and DQE are found to have considerable angular dependence, while NPS is shown to vary minimally with projection angle. As expected, the high frequency MTF and DQE are degraded substantially at large angles. By contrast, all transfer functions for the back-screen configuration have the advantage of significantly less angular dependence. Using these models, we investigated the possibility for optimizing the design of DBT detectors. As an example optimization strategy, the phosphor thickness which maximizes the DQE at a fixed frequency is analyzed. This work demonstrates that the optimal phosphor thickness for the front-screen is angularly dependent, shifting to lower thickness at higher angles. Conversely, the back-screen is not optimized by a single thickness but instead attains reasonably high DQE values over a large range of thicknesses. Although the back-screen configuration is not suited for current detectors using a glass substrate, it may prove to be preferred in future detectors using newly proposed plastic thin-film transistor (TFT) substrates.
Conclusions: Using the diffusion approximation to the Boltzmann equation to model the spread of light in a scintillator, this paper develops an analytical model of MTF, NPS, and DQE for a phosphor irradiated obliquely. The model is set apart from other studies on oblique incidence in being derived from first principles. This work has applications in the optimization of DBT detector design.
Keywords: oblique x-ray incidence, digital breast tomosynthesis (DBT), optical transfer function (OTF), noise power spectra (NPS), detective quantum efficiency (DQE)
INTRODUCTION
In many radiographic studies, non-normally (i.e., obliquely) incident x-rays provide a source of blurring at the periphery of the detector due to the divergence of the x-ray beam emitted from the focal spot. Que and Rowlands proposed an analytical model of the resolution loss due to oblique incidence by deriving an expression for the modulation transfer function (MTF) of amorphous selenium (a-Se) detectors from first principles.1 Their work assumes that the detector is operated in drift mode, so that the point spread function (PSF) for normal incidence is a delta function and hence the MTF for normal incidence is unity at all frequencies.2
Oblique incidence is more readily observed in digital mammography (DM) than many other imaging studies. A DM detector is placed closer to the focal spot than most modalities3 to counteract the loss in x-ray penetration resulting from the use of relatively low energies (∼20 keV).4, 5, 6 The drawback of decreasing the source-to-detector distance is increasing the angle of incidence relative to the normal, especially at the edges of the detector. For example, the maximum angle of incidence is 25° for a DM system with a detector field-of-view (FOV) of 24 × 30 cm and a source-to-image distance of 70 cm measured at the midpoint of the chest wall.
In digital breast tomosynthesis (DBT), low dose x-ray projection images are acquired over a limited range of angles around the breast, and sharply in-focus slices at all depths of the breast volume are generated using image reconstruction techniques. Preliminary studies indicate that DBT provides increased sensitivity and specificity relative to DM for the early detection of breast cancer in women.7 One shortcoming of DBT, however, is that it is more directly impacted by the resolution loss due to oblique incidence than DM. The maximum projection angle in DBT can be as large as 20° or 30°, and the angle of incidence at the edges of the detector is even higher if one takes into account the divergent x-ray beam geometry. While some DBT systems incorporate a rotating detector to counteract changes in obliquity, many systems employ a stationary detector.
Mainprize et al. experimentally demonstrated the resolution loss due to oblique incidence in cesium iodide doped with thallium (CsI:Tl), a structured phosphor-based detector, using the slanted edge technique to measure MTF.8 The authors showed that at 10° incidence, the MTF degradation becomes comparable to the resolution loss associated with other common sources of image blurring, such as the blurring of the focal spot and the lateral spread of visible light within the scintillator. At 40° incidence, the MTF is reduced considerably; for example, at 5 line pairs per mm (lp/mm), the MTF is degraded by 35%–40% over a broad range of kVp and target-filter combinations.
While Mainprize et al. did not measure noise power spectra (NPS), Hajdok and Cunningham have calculated NPS using Monte Carlo simulations of a-Se.3 Their work demonstrated that unlike MTF, NPS has minimal angular dependence. Since the detective quantum efficiency (DQE) is dependent upon the square of the MTF, Hajdok and Cunningham have shown that the DQE degradation with oblique incidence at high frequencies is more pronounced than the MTF degradation.
Although oblique incidence has been studied experimentally and using Monte Carlo simulations, a theoretical treatment has been lacking. For this reason, the purpose of this paper is to extend Swank’s calculations9 of the transfer functions of turbid granular phosphors to oblique incidence. Building off our previous work on oblique incidence,10 we analyze the light diffusion equations in a nonstructured scintillator such as gadolinium oxysulfide doped with terbium (Gd2O2S:Tb), which is commonly used in breast imaging and which can reasonably approximate other detector materials. The theoretical formulation of this work differs from the one proposed by Que and Rowlands in not making the assumption that the PSF for normal incidence is a delta function. Ultimately, the analytical model is used as a tool for optimizing the design of the phosphor for oblique incidence.
METHODS
Transfer functions for front-screen configuration
The optical transfer function (OTF), NPS, and DQE of a turbid granular phosphor are derived here from first principles for all angles of incidence. The Boltzmann transport equation may be used to model the spread of visible light in a turbid phosphor. A first-order, steady state solution to the Boltzmann transport equation is a diffusion equation of the form11
| (1) |
where φ(r) is the product of the density of the secondary carriers (i.e., the optical photons) with the diffusion constant, σ is the reciprocal of the mean diffusion length of the secondary carriers, and S(r) is the source function. The diffusion equation is a useful approximation to the Boltzmann transport equation provided that three criteria are met: (1) solutions for φ(r) are determined far from the x-ray source S(r) relative to the mean free path of optical scatter; (2) the optical properties of the phosphor possess no discontinuities; and (3) the probability of optical absorption is small compared against the probability of optical scatter.12 This model has been used by Swank for normal incidence 9 and has shown good agreement with experimental data.12, 13
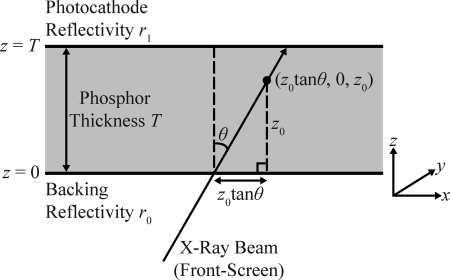
As shown in Fig. 1, the source function S(r) in Eq. 1 may be modeled as the point (z0 tan θ, 0, z0) along the x-ray path length, where z0 is depth within the scintillator of total thickness T and where θ is the angle of incidence relative to the normal. In terms of delta functions, S(r) can be written as
| (2) |
Using the Fourier representation of the delta function,14 the source function can equivalently be expressed as the integral
| (3) |
Defining ν as the 2D spatial frequency vector with components νx and νy, solutions to Eq. 1 can be written in the form
| (4) |
Substituting Eqs. 3, 4 into Eq. 1, it can be shown that
| (5) |
where
| (6) |
| (7) |
To solve Eq. 5 for ψk(z), one can apply integral transform techniques.15, 16 Denoting the Laplace transform of ψk(z) as Lk(p), the transform of the differential equation is
| (8) |
where C1 and C2 are the constants of integration. Solving for Lψk(p) and taking the inverse transform generates the following piece-wise expression for ψk(z):
| (9) |
The constants C1 and C2 can now be determined from boundary conditions concerning secondary carrier currents directed toward the planes at z = 0 and z = T. In terms of the inverse relaxation length, τ, the secondary carrier currents across any plane of constant z are
| (10) |
| (11) |
In the right-hand side of the two equations, the first term models the effusion current, while the second term comes from Fick’s law. The first boundary condition is determined by the reflectivity r0 of the plane at z = 0. Noting that jright(0) = r0jleft(0), one finds
| (12) |
where
| (13) |
The second boundary condition is determined from the reflectivity r1 of the boundary at z = T, as stipulated by the expression jleft(T) = r1jright(T). Defining ρ1 similar to ρ0 and noting that the boundary conditions hold for each Fourier component ψk of φ, it can be shown that
| (14) |
| (15) |
Consistent with Swank’s approach, the photocathode is defined by the plane z = T and the backing is defined by the plane z = 0, as diagrammed schematically in Fig. 1. The OTF of the scattering process, G(ν, z0), is then determined for a point source from the expression
| (16) |
Hence,
| (17) |
To calculate the OTF of the entire phosphor, one multiplies Eq. 17 by the relative x-ray signal as a function of the depth z0
| (18) |
where μ is the linear attenuation coefficient of the phosphor, and then integrates over the phosphor thickness. Assuming a front-screen (F) configuration in which x-rays are first incident on the backing at z = 0 before striking the photocathode at z = T, the OTF is thus
| (19) |
| (20) |
where
| (21) |
| (22) |
The MTF is found from the normalized modulus of the OTF.17
Figure 1.
In terms of delta functions, the source function S(r) at the depth z0 of the phosphor is found from trigonometry to be δ(x-z0tanθ)δ(y)δ(z-z0), where θ is the angle of x-ray incidence relative to the normal. The figure assumes a front-screen configuration in which x-rays are incident on the backing at z = 0 before striking the photocathode at z = T. Reversing the direction of the arrowhead of the x-ray beam converts the front-screen configuration to a back-screen configuration.
In the absence of outside noise sources, the quantum NPS or WF(ν) is calculated by integrating the product of NF(z0) with |G(ν, z0)|2 from z0 = 0 to z0 = T.
| (23) |
| (24) |
With the OTF and quantum NPS known, it is now possible to determine the DQE. From the work of Nishikawa, DQE can be formulated as the product of four terms12
| (25) |
where AQ is the x-ray quantum detection efficiency (QDE) determined by the Lambert-Beer Law as
| (26) |
AS is the Swank information factor
| (27) |
RC(ν) is the Lubberts fraction
| (28) |
and RN(ν) is the ratio of the x-ray quantum noise power to the total noise power. Assuming a quantum-limited imaging system, RN(ν) is taken to be unity in this work.
Transfer functions for back-screen configuration
In a similar fashion, the transfer functions for a back-screen (B) configuration can be calculated. Unlike the front-screen configuration, x-rays first strike the photocathode at z = T before passing through the backing at z = 0. This modification reverses the direction of the x-ray beam in Fig. 1 without further altering the diagram. Hence
| (29) |
so that the OTF and quantum NPS are found to be
| (30) |
| (31) |
Equations 30, 31 follow from Eqs. 19, 23; the subscript “B” is used to denote a back-screen.
RESULTS FOR A MODEL DETECTOR
Transfer Functions for Front- and Back-Screen Configurations
The OTF, NPS, and DQE calculations are now illustrated for a phosphor with a reflective backing (r0 = 1), a nonreflective photocathode (r1 = 0), and optical scatter at the diffusion limit (τ → ∞). In view of the limitations of Swank’s model, a large value of τ has been chosen. As Swank demonstrated in his original paper,9 the MTF of a scattering phosphor (τ > 0) is always higher than the MTF a nonscattering phosphor (τ = 0) at low frequencies, but the opposite trend arises at high frequencies. The crossover point of the scattering and nonscattering MTF curves corresponds to the frequency beyond which Swank’s model becomes inaccurate. For very small values of τ, the crossover point occurs at relatively low frequencies. However, for infinite τ, the scattering MTF curve never crosses the nonscattering MTF curve between 0 and 10 lp/mm. Hence, Swank’s model is increasingly accurate in approaching the diffusion limit.
In calculating the transfer functions, we assume 20 keV monoenergetic x-rays4, 5, 6 and a porous, 100 μm thick Gd2O2S:Tb phosphor with 50% packing density. The attenuation coefficient μ for the porous phosphor is determined by halving the value for a crystalline phosphor.12 Since crystalline Gd2O2S has a mass density of 7.34 g/cm3 and a mass attenuation coefficient of 36.9 cm2/g for 20 keV x-rays,18 the attenuation coefficient for porous Gd2O2S is 13.5 mm−1.
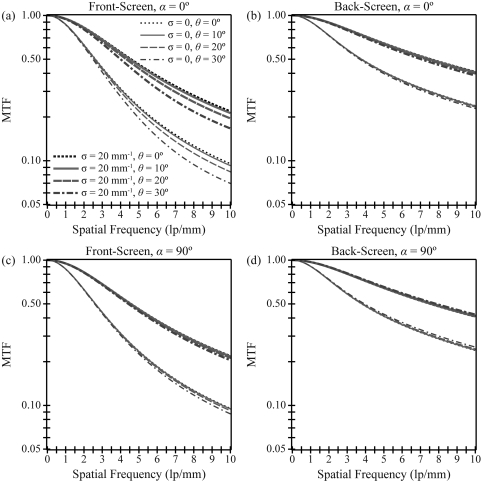
In Fig. 2, cross sections of the MTF surface are plotted versus frequency at two polar angles (α) of the frequency vector (0° and 90°) for multiple angles of incidence and two optical absorption parameters. The value of the high optical absorption parameter (σ = 20 mm−1) was chosen to match Swank’s example9 in which σT = 2. In practice, the optical absorption can be increased by adding an optical dye to the phosphor. Following convention, the polar angle is defined as the angle of the frequency vector relative to the x axis, so that the 0° polar angle is only perpendicular to the x-ray beam for normal incidence and the 90° polar angle is always perpendicular to the x-ray beam (Fig. 1).
Figure 2.
The modulation transfer function (MTF) of a porous Gd2O2S:Tb phosphor is plotted versus frequency measured along 0° and 90° polar angles for multiple incident angles (θ = 0°, 10°, 20°, 30°) and two optical absorption parameters (σ = 0, 20 mm−1). The scintillator possesses a reflective backing, a nonreflective photocathode, optical scatter at the diffusion limit, and quantum-limited noise. Also, the phosphor thickness is 100 μm, and the incident x-ray energy is 20 keV. As shown, the front-screen configuration has considerably more angular dependence than the back-screen configuration.
Consistent with Swank’s work at normal incidence, Fig. 2 demonstrates that increasing the optical absorption increases the MTF. Figure 2a indicates that increasing the angle of incidence decreases the MTF, giving rise to poorer spatial resolution in the front-screen configuration. For example, comparing 30° incidence to normal incidence at 5.0 lp/mm (α = 0°), the MTF decreases by 17% in a phosphor with no optical absorption and by 15% in a phosphor with high optical absorption. As expected, the MTF has minimal angular dependence orthogonal to the ray of incidence [Fig. 2c].
Figures 2b, 2d demonstrate that the back-screen configuration has superior MTF to the front-screen configuration for all projection angles. This result has been well-established for normal incidence.19, 20 More significantly, Figures 2b, 2d further show that the angular dependence of the MTF is much less pronounced in the back-screen configuration than in the front-screen configuration. For example, comparing 30° incidence to normal incidence at 5.0 lp/mm along a 0° polar angle, the back-screen MTF decreases by a mere 3%. Unlike the front-screen, the back-screen MTF increases slightly with projection angle for measurements orthogonal to the incident ray.
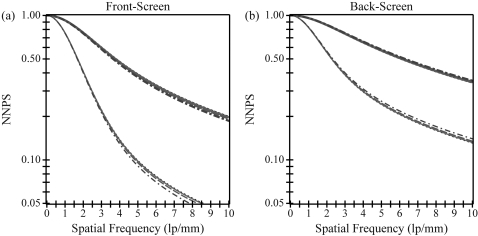
In Fig. 3, normalized NPS (NNPS) is plotted versus frequency for the same scintillator. Like MTF, NNPS increases with increasing optical absorption for all angles of incidence. Unlike MTF, NNPS is independent of the directionality of the frequency vector. Over projection angles typical of DBT, the angular dependence of the NNPS is minimal. For example, comparing 30° incidence to normal incidence at 5.0 lp/mm in a front-screen configuration, NNPS decreases by 8% in a phosphor with no optical absorption and by 4% in a phosphor with high optical absorption. In a back-screen configuration, NNPS increases slightly by 5% and 2%, respectively.
Figure 3.
Normalized noise power spectra (NNPS) is plotted versus frequency. NNPS is independent of the directionality of the frequency vector. While front-screen NNPS decreases with projection angle, back-screen NNPS increases slightly with projection angle. The plots implicitly share a legend with Fig. 2.
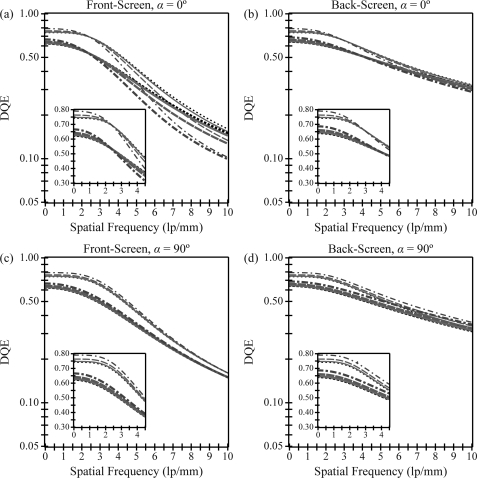
Figure 4 shows DQE versus frequency. In both a front- and back-screen configuration, Figures 4a, 4b demonstrate that for measurements made along a 0° polar angle, DQE increases with projection angle at low frequencies and decreases with projection angle at high frequencies. At low frequencies, the angular dependence of the x-ray quantum detection efficiency (AQ) is responsible for the DQE increase. In calculating AQ using Eq. 26, the x-ray path length increases from the phosphor thickness T with normal incidence to Tsecθ with oblique incidence; hence a greater number of x-rays are converted to visible light. At high frequencies, the degradation in DQE with increasing projection angle arises from the combined angular dependencies of the OTF and NPS. The high frequency DQE for the front-screen configuration is lower than that of the back-screen configuration, and its degradation with projection angle is much more pronounced. For example, at 5.0 lp/mm in a front-screen irradiated at a 30° angle, the DQE decreases by 20% relative to normal incidence. In the back-screen configuration, the relative decrease in DQE is less than 5%.
Figure 4.
Detective quantum efficiency (DQE) is plotted versus frequency. Along a 0° polar angle, DQE increases with projection angle at low frequencies and only decreases with projection angle at high frequencies. The front-screen has much more angular dependence than the back-screen at very high frequencies. For measurements orthogonal to the incident ray (90° polar angle), DQE increases with projection angle over a very broad range of frequencies in both configurations. The plots implicitly share a legend with Fig. 2.
In the direction orthogonal to the incident ray, DQE increases with projection angle over a very broad range of frequencies [Figs. 4c, 4d]. Comparing 30° incidence with normal incidence at 5.0 lp/mm in a front-screen configuration, DQE increases by 6% in a phosphor with no optical absorption and by 4% in a phosphor with high optical absorption. Using a back-screen configuration, the relative increase in DQE is approximately twice as high.
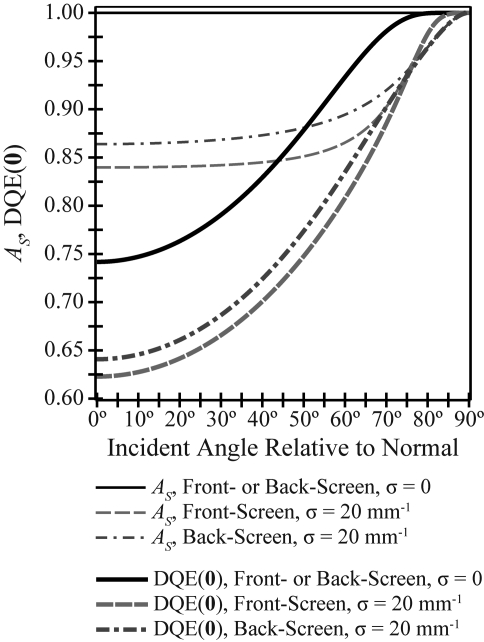
In Fig. 5, the angular dependence of the Swank factor (AS) used for calculating the DQE is studied. Swank has shown that AS provides a measure of the fluctuation in signal generated from each x-ray photon due to variability in the absorbed energy of each interacting x-ray and in the number of secondary carriers generated from each interacting x-ray.21 Figure 5 demonstrates that in a phosphor with no optical absorption, the Swank factor is unity at all projection angles for either the front- or back-screen configuration. By contrast, in a phosphor with high optical absorption, the Swank factor has slight angular dependence over projection angles typical of DBT. For example, comparing 30° incidence to normal incidence, AS increases by 0.3% in a front-screen configuration and by 0.5% in a back-screen configuration. At very oblique angles approaching shearing incidence (θ = 90°), the Swank factor increases sharply to unity.
Figure 5.
The Swank information factor (AS) has no angular dependence in a phosphor lacking optical absorption and slight angular dependence over typical incident angles in a phosphor with high optical absorption. DQE(0) has greater relative variation with incident angle. Both AS and DQE(0) increase sharply to unity at angles approaching shearing incidence (θ = 90°).
Unlike AS, DQE(0) is projection angle dependent for all possible optical absorption parameters. For both configurations, the relative increase in DQE(0) comparing 30° incidence to normal incidence is 6% in a phosphor with no optical absorption and 7% in a phosphor with high optical absorption. The angular dependence of DQE(0) is therefore more pronounced than the Swank factor.
Anisotropy of the transfer functions over the detector area
Because the focal spot of a DBT system emits x-rays in all directions, the angle of incidence is spatially variant at each point on the detector. Assuming a stationary detector whose center-of-rotation (COR) coincides with the midpoint of the chest wall, the angle of incidence relative to the normal at each point (x, y) on the detector may be determined from the expression
| (32) |
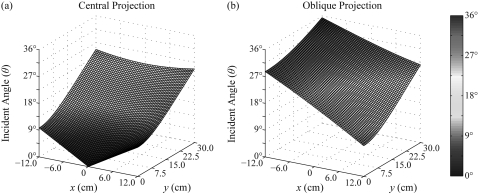
where h is the source-to-COR distance and Δ is the nominal projection angle (i.e., the angle of the x-ray tube arc relative to the normal at the COR). In deriving this result, the phosphor thickness (T) is taken to be negligible compared against the source-to-COR distance (h). Also, the chest wall defines the x axis of the detector and its midpoint the origin. For a 24 × 30 cm field-of-view (FOV) and a source-to-COR distance of 70 cm, the angle θ is plotted versus the length (x) and the width (y) of the detector for the central projection (Δ = 0°) and an oblique projection (Δ = 20°) in Fig. 6. In the central projection [Fig. 6a], the angle of incidence relative to the normal varies between 0° and 25°, and in the oblique projection [Fig. 6b], it varies between 10° and 35°. For either case, the maximum angle is found at a corner of the FOV opposite the chest wall.
Figure 6.
The angle of incidence relative to the normal is plotted versus position along the detector for (a) the central projection and (b) an oblique projection. The DBT system has a source-to-COR distance of 70 cm, and the nominal projection angle in (b) is 20°.
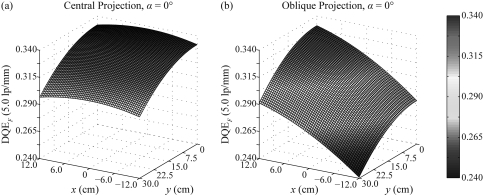
Like the angle of incidence, the transfer functions of the phosphor are spatially variant across the detector area (Fig. 7). To illustrate the spatial anisotropy of one of the transfer functions, a surface plot of front-screen DQE versus position along the detector is shown for the frequency 5.0 lp/mm in a phosphor with high optical absorption assuming a 0° polar angle for the frequency vector. In the central projection [Fig. 7a], the front-screen DQE varies between 0.34 and 0.30 (12% decrease), and in the oblique projection [Fig. 7b], it varies between 0.33 and 0.24 (27% decrease). Although not plotted in the figure, one can show that the back-screen DQE has much less variation over the detector area in either projection (<4% decrease).
Figure 7.
The anisotropy of the transfer functions over the detector is illustrated by plotting the front-screen DQE at a fixed spatial frequency (5.0 lp/mm) versus areal position, assuming high optical absorption (σ = 20 mm−1) and frequency measurements along a 0° polar angle. The oblique projection has greater variation in DQE over the detector area than the central projection. The directionalities of the x and y axes are flipped relative to Fig. 6 to improve visualization of the surfaces.
Optimization of phosphor thickness for oblique incidence
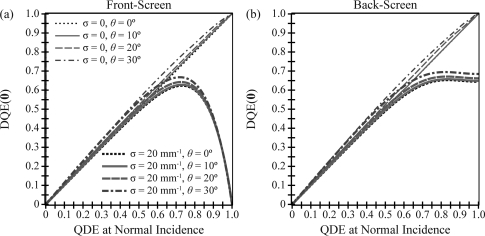
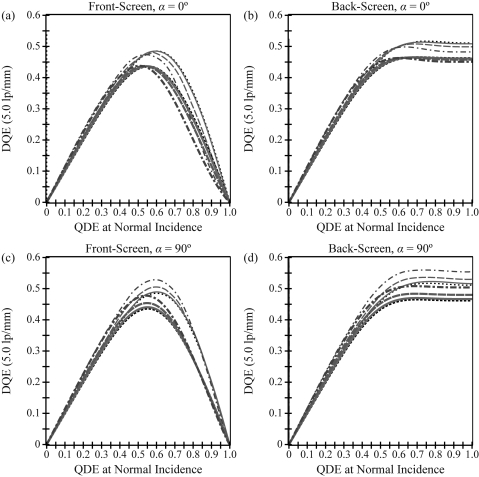
In addition to illustrating the impact of oblique incidence on the transfer functions of a phosphor, the analytical models developed in this work can be used as a platform for optimizing detector design over the range of projection angles used in DBT. One important element in the design of a phosphor is its x-ray quantum detection efficiency (QDE). In Figs. 89, DQE at a fixed frequency is plotted versus QDE at normal incidence to investigate whether DQE can be maximized by varying QDE. Both figures have been generated using the same phosphor parameters analyzed in Figs. 2345, except the phosphor thickness T is now left as a variable which allows QDE at normal incidence to vary.
| (33) |
In Eq. 33, AQ0 denotes the QDE at normal incidence.
Figure 8.
For four angles of incidence and two optical absorption parameters, the dependency of DQE(0) on QDE at normal incidence is analyzed. With no optical absorption, DQE(0) for both front- and back-screen configurations is optimized by large QDE. With high optical absorption, the maximum DQE(0) for the front-screen occurs at intermediate QDE, while relatively high DQE(0) for the back-screen occurs over a broad range of large QDE. The optimal QDE for the front-screen is angularly dependent.
Figure 9.
At 5.0 lp/mm, DQE is plotted versus QDE at normal incidence. In the front-screen configuration, DQE is optimized by an intermediate QDE. The optimal QDE is projection angle dependent, shifting to lower values (thinner phosphors) at larger angles. By contrast, in the back-screen configuration, relatively high DQE is supported over large QDE values for all projection angles. The plots implicitly share a legend with Fig. 8.
Figure 8 illustrates that in a front- or back-screen configuration with no optical absorption, DQE(0) can be optimized by manufacturing a phosphor with a very large thickness (100% QDE). By contrast, in a phosphor with high optical absorption, the dependency of DQE(0) on QDE is quite different for the two configurations. In a front-screen, DQE(0) is maximized by an intermediate QDE which is projection angle dependent, favoring smaller thicknesses at larger angles. For example, in the 0° and 30° projections, the optimal QDE at normal incidence are 0.73 and 0.72 corresponding to 97 and 94 μm thicknesses, respectively. By contrast, the back-screen DQE(0) attains relatively high values over a broader range of QDE. With 100% QDE, DQE(0) plateaus to 0.64 and 0.68 for the 0° and 30° projections, respectively.
In Fig. 9, the dependency of DQE on QDE is analyzed at a higher frequency (5.0 lp/mm). The high frequency DQE for the front-screen is maximized at an intermediate QDE for both optical absorption parameters. For measurements made along the 0° polar angle in a front-screen with no optical absorption, the optimal QDE values at normal incidence are 0.60 for the 0° projection and 0.54 for the 30° projection, corresponding to 68 and 58 μm thicknesses, respectively [Fig. 9a]. With high optical absorption, the respective QDE optima are 0.55 and 0.51 (59 and 52 μm thicknesses). In the direction orthogonal to the incident ray, the optimal QDE have less projection angle dependence [Fig. 9c].
Unlike the front-screen configuration, the back-screen configuration supports relatively high DQE over large QDE values at 5.0 lp/mm. For measurements made along the 0° polar angle [Fig. 9b], the back-screen DQE plateaus to 0.51 and 0.48 for the 0° and 30° projections, respectively, in a phosphor with no optical absorption (0.46 and 0.45 with high optical absorption). For measurements made along the orthogonal direction, the back-screen DQE attains a higher plateau; also, the asymptote actually increases slightly with projection angle [Fig. 9d].
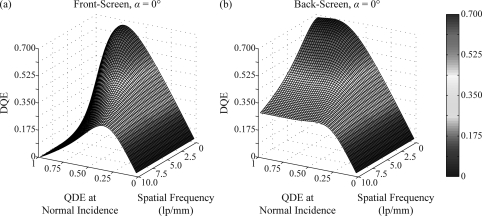
To illustrate the dependence of DQE on both frequency and QDE, a surface plot is shown in Fig. 10 assuming 30° incidence, high optical absorption, and frequency measurements along the 0° polar angle. The curvature of the front-screen surface demonstrates that the value of QDE which maximizes DQE decreases with frequency. By contrast, the back-screen surface shows that DQE is not optimized by a single QDE value. Instead, at all frequencies, the back-screen supports relatively high DQE over very large QDE.
Figure 10.
A surface plot shows the dependence of DQE on both frequency and QDE at normal incidence, assuming θ = 30°, σ = 20 mm−1, and a 0° polar angle for the frequency vector. At all frequencies, the front-screen DQE is optimized by an intermediate QDE. By contrast, the back-screen DQE attains relatively high values over a broad range of large QDE (thick phosphors).
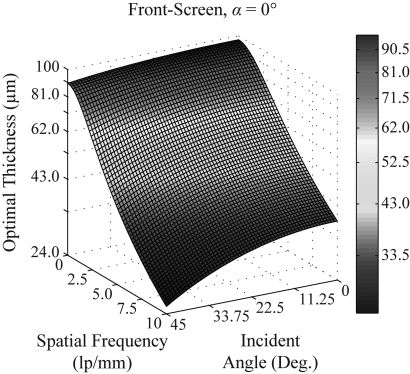
Figures 8910 demonstrate that the optimal thickness of a front-screen is both projection angle dependent and frequency dependent. In Fig. 11, the combined dependence is shown explicitly in a surface plot, assuming a 0° polar angle and high optical absorption. The graph was generated in matlab R2010b by discretizing a grid (60 × 60) of incident angles and frequencies from 0° to 45° and 0 to 10 lp/mm, respectively. The optimal thickness which maximizes DQE was determined by the zero of the first partial derivative of DQE with respect to phosphor thickness. Because the zeros of the first DQE derivative cannot be easily solved in closed form, Newton’s method was implemented to find the zeros numerically
| (34) |
where DF is the symbolic abbreviation for front-screen DQE. For all projection angles and frequencies investigated in the plot, the initial guess (25 μm) and the number of iterations (9) provided convergence exceeding ten decimal places. Figure 11 demonstrates that the optimal phosphor thickness for the front-screen configuration is a decreasing function of both incident angle and frequency, ranging from 97 μm (0° incidence, 0 lp/mm) to 25 μm (45° incidence, 10 lp/mm).
Figure 11.
For a front-screen configuration, the dependence of the optimal phosphor thickness on both the angle of incidence and frequency is analyzed, assuming σ = 20 mm−1 and a 0° polar angle for the frequency vector.
COMPARISON WITH RESULTS IN THE LITERATURE
This paper extends Swank’s calculations9 of the transfer functions of turbid phosphors to oblique x-ray incidence. In the limiting case of normal incidence, the formulas presented in this paper exactly reduce to Swank’s results. Our work is unique in modeling the transfer functions for oblique incidence in closed form without making the assumption that the PSF of normal incidence is a delta function.1 One benefit of this approach is unifying many prior results on oblique incidence under one model. For example, in a front-screen configuration, we demonstrate that oblique incidence degrades the MTF, and that the resultant loss in resolution becomes more pronounced with increasing frequency and increasing angle. Although these findings are derived for a turbid phosphor such as Gd2O2S:Tb, they are consistent with experimental data on CsI:Tl presented by Mainprize et al.8 as well as analytical modeling of a-Se proposed by Que and Rowlands.1 On a similar note, we have observed that NPS is degraded with increasing projection angle, though to a lesser degree than MTF. This finding is concordant with the prior work of Hajdok and Cunningham,3 who performed Monte Carlo simulations of a-Se. As a final point, we have shown that DQE increases with incident angle at low frequencies but only decreases with incident angle at high frequencies. Consistent with the findings of Hajdok and Cunningham, the DQE degradation with projection angle at high frequencies is more pronounced than the MTF degradation, reflecting the dependency of DQE on the square of MTF.
In this work, it has been observed that the Swank factor is angularly dependent, but that its variation is small over projection angles typical of DBT. In particular, it has been shown that the Swank factor changes by no more than 0.5% comparing 0° and 30° incidence. This observation is consistent with Monte Carlo simulations of CsI:Tl phosphors conducted by Badano et al., who demonstrated that the variation in the Swank factor over projection angles typical of DBT is minimal.22 While the relative change in the Swank factor with projection angle is small, the relative increase in DQE(0) is more substantial, as it includes the effect of increasing x-ray quantum detection efficiency with increasing projection angle.
Although our work demonstrates consistency with other studies on oblique incidence, it is important to identify fundamental differences between the detectors addressed in the comparison. This work models a turbid phosphor in which visible light spreads by optical scatter. By contrast, prior studies on CsI:Tl (Refs. 8, 22) assume a structured phosphor in which needlelike crystals approximately 10 μm in diameter transmit the optical photons to the photocathode by total internal reflection, thereby minimizing the lateral spread of visible light.19, 23 At a given incident angle, structured phosphors should have higher MTF than turbid phosphors for this reason. Although the transfer functions of turbid phosphors are different from structured phosphors, this work demonstrates that their angular dependence follows comparable trends. On a similar note, our model has shown concordance with prior studies on oblique incidence in a-Se.1, 3 In a-Se, an absorbed x-ray ionizes a Se atom, freeing an electron and a hole which migrate to different ends of the detector due to an applied electric field.19 In drift mode, the electric field is small enough so that the electron and hole do not have sufficient kinetic energy to ionize Se atoms and create an avalanche of electron-hole pairs. Because the electron and hole migrate in a nearly perfect orthogonal path to opposite ends of the detector, the MTF of a-Se at normal incidence is approximately unity for all frequencies.2 At higher incident angles, the MTF of a-Se decreases with frequency, but is expected to be superior to a turbid phosphor since there is no lateral spread of visible light. The analytical model of a-Se developed by Que and Rowlands1 can effectively be derived by using Eq. 2 for the source function but by eliminating Eq. 1 for the diffusion of secondary carriers.
To our knowledge, this paper is the first to investigate the angular dependence of the transfer functions of the back-screen configuration. The consistency of our back-screen model with expected trends at normal incidence helps to suggest its validity. For example, in accord with experimental data in turbid phosphors,20 we demonstrate that the back-screen has higher MTF than the front-screen. Because optical photons are predominately generated near the x-ray entrance surface of the phosphor, visible light exhibits less lateral spread before reaching the photocathode if the back-screen configuration is used.
Consistent with prior authors, this paper demonstrates that the Swank factor of the back-screen is greater than the front-screen. In experimental measurements on Gd2O2S:Tb phosphors at 20 keV, Trauernicht and Van Metter demonstrated that a back-screen has approximately 5% higher Swank factor than a comparable front-screen.24 Such a relative change in AS with screen configuration matches the results presented in Fig. 5. It is evident from Fig. 5 that the benefits of the back-screen over the front-screen should hold with higher incident angles.
DISCUSSION
This study develops an analytical model of the transfer functions of turbid phosphors for oblique x-ray incidence. The results of the model are consistent with prior observations on oblique incidence in a range of detector types. Having an analytical model of the transfer functions has in turn led to the development of optimization strategies for improving detector design in DBT.
One area for optimizing detector design is the choice of a front- or back-screen configuration. Although it is well known that the back-screen has greater MTF than the front-screen at normal incidence, back-screen transfer functions have not yet been analyzed for oblique incidence. In this work, it is suggested that the back-screen transfer functions should have much less angular dependence than the front-screen, and consequently, exhibit less variation with position along the detector. As a result, a back-screen configuration may be chosen to optimize the design of a phosphor for oblique incidence. Initially, this result would seem to have no practical impact, since back-screens are not currently used clinically due to the glass substrate of the thin-film transistor (TFT) array for digital signal readout.25, 27 If these detectors were operated as back-screens, the high attenuation of glass (∼0.7 mm thick) would prevent a large percentage of x-rays from reaching the phosphor itself,19 and hence both QDE and DQE would be compromised. Based on new research on flexible organic light-emitting diode (OLED) displays, however, TFT arrays may soon be manufactured on a plastic substrate.28, 34 Because plastic is much less attenuating than glass, operating such a detector in a back-screen configuration would not be prohibitive. Detectors manufactured with plastic have many benefits such as being bendable, light-weight, and easy to transport. These future phosphor-based detectors should preferentially be operated as back-screens in order to optimize detector performance for oblique incidence.
The analytical model of the transfer functions was ultimately used as a platform for optimizing the QDE of the detector for oblique incidence. This work provides a method for determining the QDE that maximizes DQE at any frequency of interest, such as the frequency of small microcalcifications or fine cancerous lesions within the breast. To our knowledge, this paper is the first to show that the optimal QDE is projection angle dependent in a front-screen, tending toward lower values (thinner phosphors) with increasing projection angle. Because the incident angle is greatest at the periphery of the detector opposite the chest wall, a corollary of this finding is that one beneficial design feature would be to reduce thickness at the edges and corners of the phosphor. Although it is beyond the scope of this paper to determine a single value for the optimum thickness at each point on a DBT detector, future work should be directed at modeling the transfer functions of the reconstruction35 and optimizing thickness to maximize the 3D DQE for a fixed frequency of interest. In experimental practice, the optimal thickness should be calculated on a case-by-case basis for each detector under consideration, taking into account the unique characteristics of the imaging system.
In this paper, it was demonstrated that the back-screen DQE is not optimized by a single QDE but instead attains reasonably high values over a broad range of phosphor thicknesses. Hence, the back-screen configuration has an important benefit over the front-screen configuration: future detectors with a plastic TFT substrate can be manufactured with very large thickness without degradation in high frequency DQE at any projection angle.
A discussion of the limitations of this paper and directions for future modeling are now noted. One assumption made in the Results section is that the incident x-ray beam is monoenergetic. Since the phosphor attenuation coefficient μ is energy-dependent, it is important to model polyenergetic x-ray spectra36, 37, 38 when studying the phosphor thickness which maximizes DQE in a front-screen (Fig. 11). Future work should be aimed at determining if the angular dependence of the optimal thickness becomes more or less pronounced upon varying the kVp and the target-filter combination. Since Fig. 11 was generated assuming a monoenergetic x-ray beam, the reader should take caution against directly applying the optimal thickness calculations to any real imaging system.
Although a relatively low energy (∼20 keV) is conventionally chosen to maximize contrast between glandular tissue and cancer,4, 5, 6 it would be useful to simulate higher energies found in dual energy contrast-enhanced DBT (DE CE-DBT).39, 40, 41, 42, 43, 44 In DE CE-DBT, low and high energy images are acquired below and above the K edge of iodine (33.2 keV) after iodinated contrast is injected into the blood stream,45, 46 and contrast uptake is determined using weighted logarithmic subtraction. Contrast uptake can be used to quantify blood flow at the site of a tumor, which exceeds healthy tissue.47
Another extension of this work would be to model detector pixilation due to the TFT array in which the phosphor is placed in optical contact.25, 26, 27 In this setting, the PSF is the convolution of the phosphor blurring function with the detector element sampling function.48, 49, 50 An additional subtlety that may be modeled is the blurring of the focal spot. The MTF of the focal spot is degraded with increasing focal spot size,51 as well as with increasing focal spot motion during a continuous DBT scan.35, 52 Our model can also be refined by taking into account detector lag and ghosting.53, 54, 55 In addition, one can incorporate the possibility for an NPS that is not quantum-limited but possesses outside noise sources.13
A final point of investigation would be to extend this work to a structured phosphor, such as CsI:Tl. In structured phosphors, needlelike crystals transmit the optical photons to the photocathode by total internal reflection to minimize the lateral spread of visible light. Structured phosphors have superior spatial resolution to nonstructured phosphors for this reason.19, 23 To model a structured phosphor, the boundary conditions for the secondary carrier currents would no longer be determined exclusively by the reflectivities of the backing and the photocathode. Instead, boundary conditions would also exist for the reflectivities of the walls of the needlelike crystals. Recently, Freed et al. have proposed an analytical model56, 57 of the PSF of CsI:Tl using a competing approach; their model was later generalized to direct-converting detectors.58 A key step in the derivation of their PSF formula is considering three different functional forms (Gaussian, exponential, Lorentzian) to quantify the spread of secondary carriers or electron-hole pairs at each depth of the detector material. Empirically, the authors find that the Lorentzian provides the best match to data generated from Monte Carlo simulations. The authors then determine optimal values for the parameters in their model by minimizing the normalized differences between the analytical technique and Monte Carlo simulations. Although useful in providing a closed form solution for the PSF, their model is limited in not being derived from first principles. By contrast, in our current work, all results are derived from first principles, and the value of each parameter has physical significance. It would be intriguing to determine whether our current paper could be generalized to model the boundary conditions of a structured phosphor and have agreement with Freed et al.
CONCLUSION
This work develops analytical models of OTF, NPS, and DQE for a turbid phosphor irradiated obliquely. Our analysis differs from much of the previous work on oblique incidence in that closed form solutions are obtained from first principles, thereby providing greater insight into the underlying detector physics.
Ultimately, the model provides a platform for optimizing the design of DBT detectors. For example, in a conventional front-screen configuration, the model is a useful tool for optimizing phosphor thickness at various angles of incidence. Because the incident angle is spatially variant across the detector area, the potential merit of designing a phosphor with reduced thickness near its periphery has been proposed.
This work demonstrates that the transfer functions of the back-screen have less angular dependence than the front-screen, and that high DQE is supported over a broader range of thicknesses for all incident angles. As a result, future DBT detectors manufactured on a plastic substrate instead of glass should preferentially be operated in the back-screen configuration.
ACKNOWLEDGMENTS
The authors thank Aldo Badano for a useful background discussion on the impact of oblique incidence on detector performance. The project described was supported by Grant No. T32EB009384 from the National Institute of Biomedical Imaging and Bioengineering (NIBIB). The content is solely the responsibility of the authors and does not necessarily represent the official views of the NIBIB or the National Institutes of Health. Additional support was provided by a pre-doctoral training Grant No. W81XWH-11-1-0100 through the Department of Defense Breast Cancer Research Program.
NOMENCLATURE
- ∂ =
partial derivative operator.
- ∇2 =
Laplacian operator.
- ∈ =
set membership.
- L =
Laplace transform operator.
- N =
set of natural numbers.
- α =
polar angle of the 2D spatial frequency vector ν.
- β =
a term defined by Eq. 21 to simplify intermediate calculations.
- γ± =
a term defined by Eq. 22 to simplify intermediate calculations.
- Δ =
nominal projection angle.
- δ =
delta function.
- θ =
angle of x-ray incidence relative to the normal to the detector.
- μ =
x-ray linear attenuation coefficient of the phosphor.
- ν =
spatial frequency vector with components νx and νy.
- ρj =
a quantity defined by Eq. 13 that is related to surface reflectivity. The subscripts j = 0, 1 correspond to the phosphor backing and photocathode, respectively.
- σ =
reciprocal of the mean diffusion length of optical photons.
- τ =
inverse relaxation length (the diffusion limit occurs with τ → ∞).
- φ(r) =
product of photon density and the diffusion constant.
- ψk(z) =
Fourier transform of φ(r) in a plane of constant z.
- AQ =
x-ray quantum detection efficiency.
- AQ0 =
x-ray quantum detection efficiency at normal incidence.
- AS =
Swank information factor.
- B =
back-screen configuration (often used as a subscript).
- C1, C2 =
constants of integration used in intermediate calculations.
- CE =
contrast-enhanced
- COR =
center-of-rotation of x-ray tube, corresponding to the midpoint of the chest wall side of the detector.
- D =
symbolic abbreviation for detective quantum efficiency.
- DBT =
digital breast tomosynthesis.
- DE =
dual energy
- DM =
digital mammography.
- DQE =
detective quantum efficiency.
- F =
front-screen configuration (often used as a subscript).
- FOV =
field-of-view.
- G(ν) =
optical transfer function found by summing the contributions of each depth z0 of the phosphor.
- G(ν, z0) =
optical transfer function associated with the depth 0 ≤ z0 ≤ T of the phosphor.
- h =
source-to-COR distance for rotating x-ray tube.
- i =
imaginary unit given as .
- j(z) =
photon currents across any plane of constant z.
- k =
a quantity equivalent to 2πν.
- MTF =
modulation transfer function.
- n =
iteration number for Newton’s Method.
- NPS =
noise power spectra.
- N(z0) =
relative x-ray signal at the depth z0 of the phosphor.
- OLED =
organic light-emitting diode.
- OTF =
optical transfer function.
- p =
independent variable of the Laplace transform of a function.
- PSF =
point spread function.
- q =
a quantity defined in Eq. 6 to simplify intermediate calculations.
- QDE =
quantum detection efficiency.
- rj =
reflectivity of a surface, where j = 0, 1 correspond to the phosphor backing and photocathode, respectively.
- RC(ν) =
Lubberts fraction.
- RN(ν) =
ratio of the quantum noise power to the total noise power.
- S(r) =
source function, modeled as point-like.
- T =
phosphor thickness.
- TFT =
thin-film transistor.
- W(ν) =
noise power spectra.
- x =
position along the chest wall side of the detector.
- y =
position perpendicular to the chest wall side of the detector.
- z0 =
depth within a phosphor (with or without the subscript).
References
- Que W. and Rowlands J. A., “X-ray imaging using amorphous selenium: Inherent spatial resolution,” Med. Phys. 22(4), 365–374 (1995). 10.1118/1.597471 [DOI] [PubMed] [Google Scholar]
- Lee D. L., Cheung L. K., Rodricks B., and Powell G. F., “Improved imaging performance of a 14 x 17-inch Direct Radiography (TM) System using Se/TFT detector,” SPIE Conference on Physics of Medical Imaging (SPIE, San Diego, CA, 1998), p. 14–23.
- Hajdok G. and Cunningham I. A., “Penalty on the Detective Quantum Efficiency from Off-Axis Incident X rays,” in Medical Imaging: Physics of Medical Imaging, edited by Yaffe M. J. and Flynn M. J.(SPIE, San Diego, 2004), pp. 109–118. [Google Scholar]
- Johns P. C. and Yaffe M. J., “X-ray Characterization of normal and neoplastic breast tissues,” Phys. Med. Biol. 32(6), 675–695 (1987). 10.1088/0031-9155/32/6/002 [DOI] [PubMed] [Google Scholar]
- Yaffe M. J., “Digital Mammography,” edited by Beutel J., Kundel H. L., and Metter R. L. V., Handbook of Medical Imaging, Physics and Psychophysics, (SPIE - The International Society for Optical Engineering, Bellingham, WA, 2000), Vol. 1, Chap. V, pp. 329–372. [Google Scholar]
- Bushberg J. T., Seibert J. A., Edwin M., Leidholdt J., and Boone J. M., “Mammography,” 2nd ed., The Essential Physics of Medical Imaging, edited by John J.-R., Snyder A., DeGeorge T. (Lippincott Williams; and Wilkins, Philadelphia, PA, 2002), Chap. VIII, pp. 191–229. [Google Scholar]
- Rafferty E. A., “Tomosynthesis: New weapon in breast cancer fight,” Decisions in Imaging Economics 17(4) (2004).
- Mainprize J. G., Bloomquist A. K., Kempston M. P., and Yaffe M. J., “Resolution at oblique incidence angles of a flat panel imager for breast tomosynthesis,” Med. Phys. 33(9), 3159–3164 (2006). 10.1118/1.2241994 [DOI] [PubMed] [Google Scholar]
- Swank R. K., “Calculation of modulation transfer functions of x-ray fluorescent screens,” Appl Opt. 12(8), 1865–1870 (1973). 10.1364/AO.12.001865 [DOI] [PubMed] [Google Scholar]
- Acciavatti R. J. and Maidment A. D. A., “Calculation of OTF, NPS, and DQE for Oblique X-Ray Incidence on Turbid Granular Phosphors,” Lect. Notes Comput. Sci. 6136, 436–443 (2010). [DOI] [PMC free article] [PubMed] [Google Scholar]
- Marshak R. E., Brooks H., H.Hurwitz, Jr., “Introduction to the theory of diffusion and slowing down of neutrons–I,” Nucleonics 4, 10–22 (1949). [PubMed] [Google Scholar]
- Nishikawa R. M. and Yaffe M. J., “Model of the spatial-frequency-dependent detective quantum efficiency of phosphor screens,” Med. Phys. 17(5), 894–904 (1990). 10.1118/1.596583 [DOI] [PubMed] [Google Scholar]
- Nishikawa R. M. and Yaffe M. J., “Effect of various noise sources on the detective quantum efficiency of phosphor screens,” Med. Phys. 17(5), 887–893 (1990). 10.1118/1.596572 [DOI] [PubMed] [Google Scholar]
- Lea S. M., “Generalized Functions in Physics,” Mathematics for Physicists, Brooks/Cole - Thomson Learning, Belmont, CA, 2004), Chap. VI, p. 287–322. [Google Scholar]
- Barrett H. H. and Myers K. J., “Series Expansions and Integral Transforms,” Foundations of Image Science, edited bySaleh B. E. A.(John Wiley & Sons, New York, 2004), Chap. IV, pp. 175–214. [Google Scholar]
- Lea S. M., “Laplace Transforms,” Mathematics for Physicists (Brooks/Cole - Thomson Learning, Belmont, CA, 2004) Chap. V, p. 251–286. [Google Scholar]
- Dainty J. C. and Shaw R., Chapter 6: Fourier Transforms, and the Analysis of Image Resolution and Noise. Image Science.Academic Press, London, England, 1974. p.190–231.
- Berger M. J., et al. , “XCOM: Photon Cross Section Database,” [cited 2010 December 30]; Available from: http://physics.nist.gov/xcom
- Rowlands J. A. and Yorkston J., “Flat Panel Detectors for Digital Radiography,” Handbook of Medical Imaging: Physics and Psychophysics, edited by Beutel J., Kundel H. L., Van Metter R. L. (SPIE - The International Society for Optical Engineering, Bellingham, WA, 2000), Vol. 1, Chap. IV, pp. 223–328. [Google Scholar]
- Kandarakis I., Cavouras D., Kanellopoulos E., Nomicos C. D., and Panayiotakis G. S., “Image quality evaluation of YVO4:Eu phosphor screens for use in x-ray medical imaging detectors,” Radiat. Meas. 29(5), 481–486 (1998). 10.1016/S1350-4487(98)00058-4 [DOI] [Google Scholar]
- Swank R. K., “Absorption and noise in x-ray phosphors,” J. Appl. Phys. 44(9), 4199–4203 (1973). 10.1063/1.1662918 [DOI] [Google Scholar]
- Badano A., Kyprianou I. S., and Sempau J., “Anisotropic imaging performance in indirect x-ray imaging detectors,” Med. Phys. 33(8), 2698–2713 (2006). 10.1118/1.2208925 [DOI] [PubMed] [Google Scholar]
- Samei E., “Image quality in two phosphor-based flat panel digital radiographic detectors,” Med. Phys. 30(7), 1747–1757 (2003). 10.1118/1.1578772 [DOI] [PubMed] [Google Scholar]
- Trauernicht D. P. and Metter R. V., “Conversion noise measurement for front and back x-ray intensifying screens,” SPIE, 1231, 262–270 (1990). 10.1117/12.18803 [DOI] [Google Scholar]
- Jing T., et al. , “Amorphous silicon pixel layers with cesium iodide converters for medical radiography,” IEEE Trans. Nucl. Sci. 41(4), 903–909 (1994). 10.1109/23.322829 [DOI] [Google Scholar]
- Cowen A. R., Kengyelics S. M., and Davies A. G., “Solid-state, flat-panel, digital radiography detectors and their physical imaging characteristics,” Clin. Radiol. 63, 487–498 (2008). 10.1016/j.crad.2007.10.014 [DOI] [PubMed] [Google Scholar]
- Nagarkar V. V., Gupta T. K., Miller S. R., Klugerman Y., Squillante M. R., Entine G., “Structured CsI(Tl) scintillators for x-ray imaging applications,” IEEE Trans. Nucl. Sci. 45(3), 492–496 (1998). 10.1109/23.682433 [DOI] [Google Scholar]
- He Y. and Kanicki J., “High-efficiency organic polymer light-emitting heterostructure devices on flexible plastic substrates,” Appl. Phys. Lett. 76(6), 661–663 (2000). 10.1063/1.125854 [DOI] [Google Scholar]
- Weaver M. S., et al. , “Organic light-emitting devices with extended operating lifetimes on plastic substrates,” Appl. Phys. Lett. 81(16), 2929–2931 (2002). 10.1063/1.1514831 [DOI] [Google Scholar]
- Sarma K. R., et al. , Active Matrix OLED Using 150C a-Si TFT Backplane Built on Flexible Plastic Substrate, edited by Hopper D., (SPIE, Orlando, FL, 2003), pp. 180–191. [Google Scholar]
- Sugimoto A., Ochi H., Fujimura S., Yoshida A., Miyadera T., and Tsuchida M., “Flexible OLED displays using plastic substrates,” IEEE J. Sel. Top. Quantum Electron. 10(1), 107–114 (2004). 10.1109/JSTQE.2004.824112 [DOI] [Google Scholar]
- Forrest S. R., “The path to ubiquitous and low-cost organic electronic appliances on plastic,” Nature (London) 428, 911–918 (2004). 10.1038/nature02498 [DOI] [PubMed] [Google Scholar]
- Nathan A., Kumar A., Sakariya K., Servati P., Sambandan S., and Striakhilev D., “Amorphous silicon thin film transistor circuit integration for organic LED displays on glass and plastic,” IEEE J. Solid-State Circuits 39(9), 1477–1486 (2004). 10.1109/JSSC.2004.829373 [DOI] [Google Scholar]
- Tsukagoshi K., Tanabe J., Yagi I., Shigeto K., Yanagisawa K., and Aoyagi Y., “Organic light-emitting diode driven by organic thin film transistor on plastic substrates,” J. Appl. Phys. 99(6), p. 064506 (2006). 10.1063/1.2184430 [DOI] [Google Scholar]
- Zhao B. and Zhao W., “Three-dimensional linear system analysis for breast tomosynthesis,” Med. Phys. 35(12), 5219–5132 (2008). 10.1118/1.2996014 [DOI] [PMC free article] [PubMed] [Google Scholar]
- Tucker D. M., Barnes G. T., and Chakraborty D. P., “Semiempirical model for generating tungsten target x-ray spectra,” Med. Phys. 18(2), 211–218 (1991). 10.1118/1.596709 [DOI] [PubMed] [Google Scholar]
- Boone J. M., Fewell T. R., and Jennings R. J., “Molybdenum, rhodium, and tungsten anode spectral models using interpolating polynomials with application to mammography,” Med. Phys. 24(12), 1863–1874 (1997). 10.1118/1.598100 [DOI] [PubMed] [Google Scholar]
- Blough M. M., Waggener R. G., Payne W. H., and Terry J. A., Calculated mammographic spectra confirmed with attenuation curves for molybdenum, rhodium, and tungsten targets. Medical Physics. 1998; 25(9):1605–12. [DOI] [PubMed] [Google Scholar]
- A.-Carton K., Li J., Chen S. C., Conant E. F., and Maidment A. D. A., “Optimization of contrast-enhanced digital breast tomosynthesis,” Lect. Notes Comput. Sci. 4046, 183–189 (2006). 10.1007/11783237_26 [DOI] [Google Scholar]
- Chen S. C., Carton A. K., Albert M., Conant E. F., Schnall M. D., and Maidment A. D. A., “Initial clinical experience with contrast-enhanced digital breast tomosynthesis,” Acad. Radiol. 14(2), 229–238 (2007). 10.1016/j.acra.2006.10.022 [DOI] [PMC free article] [PubMed] [Google Scholar]
- Carton A. K., Lindman K., Ullberg C., Francke T., Maidment A. D. A., “Dual-Energy ContrastEnhanced Digital Breast Tomosynthesis: Concept, Method and Evaluation on Phantoms,” Medical Imaging: Physics of Medical Imaging, edited by Hsieh J. and Flynn M. J. (SPIE, San Diego, CA, 2007), pp. 1–12. [Google Scholar]
- Puong S., Patoureaux F., Iordache R., Bouchevreau X., and Muller S., “Dual-Energy Contrast Enhanced Digital Breast Tomosynthesis: Concept, Method and Evaluation on Phantoms,” Medical Imaging: Physics of Medical Imaging, edited by Hsieh J. and Flynn M. J. (SPIE, San Diego, CA, 2007), pp. 1–12. [Google Scholar]
- Puong S., Bouchevreau X., Duchateau N., Iordache R., and Muller S., “Optimization of Beam Parameters and Iodine Quantification in Dual-Energy Contrast Enhanced Digital Breast Tomosynthesis,” Medical Imaging: Physics of Medical Imaging, edited by Hsieh J. and Samei E. (SPIE, San Diego, CA, 2008), pp. 1–11. [Google Scholar]
- Carton A. K., Gavenonis S. C., Currivan J. A., Conant E. F., Schnall M. D., Maidment A. D. A., “Dual-energy contrast-enhanced digital breast tomosynthesis—A feasibility study,” Br. J. Radiol. 83, 344–350 (2010). 10.1259/bjr/80279516 [DOI] [PMC free article] [PubMed] [Google Scholar]
- A.-Carton K., Ullberg C., Lindman K., Acciavatti R., Francke T., and Maidment A. D. A., “Optimization of a dual-energy contrast-enhanced technique for a photon-counting digital breast tomosynthesis system: I. A theoretical model,” Med. Phys. 37(11), 5896–5907 (2010). 10.1118/1.3490556 [DOI] [PMC free article] [PubMed] [Google Scholar]
- A.-Carton K., Ullberg C., and Maidment A. D. A., “Optimization of a dual-energy contrast-enhanced technique for a photon-counting digital breast tomosynthesis system: II. An experimental validation,” Med. Phys. 37 (11), 5908–5913 (2010). 10.1118/1.3488889 [DOI] [PMC free article] [PubMed] [Google Scholar]
- Weidner N., Semple J. P., Welch W. R., and Folkman J., “Tumor Angiogenesis and Metastasis—Correlation in invasive breast carcinoma,” N. Engl. J. Med. 324, 1–8 (1991). 10.1056/NEJM199101033240101 [DOI] [PubMed] [Google Scholar]
- Albert M. and Maidment A. D. A., “Linear response theory for detectors consisting of discrete arrays,” Med. Phys. 27(10), 2417–2434 (2000). 10.1118/1.1286592 [DOI] [PubMed] [Google Scholar]
- Acciavatti R. J. and Maidment A. D. A., “An Analytical Model of NPS and DQE Comparing Photon Counting and Energy Integrating Detectors,” Physics of Medical Imaging, edited by Samei E. and Pelc N. J. (SPIE, San Diego, CA, 2010), pp. 1–12. [DOI] [PMC free article] [PubMed] [Google Scholar]
- Acciavatti R. J. and Maidment A. D. A., A comparative analysis of OTF, NPS, and DQE in energy integrating and photon counting digital x-ray detectors,” Med. Phys. 37(12), 6480–6495 (2010). 10.1118/1.3505014 [DOI] [PMC free article] [PubMed] [Google Scholar]
- Johns H. E. and Cunningham J. R., Chapter 16: Diagnostic Radiology. The Physics of Radiology. 4th ed., Charles C Thomas, Springfield, IL, 1983. p.557–669. [Google Scholar]
- Ren B., Ruth C., Stein J., Smith A., Shaw I., and Jing Z., “Design and Performance of the Prototype Full Field Breast Tomosynthesis System WithSelenium Based Flat Panel Detector,” Medical Imaging: Physics of Medical Imaging, edited by Flynn M. J. (SPIE, San Diego, CA, 2005), pp. 550–561. [Google Scholar]
- Bloomquist A. K., Yaffe M. J., Mawdsley G. E., and Hunter D. M., “Lag and ghosting in a clinical flat-panel selenium digital mammography system,” Med. Phys. 33(8), 2998–3005 (2006). 10.1118/1.2218315 [DOI] [PubMed] [Google Scholar]
- Siewerdsen J. H. and Jaffray D. A., “A ghost story: Spatio-temporal response characteristics of an indirect-detection flat-panel imager,” Med. Phys. 26(8), 1624–1641 (1999). 10.1118/1.598657 [DOI] [PubMed] [Google Scholar]
- Zhao W., DeCrescenzo G., Kasap S. O., and Rowlands J. A., Ghosting caused by bulk charge trapping in direct conversion flat-panel detectors using amorphous selenium. Med. Phys. 32(2), 488–500 (2005). 10.1118/1.1843353 [DOI] [PubMed] [Google Scholar]
- Freed M., Park S., and Badano A., “A fast, angle-independent, analytical model of CsI detector response for optimization of 3D x-ray breast imaging systems,” Med. Phys. 37(6), 2593–2605 (2010). 10.1118/1.3397462 [DOI] [PMC free article] [PubMed] [Google Scholar]
- Freed M., Park S., and Badano A., “Erratum: “ A fast, angle-dependent, analytical model of CsI detector response for optimization of 3D x-ray breast imaging systems,” Med. Phys. 38(4), 2307 (2011). 10.1118/1.3397462 [DOI] [PMC free article] [PubMed] [Google Scholar]
- Badano A., Freed M., and Fang Y., “Oblique incidence effects in direct x-ray detectors: A first-order approximation using a physics-based analytical model,” Med. Phys. 38(4), 2095–2098 (2011) 10.1118/1.3567497 [DOI] [PubMed] [Google Scholar]


