

Abstract
Despite the importance of breaches of taste identity expectation for survival, its neural correlate is unknown. We used fMRI in 16 women to examine brain response to expected and unexpected receipt of sweet taste and tasteless/odorless solutions. During expected trials (70%), subjects heard “sweet” or “tasteless” and received the liquid indicated by the cue. During unexpected trials (30%), subjects heard sweet but received tasteless or they heard tasteless but received sweet. After delivery, subjects indicated stimulus identity by pressing a button. Reaction time was faster and more accurate after valid cuing, indicating that the cues altered expectancy as intended. Tasting unexpected versus expected stimuli resulted in greater deactivation in fusiform gyri, possibly reflecting greater suppression of visual object regions when orienting to, and identifying, an unexpected taste. Significantly greater activation to unexpected versus expected stimuli occurred in areas related to taste (thalamus, anterior insula), reward [ventral striatum (VS), orbitofrontal cortex], and attention [anterior cingulate cortex, inferior frontal gyrus, intraparietal sulcus (IPS)]. We also observed an interaction between stimulus and expectation in the anterior insula (primary taste cortex). Here response was greater for unexpected versus expected sweet compared with unexpected versus expected tasteless, indicating that this region is preferentially sensitive to breaches of taste expectation. Connectivity analyses confirmed that expectation enhanced network interactions, with IPS and VS influencing insular responses. We conclude that unexpected oral stimulation results in suppression of visual cortex and upregulation of sensory, attention, and reward regions to support orientation, identification, and learning about salient stimuli.
Introduction
Foods and drinks are generally identified by sight and smell before the decision to ingest is made. Consequently, we have a pretty good idea of what we expect to taste before doing so. Breaches of these taste expectations can then be very jarring, even if the unexpected sensation is rewarding under other circumstances. For example, one can imagine accidentally sipping a fine Chardonnay while expecting water. The sensation of the wine would be surprising and likely lead to the immediate halting of ingestion. Such a response, though negating the chance to savor fine Chardonnay, makes evolutionary sense because incorrect decisions to swallow can incur dire consequences.
Despite the importance of breaches of taste identity expectation for survival, its neural correlate is unknown. Several lines of evidence suggest the insular cortex should be involved. The anterior insula houses primary taste cortex and plays an important role in taste quality coding (Scott and Plata-Salaman, 1999; Katz et al., 2002; Accolla et al., 2007). Insular taste responses are also sensitive to expectation (Nitschke et al., 2006). A bitter stimulus is rated as less intense and produces less response when subjects expect that it corresponds to the weaker compared with the stronger of two bitter stimuli (Nitschke et al., 2006). Manipulating beliefs by providing information about more abstract attributes, such as price (Plassmann et al., 2008) or brand (McClure et al., 2004), affect medial orbitofrontal cortex (OFC) rather than insular cortex. However, in all of these examples, beliefs are manipulated and perception changes to align with expectation rather than to create a breach of expectation.
Although breaches of taste identity expectation have not been studied, breaches of taste temporal expectancy have been used to study reward learning. Pavlovian prediction learning is mediated by the difference between what is expected and what is received (Rescorla and Wagner, 1972; Wagner and Rescorla, 1972). A positive error signal is generated if the stimulus is greater, and a negative error signal is generated if the outcome is less than expected. Breaches of taste temporal expectancy, thought to reflect error signaling, influence responses in the ventral striatum (VS) and OFC, but not insula (Berns et al., 2001; Pagnoni et al., 2002; McClure et al., 2003; O'Doherty et al., 2003, 2006). Although the emphasis is on reward learning in these studies, breaches of expectation should generate not only an error signal, but also attentional reorienting, especially if the subject is engaged in a goal-directed behavior (Maunsell, 2004).
Here we set out to determine the neural correlates of breaches of taste identity expectations with fMRI. Subjects received sweet and tasteless solutions that were either preceded by valid or invalid verbal cues. We predicted enhanced response to unexpected compared with expected taste in insular taste cortex. We also hypothesized that breaches of taste identity expectation would recruit attentional and reward networks reflecting attentional deployment and generation of error signals, and that these signals would serve to drive insular taste responses and thereby enhance processing of unexpected taste.
Materials and Methods
Subjects.
Twenty-two female (also taking part in a larger study looking at menstrual cycle), right-handed, nonsmoking subjects (age, mean ± SD, 25.4 ± 6.1 years) with a mean Edinburgh Handedness Inventory score of 81 ± 16.7 (Oldfield, 1971) were recruited through advertisements around Yale University and the city of New Haven. Subjects had an average body mass index (BMI) of 25.2 ± 5.5 kg/m2 with a range of 19.1–38.7. All volunteers gave informed consent to participate in our study, which was approved by the Yale University School of Medicine Human Investigation Committee. Subjects were excluded if they had a known taste, smell, neurological, psychiatric, or other pathological disorder. Two of the original subjects were excluded because of excessive movement during scanning (exceeding 1 mm of movement in any direction in more than one of four runs) leaving 20 datasets for analyses (including three subjects that had one of four runs excluded because of excessive movement). Another four subjects were excluded based on poor performance of the detection task during scanning (described below). The remaining 16 female subjects were 25.1 ± 6.4 years old and had a mean Edinburgh Handedness Inventory score of 80.6 ± 16.4. The average BMI was 24.9 ± 5.7.
Taste stimuli and delivery.
The taste stimuli included a sweet sucrose solution (0.56 m) and a tasteless and odorless solution designed to mimic the ionic components of saliva (O'Doherty et al., 2001). We use the tasteless solution as the control stimulus since water activates taste cortex (Frey and Petrides, 1999; Zald and Pardo, 2000) and has a taste (Bartoshuk et al., 1964). Subjects were presented with four versions of the tasteless solution (2.5 mm sodium bicarbonate and 25 mm potassium chloride, plus three dilutions at 25, 50, and 75% of the original concentration) and asked to select the one that tasted most like nothing.
A custom-designed gustometer was used to deliver the liquid stimuli as 0.5 ml of solution over 3 s. This system has been successfully used in past fMRI studies (Veldhuizen et al., 2007; Small et al., 2008; Bender et al., 2009; Felsted et al., 2010). It consists of programmable syringe pumps holding syringes filled with taste solutions, connected to beverage tubes that pass from the control room to the scanner room and anchor into an fMRI-compatible, custom-designed gustatory manifold mounted on the MRI headcoil. Separate tubes anchor into separate channels within the manifold that converges over a plastic stylus at the bottom of the manifold. The subject's tongue rests under the stylus, and when the pump is triggered, the liquid bolus drips onto the end of the stylus and rolls off the surface to the tongue.
Experimental design.
Subjects first participated in a stimulus selection and fMRI training session. This session served to select an appropriate tasteless solution, familiarize subjects with the task, and identify subjects who found it uncomfortable to perform our task in a simulated fMRI environment.
Stimulus delivery occurred according to our long-event-related design depicted in detail in Figure 1A (Small et al., 2003, 2004). Subjects were instructed to hold the stimulus in their mouth until cued to swallow by a tone and to indicate whether or not a taste was present by pressing a button. Half of the subjects were instructed to press a button with their right hand when they detected the sucrose solution and another button with their left hand when they detected a tasteless solution. The other half of the subjects received instructions for the reversed hand-response assignment.
Figure 1.

Experimental design. A, Timeline of events within a trial. Events lasted 15–25 s with an average length of 20 s. Each event began with a 1 s vocal cue announcing either sweet or tasteless and a 2 s wait period, after which sucrose or tasteless solution was presented (0.5 ml over 3 s). Subjects were asked to indicate which solution they received by pressing a button on a button box as fast as they could during jitter 1 (various lengths that were randomized over trials). Then a 1 s swallow tone indicated that the subjects were allowed to swallow the liquid. After jitter 2 (various lengths that were randomized over trials), a new trial began. B, Graphical depiction of design. During training (left), all trials were valid (ExpSwt, validly cued sweet delivery; ExpTless, validly cued tasteless delivery). During the fMRI scanning, only 70% of the events were valid. The remaining 30% were invalid trials in which subjects heard tasteless but received sweet (UnSwt) or heard sweet and received tasteless (UnTless).
The fMRI paradigm conformed to a 2 × 2 factorial design with expectation (expected vs unexpected) and stimulus (tasteless or 0.56 m sucrose solution) as within-subject factors. During expected trials (70%), subjects heard either “sweet” or “tasteless” and received the liquid indicated by the verbal cue (ExpSwt or ExpTless). During unexpected trials (30%), subjects heard sweet but received tasteless (UnTless) or they heard tasteless but received sweet (UnSwt) (Fig. 1B).
During the fMRI training session, subjects underwent a single run in which all trials were valid. During actual scanning (on a separate day), subjects received both valid and invalid cues over four runs (each 712 s long and containing 35 events). There were 98 valid events (49 ExpSwt, 49 ExpTless) and 42 invalid events (21 UnSwt, 21 UnTless) across the four runs.
Subjects provided perceptual ratings of the stimuli before and after scanning. Pleasantness, edibility, wanting, and familiarity were rated using visual analog scales (VAS) [“How pleasant is this taste?” (Most unpleasant sensation ever = −100 mm, Neutral = 0, Most pleasant sensation ever = +100 mm), “How edible is this taste?” (Not edible at all = −100 mm, Neutral = 0, Very edible = +100 mm), “How much do you want to eat more of this?” (I would never want to eat this= −100 mm, Neutral = 0, I would want to eat this more than anything = +100 mm), “How familiar is this taste?” (Not familiar at all = −100 mm, Neutral = 0, Very familiar = +100 mm)]. The intensity, sweetness, saltiness, sourness and bitterness of the stimuli were evaluated on a cross-modal general Labeled Magnitude Scale (gLMS) (Green et al., 1996; Bartoshuk et al., 2006). This is a vertical line scale of 100 mm with the label “barely detectable” at the bottom anchor and the label “strongest imaginable sensation” at the top anchor. Between these labels, the following words were approximately logarithmically spaced: weak (6 mm), moderate (17 mm), strong (35 mm), and very strong (53 mm).
fMRI scanner.
Images were acquired on a 3 T Trio scanner (Siemens). Echo planar imaging was used to measure the blood oxygenation-level dependent (BOLD) signal as an indication of cerebral brain activation. A susceptibility-weighted, single-shot echo planar method was used to image the regional distribution of the BOLD signal with the following parameters: TR, 2000 ms; TE, 20 ms; flip angle, 90°; FOV, 220 mm; matrix, 64 × 64; slice thickness, 3 mm; number of slices, 40. Slices were acquired in an interleaved mode to reduce the cross talk of the slice selection pulse. At the beginning of each functional run, the MR signal was allowed to equilibrate over six scans (“dummy images”) for a total of 12 s, which were then excluded from analysis. The anatomical scan used a T1-weighted 3D FLASH sequence (TR/TE, 2530/3.66 ms; flip angle, 20°; FOV, 256; matrix, 256 × 256; slice thickness, 1 mm; number of slices, 176).
fMRI analysis.
Data were analyzed on Linux workstations using Matlab (MathWorks) and SPM5 (Wellcome Trust Centre for Neuroimaging, London, UK). Functional images were slice-time acquisition corrected using sinc interpolation to the slice obtained at 50% of the TR. All functional images were then realigned to the scan immediately preceding the anatomical T1 image. The images (anatomical and functional) were then normalized to the Montreal Neurological Institute template of gray matter, which approximates the anatomical space delineated by Talairach and Tournoux (1998). Images were then detrended, using a method for removing at each voxel any linear component matching the global signal (Macey et al., 2004). Functional images were smoothed with a 6 mm FWHM isotropic Gaussian kernel. For the time-series analysis on all subjects, a high-pass filter (128 s) was included in the filtering matrix (according to the convention in SPM5) to remove low-frequency noise and slow drifts in the signal. Condition-specific effects at each voxel were estimated using the general linear model. The response to events was modeled by a canonical hemodynamic response function included in SPM5. The temporal derivative of the hemodynamic response function was also included as part of the basis set to account for up to 1 s shifts in timing of the events (Henson et al., 2002). The events of interest were the four possible combinations of cue and stimulus (ExpSwt, ExpTless, UnSwt, UnTless), modeled as 3 s mini blocks (Fig. 1A). Cues and swallows were modeled as nuisance effects. No head movement regressors were included, as subjects with head movements beyond 1 mm were excluded from the analysis. Parameter estimate images from each subject, and for each of the four event types, were entered into a second-level analysis using full factorial ANOVA with expectation (expected or unexpected) and stimulus (tasteless or 0.56 m sucrose solution) as the two factors. T-maps of contrasts were thresholded for display at Puncorrected = 0.001, with a cluster size threshold of three voxels.
Voxels were considered significant at p < 0.05 corrected for multiple comparisons using the false discovery rate (FDR) across the whole brain for unpredicted peaks and across small volumes defined using coordinates from previous studies as the centroid of a 6 mm sphere for predicted peaks. We predicted greater response in the anterior insula for unexpected oral stimuli and used the peaks identified by Veldhuizen et al. (2007), Veldhuizen and Small (2011), and Bender et al. (2009) as centroids for volumes of interest. We also expected greater responses in the VS (McClure et al., 2003) and OFC for unexpected stimuli and used the peaks from McClure et al. (2003) and O'Doherty et al. (2003) to define these small volumes.
To examine expectancy-dependent changes in connectivity, we used psychophysiological interaction (PPI) analysis (Friston et al., 1997; Gitelman et al., 2003). Regions that showed a main effect of unexpected versus expected at the group level were used as seed regions. The first eigenvariate of the time-series data was extracted from a 6 mm sphere with a centroid of each subjects' peak voxel. Subject-specific peak voxels were determined by searching each individual subject's contrast of [UnSwt + UnTless] − [ExpSwt + ExpTless] (displayed at p < 0.1) for a peak within 6 mm of the group activation maxima shown in Table 2. The eigenvariate was then deconvolved (Gitelman et al., 2003), multiplied with the psychological variable (unexpected − expected) and reconvolved with a hemodynamic response function to form the psychophysiological interaction term. For each subject, we computed new PPI parameter estimate images with the interaction as a regressor of interest and the time-series eigenvariate and psychological variable as nuisance regressors. These images were then entered into a one-way ANOVA group analysis to examine which areas display increased connectivity with the seed regions under the unexpected condition compared with the expected condition. To isolate areas that also showed a main effect of unexpected–expected (from the main analysis described above), we saved a mask from the main analysis (thresholded at Puncorrected = 0.001, with a cluster size threshold of three voxels). We then used this image as an inclusive mask in the PPI group analysis. T-maps were thresholded for display at Puncorrected = 0.001, with a cluster size threshold of three voxels. Peaks were considered significant at p < 0.05 FDR corrected across voxels in the inclusive mask.
Table 2.
Significant peaks of [UnSwt + UnTless] − [ExpSwt + ExpTless]
| Area | x, y, z MNIa | Kb | Z | PFDRc |
|---|---|---|---|---|
| Left anterior insula | −36, 18, 0 | 195 | 5.39 | 0.001 |
| −33, 12, −6 | 4.75 | 0.002 | ||
| −33, 30, 6 | 3.87 | 0.013 | ||
| Right anterior insula | 33, 21, −3 | 99 | 5.30 | 0.001 |
| Right inferior frontal gyrus | 48, 21, 24 | 164 | 4.93 | 0.001 |
| 48, 30, 24 | 4.79 | 0.002 | ||
| 42, 0, 30 | 4.18 | 0.007 | ||
| Anterior cingulate cortex | −6, 24, 39 | 334 | 4.81 | 0.001 |
| 6, 36, 51 | 4.30 | 0.005 | ||
| 9, 36, 9 | 4.29 | 0.005 | ||
| Medial superior frontal gyrus | 15, 42, 39 | 14 | 4.51 | 0.003 |
| Left VS | −6, −9, 6 | 70 | 4.08 | 0.008 |
| −12, 3, 3 | 3.99 | 0.010 | ||
| 3, −12, 3 | 3.55 | 0.025 | ||
| Right middle frontal gyrus | 42, 3, 45 | 9 | 3.94 | 0.012 |
| Right VS | 12, 6, 6 | 22 | 3.93 | 0.012 |
| Right middle frontal gyrus | 42, 30, 39 | 7 | 3.78 | 0.017 |
| Left inferior frontal sulcus | −27, 45, 15 | 10 | 3.77 | 0.017 |
| Right IPS | 48, −51, 45 | 6 | 3.73 | 0.019 |
| Anterior cingulate cortex (at genu) | −6, 36, 3 | 7 | 3.73 | 0.019 |
| Right middle temporal gyrus | 57, −30, −9 | 21 | 3.71 | 0.019 |
| 66, −33, −9 | 3.65 | 0.022 | ||
| Left thalamus (ventroposteromedial) | −6, −24, 0 | 30 | 3.71 | 0.019 |
| Right thalamus | 3, −15, −6 | 3.67 | 0.021 | |
| Right thalamus | 6, −24, 0 | 3.36 | 0.036 | |
| Posterior cingulate cortex | 9, −66, 39 | 8 | 3.70 | 0.020 |
| Left lateral orbital gyrus | −45, 42, −3 | 10 | 3.68 | 0.021 |
| Anterior cingulate cortex | −6, 6, 63 | 5 | 3.42 | 0.032 |
| Left inferior frontal gyrus | −48, 18, 21 | 11 | 3.42 | 0.032 |
aItalics indicate that a peak falls under the same cluster as the preceding peak.
bCluster size in voxels.
cSignificant at PFDRcorrected = 0.05 across the whole brain.
Finally, we used the dynamic causal modeling (DCM; version 10) tool in SPM8 (Wellcome Trust Centre for Neuroimaging) to determine whether responses in the most significantly activated reward (VS) and attentional [intraparietal sulcus (IPS)] regions modulate sensory cortex in parallel or independently (Friston et al., 2003). As opposed to PPI, which only examines the connectivity from single-source regions, DCM allows the examination and comparison of multiple network models containing multiple prespecified source regions. DCM requires the specification of intrinsic connectivity between the chosen regions (i.e., “steady-state” connectivity) and driving inputs into at least one region to cause network activity. Additional modulatory inputs affect the strength of the intrinsic coupling in a context-sensitive manner. Models were compared using Bayesian Model Selection (Stephan et al., 2009; Penny et al., 2010). Further details of the DCM models and model comparison are specified below.
Results
Behavioral
Perceptual ratings
Perceptual ratings taken before and after training and before and after scanning were analyzed. Because of technical difficulties, we could not collect data for one subject, leaving a total of 15 datasets for perceptual analysis. We performed a 2 (stimulus: sweet vs tasteless) × 2 (session: training vs scan) × 2 (time: before vs after session) within-subjects multivariate ANOVA (MANOVA) on pleasantness, intensity, sweetness, sourness, saltiness, bitterness, edibility, familiarity, and wanting ratings in SPSS for Windows (release 16.0.0; SPSS Inc.), in which we evaluated whether these characteristics differed across the stimuli, session, and time. We used an α of 0.05 to determine significance of each factor on the perceptual ratings. We report significant multivariate and univariate effects only. Post hoc t tests were used to further probe significant interaction effects.
We observed a significant multivariate effect for the taste factor (F(9,6) = 10.558; p = 0.005). Inspection of the univariate effects for this factor showed that the sweet stimulus was experienced as more intense (F(1,14) = 45.456; p < 0.001) and sweet (F(1,14) = 66.746; p < 0.001) and trended toward being more pleasant (F(1,14) = 3.23; p = 0.094) and edible (F(1,14) = 3.99; p = 0.066) than the tasteless stimulus (Fig. 2). We observed a main effect of time on edibility ratings (F(1,14) = 14.574; p = 0.002) with both stimuli rated as less edible after the sessions. We also observed a significant interaction of time and session on wanting ratings (F(1,14) = 8.060; p = 0.013), such that before the scanning session, the solutions were wanted more than after the scanning session (p = 0.015). No other main or interaction effects were observed. The results from this analysis suggest that perception was similar when all trials were valid (training run) compared with when expectation was occasionally breached (no effects of session). We did not collect perceptual ratings during training or scanning because perceptual evaluation influences brain response to taste (Bender et al., 2009) and we wanted to keep our subjects focused on the target detection task. Therefore, we do not have data on the influence of expectation on perception. Rather, task performance was evaluated by analyzing reaction times and accuracy.
Figure 2.

Intensity and pleasantness ratings of the four different events of interest. We plotted mean pleasantness, edibility, wanting, and familiarity (rated on a VAS) and intensity, sweetness, saltiness, sourness, and bitterness (rated on a gLMS) ratings (averaged over subjects, ±SEM) against time and session (x-axis). BT, Before training; AT, after training; BS, before scan; AS, after scan. Dark gray bars, Sweet stimuli; light gray bars, tasteless stimuli. Sweet stimuli are perceived to be significantly more intense and sweet (*p < 0.05), and a trend for sweet is perceived to be rated as more edible and pleasant (+p < 0.1). Edibility ratings were lower before the sessions than after the sessions (*p < 0.05). There was a significant decrease in wanting of either stimulus before compared with after the scanning session (*p < 0.05).
Detection task performance
Detection speed and accuracy were assessed for the four different events during the fMRI scan. Response time was defined as the time in milliseconds that elapsed between the arrival of the stimulus at the outflow point of the mouthpiece and the time the subject pressed a button. Accuracy was defined as the proportion correct responses regardless of the preceding cue. We conducted a 2 (expectancy) × 2 (stimulus) within-subjects MANOVA in SPSS on response times and the proportion correct responses. We used an α of 0.05 to determine significance of each factor on both measures of performance.
Initial inspection of individual datasets revealed that four of the subjects did not perform the task according to the instructions, responding by pressing the button according to the cue (hear sweet and press button for sweet or hear tasteless and press button for tasteless) rather than according to what oral stimulus they received, as evidenced by a 1% accuracy on the unexpected trials and perfect accuracy on expected trials (100%) and uncharacteristically fast response times (of 764 ± 182 ms relative to oral stimulus onset). Consequently, we did not include these datasets in further behavioral or neuroimaging analyses (leaving 16 datasets). The average accuracy for the remaining 16 subjects was 93 ± 8% (across both expected and unexpected trials), and their average reaction time was 2799 ± 1601 ms, which is consistent with published reports of taste detection response times (Bonnet et al., 1999; Veldhuizen et al., 2010). Analyses of the reaction times revealed a main effect of expectancy on response times (F(1,15) = 25.710; p < 0.001), with subjects responding faster to validly cued stimuli (Fig. 3, top). No main effect of stimulus was observed (F(1,15) = 0.006; p = 0.942), nor an interaction between expectancy and stimulus (F(1,15) = 0.680; p = 0.422).
Figure 3.
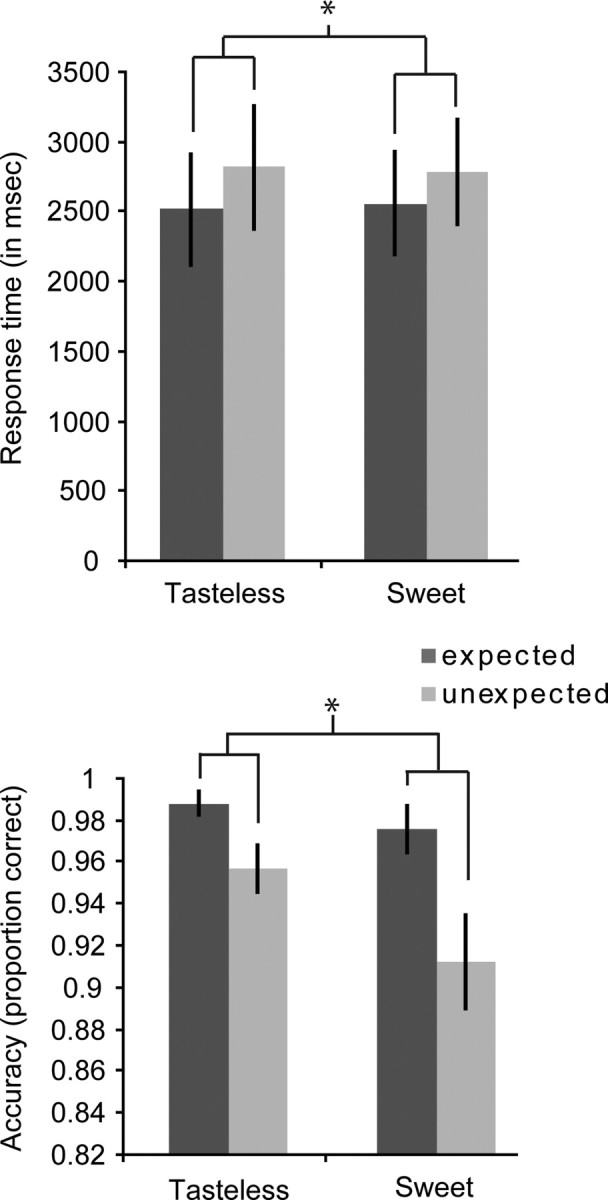
Response times and proportion correct responses of the four different events of interest. We plotted response times (in milliseconds) and proportion correct responses, respectively (averaged over subjects, ±SEM), against stimulus (x-axis). Dark gray bars, Expected events; light gray bars, unexpected events. Expected events were responded to faster and more accurately (*p < 0.05).
A main effect of expectancy was also observed on accuracy, with subjects significantly more accurate in correctly detecting the stimulus after a valid cue (F(1,15) = 10.625; p = 0.005) (Fig. 3, bottom). We observed a trend for an effect of stimulus (F(1,15) = 3.717; p = 0.073); subjects are slightly more accurate in detecting the presence of a taste in the solution than they are at identifying the absence of a taste in the tasteless solution. We did not observe a significant interaction effect of expectancy and stimulus on accuracy (F(1,15) = 1.734; p = 0.208).
fMRI data
Main effect of expectation: regions responding preferentially when expectation is met
To determine which regions respond preferentially to expected versus unexpected stimuli, we compared the average response to the expected stimuli with the averaged response to the unexpected stimuli ([ExpSwt + ExpTless] − [UnSwt + UnTless]). This yielded bilateral whole-brain corrected responses in the fusiform gyrus, reflecting greater deactivation to receipt of unexpected compared with expected oral stimuli (Fig. 4, Table 1).
Figure 4.

Neural response to expected versus unexpected events. Sagittal sections show neural response to expected versus unexpected oral stimuli ([ExpSwt + ExpTless] − [UnSwt + UnTless]) in bilateral fusiform gyrus. The bar graphs show (on the y-axis) the percentage signal change for the expected (dark gray bars) and unexpected (light gray bars) events (±SEM), averaged over subjects. Stimuli are shown on the x-axis. The response was taken from the voxel that responded maximally within the significant cluster, as identified in the SPM analysis. The color bar depicts T values.
Table 1.
Significant peaks of [ExpSwt + ExpTless] − [UnSwt + UnTless]
| Area | x, y, z MNIa | Kb | Z | PFDRc |
|---|---|---|---|---|
| Left fusiform gyrus | −33, −75, −3 | 174 | 4.89 | 0.018 |
| −30, −84, 6 | 4.41 | 0.027 | ||
| −45, −72, −3 | 4.08 | 0.069 | ||
| Right fusiform gyrus | 39, −45, −21 | 104 | 4.63 | 0.023 |
| 48, −57, −15 | 4.18 | 0.049 | ||
| 48, −54, −6 | 3.80 | 0.086 |
aItalics indicate that a peak falls under the same cluster as the preceding peak.
bCluster size in voxels.
cSignificant at PFDRcorrected = 0.05 across the whole brain.
Main effect of expectation: regions responding preferentially when expectation is breached
To determine which regions responded preferentially to the unexpected versus the expected stimuli, we compared the average response to the unexpected stimuli with the averaged response to the expected stimuli ([UnSwt + UnTless] − [ExpSwt + ExpTless]). This resulted in widespread activation in gustatory, reward, and attention networks. More specifically, significant effects were observed in the gustatory sensory pathway (ventroposteromedial thalamus, anterior insula) (Pritchard et al., 1986; Small, 2006), in limbic regions important in the generation of error signals (anterior OFC, VS) (Tremblay and Schultz, 1999, 2000; Schultz et al., 2000; O'Doherty et al., 2003), and in the attention network (inferior frontal gyrus, anterior cingulate cortex, IPS, far anterior dorsal insula) (Nobre et al., 1999; Kanwisher and Wojciulik, 2000; Nobre, 2001; Corbetta and Shulman, 2002; Mesulam et al., 2005; Craig, 2009; Small, 2010) (Fig. 5, Table 2).
Figure 5.
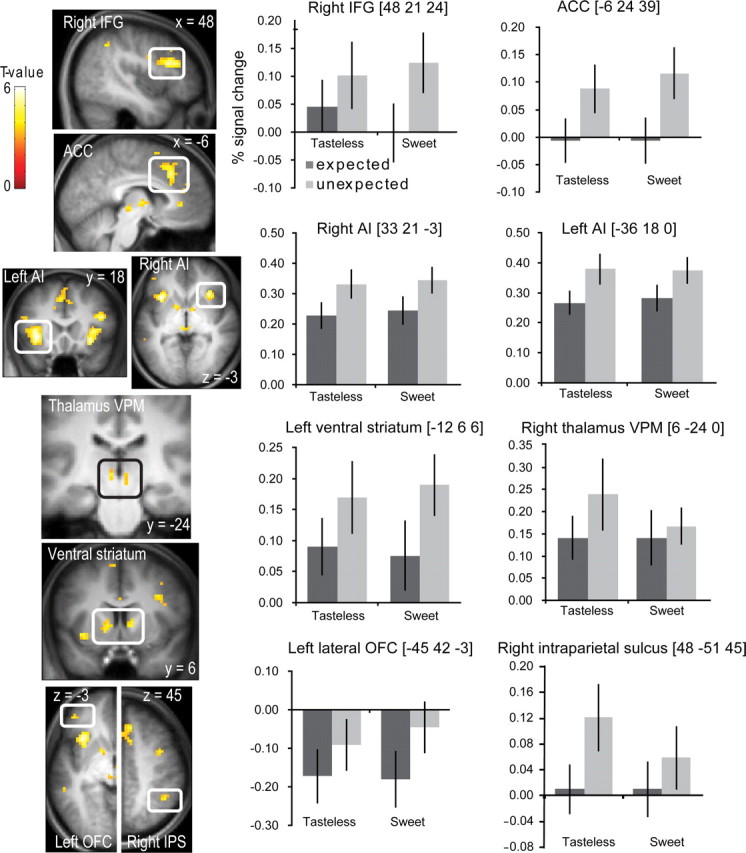
Neural response to unexpected versus expected events. Sections show neural response to unexpected versus expected oral stimuli ([UnSwt + UnTless] − [ExpSwt + ExpTless]) in right inferior frontal gyrus (IFG), anterior cingulate cortex (ACC), bilateral anterior insula (AI), bilateral ventroposteromedial (VPM), thalamus, bilateral VS, left OFC, and right IPS. The bar graphs show (on the y-axis) the percentage signal change for the expected (dark gray bars) and unexpected (light gray bars) events (±SEM), averaged over subjects. Stimuli are shown on the x-axis. The response was taken from the voxel that responded maximally within the significant cluster, as identified in the SPM analysis. The color bar depicts T values.
Interactions between expectation and stimulus
To isolate responses where breaches of expectation occurred preferentially for the sweet taste compared with the control stimulus, we performed the double subtraction ([UnSwt − ExpSwt] − [UnTless − ExpTless]). This resulted in a significant peak in a region of right dorsal anterior insula corresponding to human primary taste cortex as well as a weaker nonsignificant activation in the same area of the left hemisphere (Small, 2010) (Fig. 6, Table 3). No significant effects were observed for the opposite direction (greater effects of expectation on tasteless vs taste). We also examined effects of expectation separately for the two stimuli (sweet and tasteless). UnSwt − ExpSwt produced significant activation in the insula, cingulate cortex, intraparietal sulcus, and inferior frontal gyrus. Ventral striatal activation was observed when the threshold was lowered to p < 0.005, uncorrected (Table 4). UnTless − ExpTless produced significant responses in the insular cortex; however, activation in the cingulate, inferior frontal gyrus, and VS emerged at a lower threshold (p < 0.005, uncorrected) (Table 5).
Figure 6.

Neural response to unexpectedly receiving a sweet stimulus compared with unexpectedly receiving a tasteless solution. A sagittal section shows neural response in right dorsal AI to unexpectedly receiving a sweet stimulus specifically ([UnSwt − ExpSwt] − [UnTless − ExpTless]). The bar graphs show (on the y-axis) the percentage signal change for the expected (dark gray bars) and unexpected (light gray bars) events (±SEM), averaged over subjects. Stimuli are shown on the x-axis. The response was taken from the voxel that responded maximally within the significant cluster, as identified in the SPM analysis. The color bar depicts T values.
Table 3.
Significant peaks of [UnSwt − ExpSwt] − [UnTless − ExpTless]
| Area | x, y, z MNIa | Kb | Z | PFDRc |
|---|---|---|---|---|
| Right dorsal anterior insula | 30, 21, 18 | 16 | 3.42 | 0.024 |
| 39, 18, 18 | 3.42 | 0.026 | ||
| Left dorsal anterior insula | −27, 21, 18 | 4 | 2.93 | n.s. |
aItalics indicate that a peak falls under the same cluster as the preceding peak.
bCluster size in voxels.
cSignificant at PFDRcorrected = 0.05 across the regions of interest.
Table 4.
Significant peaks of UnSwt − ExpSwt
| Area | x, y, z MNIa | Kb | Z | PFDR |
|---|---|---|---|---|
| Right inferior frontal gyrus | 48, 30, 24 | 123 | 4.94 | 0.022c |
| 48, 21, 30 | 4.54 | 0.038c | ||
| 39, 18, 18 | 3.95 | 0.044c | ||
| Left anterior calcarine sulcus | −33, −69, 9 | 7 | 4.25 | 0.042c |
| Right IPS | 51, −48, 42 | 31 | 4.22 | 0.042c |
| Left inferior frontal gyrus | −45, 15, 21 | 13 | 4.19 | 0.042c |
| Anterior cingulate cortex | 0 3 30 | 17 | 4.18 | 0.042c |
| Anterior cingulate cortex | −9, 21, 36 | 61 | 4.17 | 0.042c |
| Left ventral insula | −42, −9, −6 | 12 | 4.13 | 0.042c |
| Left inferior frontal sulcus | −27, 45, 15 | 23 | 4.09 | 0.042c |
| Anterior cingulate cortex | 6, 27, 18 | 17 | 4.09 | 0.042c |
| Anterior cingulate cortex | 6, 45, 39 | 9 | 3.95 | 0.044c |
| Right ventral insula | 33, 21, −6 | 17 | 3.77 | 0.010d |
| 33, 9, −9 | 0.002d | |||
| Left anterior insula | −33, 18, 0 | 8 | 3.57 | 0.003d |
| Left ventral insula | −33, 9, −6 | 7 | 3.56 | 0.006d |
| Right anterior insula | 33, 27, 3 | 13 | 3.54 | 0.003d |
| 36, 18, 6 | 3.24 | 0.003d | ||
| Left ventral insula | −42, −9, −6 | 26 | 4.13 | 0.042c |
| Left inferior frontal sulcus | −27, 45, 15 | 47 | 4.09 | 0.042c |
| 6, 27, 18 | 47 | 4.09 | 0.042c | |
| Anterior cingulate cortex | 48, −27, −9 | 32 | 3.79 | n.s. |
| 54, −33, −6 | 2.97 | n.s. | ||
| Superior colliculus | 0, −39, −9 | 14 | 3.60 | n.s. |
| Mediodorsal thalamus | 0, −12, 3 | 32 | 3.44 | n.s. |
| −15, −12, 9 | 3.02 | n.s. | ||
| 0, −21, 3 | 2.94 | n.s. | ||
| Left anterior orbital gyrus | −33, 48, −9 | 6 | 3.40 | n.s. |
| Left anterior orbital gyrus | −21, 57, −3 | 5 | 3.40 | n.s. |
| Right ventral/dorsal striatum | 12, 9, 9 | 18 | 3.36 | n.s. |
| 18, 0, 6 | 2.91 | n.s. | ||
| 12 3 15 | 2.72 | n.s. | ||
| Posterior cingulate sulcus | 9, −66, 39 | 16 | 3.34 | n.s. |
| 9, −78, 36 | 3.04 | n.s. | ||
| Medial geniculate body | −9, −27, −12 | 6 | 3.28 | n.s. |
| 63, −33, −18 | 5 | 3.22 | n.s. | |
| Left anterior insula | −36, 30, 6 | 9 | 3.21 | n.s. |
| Left limen insula | −27, 12, −18 | 5 | 3.17 | n.s. |
| Right anterior orbital gyrus | 24, 48, −9 | 6 | 3.17 | n.s. |
| Left IPS | −51, −45, 48 | 5 | 3.14 | n.s. |
| Precuneus | 15, −72, 21 | 5 | 3.11 | n.s. |
| Left inferior frontal gyrus | −51, 36, 15 | 10 | 3.09 | n.s. |
| Left lateral orbitofrontal gyrus | 48, 36, −12 | 6 | 3.07 | n.s. |
| Cerebellum | −9, −75, −33 | 10 | 3.04 | n.s. |
| Left IPS | −24, −63, 39 | 15 | 2.99 | n.s. |
| Pulvinar | 12, −33, 9 | 5 | 2.91 | n.s. |
| Anterior cingulate cortex | 6, −21, 36 | 7 | 2.87 | n.s. |
| VS | −12, 3, 6 | 5 | 2.83 | n.s. |
aItalics indicate that a peak falls under the same cluster as the preceding peak.
bCluster size in voxels.
cSignificant at PFDRcorrected = 0.05 across the whole brain.
dSignificant at PFDRcorrected = 0.05 across the regions of interest.
Table 5.
Significant peaks of UnTless − ExpTless
| Area | x, y, z MNIa | Kb | Z | PFDR |
|---|---|---|---|---|
| Left anterior insula | −36, 18, −6 | 44 | 4.47 | 0.033c |
| Right anterior insula | 33, 21, 0 | 13 | 3.9 | 0.033c |
| Superior frontal gyrus | −9, 6, 63 | 48 | 4.48 | n.s. |
| 0, 12, 57 | 2.93 | n.s. | ||
| Left superior frontal sulcus | −24, −6, 60 | 53 | 4.25 | n.s. |
| −18, −12, 57 | 3.95 | n.s. | ||
| −30, 0, 66 | 2.64 | n.s. | ||
| Right middle temporal gyrus | 66, −30, −6 | 69 | 4.06 | n.s. |
| 66, −39, 3 | 3.45 | n.s. | ||
| 72, −36, −6 | 3.27 | n.s. | ||
| Substantia nigra | 9, −15, −9 | 37 | 3.95 | n.s. |
| Mediodorsal thalamus | 12, −12, 6 | 37 | 3.81 | n.s. |
| 6, −3, 3 | 3.08 | n.s. | ||
| Superior frontal gyrus | 18, −6, 69 | 7 | 3.76 | n.s. |
| Right cerebellum | 18, −66, −30 | 29 | 3.76 | n.s. |
| 9, −69, −24 | 3.48 | n.s. | ||
| Superior frontal gyrus | 6, 36, 51 | 21 | 3.73 | n.s. |
| 0, 42, 45 | 2.78 | n.s. | ||
| Superior precentral sulcus | −39, 0, 42 | 44 | 3.51 | n.s. |
| Left cerebellum | −21, −63, −33 | 7 | 3.48 | n.s. |
| Substantia nigra | −6, −21, −9 | 8 | 3.47 | n.s. |
| Left middle temporal gyrus | −54, −33, −12 | 10 | 3.43 | n.s. |
| Superior frontal gyrus | −12, −24, 69 | 5 | 3.41 | n.s. |
| Inferior frontal sulcus | −54, 21, 15 | 12 | 3.36 | n.s. |
| Anterior cingulate cortex | 9, 27, 30 | 16 | 3.24 | n.s. |
| Anterior cingulate cortex | −6, 33, 3 | 11 | 3.21 | n.s. |
| Cerebellum | −9, −69, −27 | 6 | 3.19 | n.s. |
| Pulvinar | 15, −36, 0 | 5 | 3.18 | n.s. |
| Right inferior frontal gyrus | 45, 18, 24 | 6 | 3.13 | n.s. |
| Superior frontal gyrus | −15, 12, 48 | 5 | 3.08 | n.s. |
| Middle frontal gyrus | 54, −3, 42 | 7 | 3.06 | n.s. |
| Superior temporal gyrus | 51, −45, 9 | 5 | 3.00 | n.s. |
| −9, −3, 6 | 6 | 2.96 | n.s. | |
| Left VS | −15, 3, −3 | 14 | 2.90 | n.s. |
| Cerebellum | 33, −60, −30 | 5 | 2.86 | n.s. |
| Cuneus | 15, −87, 9 | 5 | 2.85 | n.s. |
| Anterior cingulate cortex | 9, 36, 3 | 6 | 2.85 | n.s. |
| Left inferior frontal gyrus | 51, 12, 24 | 5 | 2.77 | n.s. |
aItalics indicate that a peak falls under the same cluster as the preceding peak.
bCluster size in voxels.
cSignificant at PFDRcorrected = 0.05 across the regions of interest.
Connectivity
We observed greater responses to unexpected versus expected oral stimulation in sensory, reward, and attention regions. We hypothesized that the attention and reward networks might modulate incoming sensory signals to maximize information processing, with top-down modulation of incoming sensory signals from the attention system serving goal-directed behavior (discrimination task) and modulation of incoming sensory signals by the reward system enhancing information processing of biologically relevant sensations. To test this prediction, we performed PPI analyses with the peaks from inferior frontal gyrus, anterior cingulate cortex, IPS, anterior OFC, and VS. We observed greater connectivity between right IPS and left anterior insula ([−33, 12, 9], Z = 3.81, PFDR = 0.015), between left VS and left anterior insula ([−33, 21, 3], Z = 3.31, PFDR = 0.023), and between right VS and bilateral anterior insula ([−33, 21, 3], Z = 3.75, PFDR = 0.016; [36, 21, −6], Z = 3.40, PFDR = 0.016) under unexpected compared with expected oral stimulation (Fig. 7). We also performed PPI analyses with peaks from anterior insula. Expectation did not influence connectivity between this region and VS or IPS.
Figure 7.

Psychophysiological interaction results. Regression of activity in anterior insula (AI) on the activity in the seed regions IPS and VS when the oral stimulus was unexpected (light gray circles and solid gray line) versus expected (dark gray triangles and dashed dark line). Each observation corresponds to the time series interaction with that condition. The section by the x-axis shows the location of the seed region, and the section by the y-axis shows the neural response in anterior insula that was significantly associated with a stronger connectivity under unexpected versus expected with the seed region. The color bar depicts T values. au, Arbitrary units.
The PPI analysis confirmed that expectation modulates connectivity between the IPS, VS, and anterior insula. Next, to determine the direction of the influences and interactions between these regions, we used DCM to test all possible models of information flow through this network. Based on the (across-hemisphere) regions identified in the PPI analysis, we specified an across-hemisphere network of the following regions: right IPS, right VS, and left anterior insula. Taste and tasteless events (collapsed across expectancy) were used as driving inputs, and entered all models through the anterior insula (Fig. 8A). All models were specified to have bidirectional steady-state connectivity (intrinsic connections) between all three areas, except between the VS and parietal cortex as connections from the striatum to the cortex must pass through the pallidum and thalamus, which were not included in the model (Fig. 8A). Responses from unexpected and expected events (collapsed across stimulus) were used as modulatory inputs on each of the intrinsic connections to create all possible models (31). The five connections that we varied the modulatory influences for were as follows: (1) the connection from IPS to VS; (2) from IPS to anterior insula; (3) from VS to anterior insula; (4) from anterior insula to IPS; and (5) from anterior insula to VS. We used fixed-effects Bayesian model selection to compare all models using the free energy approximation to the log evidence for each model (Stephan et al., 2009). The free energy formulation contains terms for both model accuracy and complexity (Stephan et al., 2009). Thus, more complex models are not necessarily better. The log model evidence is also used to compute the conditional probability for each model across all 31 models. A fixed-effects analysis assumes that all subjects are using the same model architecture. This assumption is considered to be appropriate when the subjects are relatively homogenous (ours were all young women) and the processes being studied are basic physiologic or attentional mechanisms that are unlikely to vary across the subject group (Penny et al., 2010; Stephan et al., 2010; Desseilles et al., 2011). Bayesian model selection demonstrated that there was significant evidence (posterior probability, 0.954) in favor of model 19 (modulation of parietal to insula, VS to insula, and insula to VS) (Fig. 8B,C). Thus, these results support our hypothesis that both parietal cortex and VS influence response in the anterior insula, reflecting modulation of sensory inputs by attentional and reward networks, respectively. However, they also indicate that insular responses modulate VS, which may reflect the interaction between sensory and reward processing.
Figure 8.

DCM models and model evidence. A, Invariable configuration of all network models. Taste and tasteless events (collapsed across expectancy) were used as driving inputs into the anterior insula (AI), and all models were specified to have full steady-state connectivity between the nodes in the network. B, Exceedance probabilities of all 31 possible models. The exceedance probability is the probability that a model is more likely than any of the other models given the observed fMRI data. Exceedance probabilities showed significant evidence in favor of model 19. C, Configuration of model 19. For model 19, modulation of AI by VS and IPS and modulation of VS by AI was specified. Average estimates (arbitrary units, ±SD) of modulation strength across subjects of each of the modulatory inputs (unexpected and expected events collapsed across stimulus) are depicted next to each of the intrinsic connections.
Discussion
Our experiment yielded four novel findings. First, unexpected oral stimulation resulted in robust recruitment of attention, gustatory, and reward networks. This is in keeping with the need to orient toward, identify, and learn about biologically relevant unexpected oral stimulation. Second, the influence of a breach of expectation was greater in the anterior dorsal insula when the unexpected oral stimulus contained a taste. This suggests that whereas unexpected oral stimulation results in enhanced recruitment of taste, reward, and attentional networks, gustatory signals are integrated with attention and/or reward signals specifically in the anterior dorsal insula. Third, the VS and IPS preferentially interact with insular cortex during unexpected versus expected tasting, with DCM indicating that connectivity from the parietal cortex and VS to the anterior insula and from the anterior insula to VS is enhanced by unexpected tastes. Finally, we report one unpredicted finding: receipt of an unexpected versus an expected oral stimulus was associated with greater suppression in the fusiform gyri, which forms part of the visual object recognition stream (Haxby et al., 1991). We suggest that this result may reflect cross-modal suppression during a taste object identification task.
Breaches of taste expectation recruit attention gustatory and reward circuits
It has long been known that the sensation of an unexpected event during goal-directed behavior is associated with attentional deployment and reorientation (Posner, 1980). Consistent with findings from classical studies of visual spatial attention (Posner, 1980), we found that reaction times were significantly slower, and detection less accurate, after invalid compared with valid cueing (Fig. 3). We therefore suggest our results reflect the behavioral cost of attentional deployment and stimulus identity reorientation after the breach of taste expectation. As such, breaches of taste identity expectation resulted in preferential recruitment of regions critical for attentional control including the IPS, inferior frontal gyrus, and anterior cingulate cortex (Mesulam et al., 2005). Moreover, the IPS and inferior frontal gyrus have been specifically implicated in reorienting to location after invalid cues in both visual and tactile domains (Corbetta and Shulman, 2002; Macaluso et al., 2002) and in reorienting to time after invalid cues (Corbetta et al., 1998; Nobre, 2001). Thus, our finding aligns with work highlighting the supramodal nature of the fronto-parietal attention network.
We also observed preferential responses in the anterior OFC and VS during breaches of taste identity expectation. Both regions have been implicated by functional neuroimaging studies in coding error signals in the context of reward learning (Pagnoni et al., 2002; McClure et al., 2003; O'Doherty et al., 2003), with the magnitude of responses modulated according to the strength of an error signal thought to be generated (O'Doherty et al., 2003). The anterior OFC has also been shown to respond to taste (Small et al., 2003; Verhagen and Engelen, 2006) and breaches of visual spatial expectation (Nobre et al., 1999). In our task, invalid trials were associated not only with attentional reorientation but also with the generation of a positive or a negative error signal: negative if sweet was expected and tasteless was received, or positive if tasteless was expected and sweet was received. Therefore, the preferential response in the OFC could reflect sensory, reward, or attentional processing, or perhaps an integration of the three processes (Maunsell, 2004).
Likewise, preferential recruitment of the anterior insular cortex during breaches of taste identity expectation may reflect attentional, reward, or sensory processing. This region corresponds to primary taste cortex (Pritchard et al., 1986) and consistently responds to taste stimuli (Frey and Petrides, 1999; Zald and Pardo, 2000; O'Doherty et al., 2001). However, it is also sensitive to expectation and attention. The insula is activated during general selective attention (Nobre, 2001; Corbetta and Shulman, 2002); “oddball” tasks, which require reorientation (Linden et al., 1999; Huettel and McCarthy, 2004); and risk prediction and risk assessment (Preuschoff et al., 2008). It is also thought to play a critical role in attending to interoceptive stimuli (Critchley et al., 2004) and in self-awareness (Craig, 2009). To integrate the seemingly disparate insular functions, Menon and Uddin (2010) argued that the insular cortex plays a general role in the attribution of salience to environmental events to mark them in time and place for additional processing. It is therefore possible that the enhanced insular responses to unexpected tastes reflects orienting to the mouth after a breach of expectation, assessment of the risk of consuming the substance, or general salience attribution to the unexpected taste.
Evidence that gustatory signals are integrated with attention and/or reward signals in the anterior dorsal insula
Selective attention to taste alters taste-evoked responses in rodents and humans (Fontanini and Katz, 2005; Veldhuizen et al., 2007; Fontanini and Katz, 2009). In primates, neurons in the primary taste cortex not only respond to the sensation of a taste but also to the sight of an approaching syringe that delivers the taste (Scott and Plata-Salaman, 1999). In humans, leading subjects to expect delivery of the weaker compared with the stronger bitter stimulus results in reduced insular response to the stronger stimulus, indicating that expectations about intensity can change taste perception and that this modulation depends on processes in insular cortex (Nitschke et al., 2006). In keeping with these findings, we found greater response in the insula to a breach of expectation when the oral stimulus contained a taste. This indicates that within this region of insular cortex, sensory signals interact with attentional and reward signals, possibly in the service of assigning greater saliency to the taste sensation (O'Doherty et al., 2003; Menon and Uddin, 2010). One caveat to this interpretation is that we cannot rule out the possibility that it is the positive error signal rather than the taste that recruits the insula. However, we feel this is unlikely since the region corresponds to primary taste cortex (Small, 2010) and previous studies of error signaling using gustatory stimuli have failed to find responses in insular cortex related to error signal generation (either positive or negative) (Berns et al., 2001; Pagnoni et al., 2002; McClure et al., 2003; O'Doherty et al., 2003, 2006).
Evidence for greater connectivity between insula, striatum, and IPS during breaches of expectation
Breaches of taste expectation recruited multiple regions. To test whether these coactivations reflected greater interconnectivity, we extracted responses from the most significantly activated voxels within the IPS and VS and asked whether the interaction between these seed regions and all other brain areas depended on expectation. Both the IPS and the VS exhibited preferential connectivity specifically with the anterior insula during unexpected versus expected tasting (Fig. 7). This indicates that these critical nodes of the attention, reward, and gustatory networks are not simply coactivated but also preferentially interact during breaches of oral sensory expectation. We predicted that IPS and VS would influence insular responses, reflecting upregulation of sensory processing by reward and attention networks. Thirty-one DCM models were generated with inputs entering at the anterior insula to reflect the gustatory task. There was significant evidence for one model that showed modulation of IPS on insula, VS on insula, and insula on VS. Thus, these results support our hypothesis that both parietal cortex and VS influence response in the anterior insula, reflecting modulation of sensory inputs by attentional and reward networks, respectively. They also indicate that the connection between the VS and insula represents bidirectional influences.
Evidence for cross-modal interactions
Finally, an unanticipated finding was that unexpected compared with expected tasting was associated with significantly greater deactivations in the fusiform gyrus bilaterally. The fusiform gyrus is part of the ventral stream for visual object recognition (Haxby et al., 1991). Previous studies of cross-modal interactions show that attending to one modality may result in decreased responses in the other (Mozolic et al., 2008). Our task required subjects to identify taste stimuli. We therefore suggest that the effect observed in fusiform gyrus reflects cross-modal suppression of visual object identification during this taste identification task. We further speculate that the deactivation was greater when the stimulus is unexpected because greater attentional resources were necessary to taste and identify the unexpected stimulus, making those resources less available to other modalities. An alternative possibility is that the deactivation reflects active suppression of conflicting sensory input (Laurienti et al., 2002). However, we suggest that this is unlikely, because our subjects were instructed to keep their eyes closed during scanning.
In summary, we demonstrated that unexpected oral stimulation results in upregulation of taste sensory cortex by attention and reward networks and downregulation of the region of visual cortex important for object recognition. These findings are consistent with the need for coordinated activity of multiple networks to help organisms orient toward, identify, and learn about biologically relevant. One caveat is that all of our subjects were women. It is not possible to know whether the observed effects will generalize to men. Future work is needed to evaluate the importance of phenotypes such as gender, body weight, and eating style on these responses.
Footnotes
This work was supported by German Research Foundation (Deutsche Forschungsgemeinschaft) Grant AS 299/1-1 (research fellowship) to K.A. and by NIDCD Grant R016706-01 to D.M.S.
References
- Accolla R, Bathellier B, Petersen CCH, Carleton A. Differential spatial representation of taste modalities in the rat gustatory cortex. J Neurosci. 2007;27:1396–1404. doi: 10.1523/JNEUROSCI.5188-06.2007. [DOI] [PMC free article] [PubMed] [Google Scholar]
- Bartoshuk LM, McBurney DH, Pfaffmann C. Taste of sodium chloride solutions after adaptation to sodium chloride: implications for the “water taste.”. Science. 1964;143:967–968. doi: 10.1126/science.143.3609.967. [DOI] [PubMed] [Google Scholar]
- Bartoshuk LM, Duffy VB, Hayes JE, Moskowitz HR, Snyder DJ. Psychophysics of sweet and fat perception in obesity: problems, solutions and new perspectives. Philos Trans R Soc Lond B Biol Sci. 2006;361:1137–1148. doi: 10.1098/rstb.2006.1853. [DOI] [PMC free article] [PubMed] [Google Scholar]
- Bender G, Veldhuizen MG, Meltzer JA, Gitelman DR, Small DM. Neural correlates of evaluative compared with passive tasting. Eur J Neurosci. 2009;30:327–338. doi: 10.1111/j.1460-9568.2009.06819.x. [DOI] [PMC free article] [PubMed] [Google Scholar]
- Berns GS, McClure SM, Pagnoni G, Montague PR. Predictability modulates human brain response to reward. J Neurosci. 2001;21:2793–2798. doi: 10.1523/JNEUROSCI.21-08-02793.2001. [DOI] [PMC free article] [PubMed] [Google Scholar]
- Bonnet C, Zamora MC, Buratti F, Guirao M. Group and individual gustatory reaction times and Pieron's law. Physiol Behav. 1999;66:549–558. doi: 10.1016/s0031-9384(98)00209-1. [DOI] [PubMed] [Google Scholar]
- Corbetta M, Shulman GL. Control of goal-directed and stimulus-driven attention in the brain. Nat Rev Neurosci. 2002;3:201–215. doi: 10.1038/nrn755. [DOI] [PubMed] [Google Scholar]
- Corbetta M, Akbudak E, Conturo TE, Snyder AZ, Ollinger JM, Drury HA, Linenweber MR, Petersen SE, Raichle ME, Van Essen DC, Shulman GL. A common network of functional areas for attention and eye movements. Neuron. 1998;21:761–773. doi: 10.1016/s0896-6273(00)80593-0. [DOI] [PubMed] [Google Scholar]
- Craig AD. How do you feel - now? The anterior insula and human awareness. Nat Rev Neurosci. 2009;10:59–70. doi: 10.1038/nrn2555. [DOI] [PubMed] [Google Scholar]
- Critchley HD, Wiens S, Rotshtein P, Ohman A, Dolan RJ. Neural systems supporting interoceptive awareness. Nat Neurosci. 2004;7:189–195. doi: 10.1038/nn1176. [DOI] [PubMed] [Google Scholar]
- Desseilles M, Schwartz S, Dang-Vu TT, Sterpenich V, Ansseau M, Maquet P, Phillips C. Depression alters “top-down” visual attention: a dynamic causal modeling comparison between depressed and healthy subjects. Neuroimage. 2011;54:1662–1668. doi: 10.1016/j.neuroimage.2010.08.061. [DOI] [PubMed] [Google Scholar]
- Felsted JA, Ren X, Chouinard-Decorte F, Small DM. Genetically determined differences in brain response to a primary food reward. J Neurosci. 2010;30:2428–2432. doi: 10.1523/JNEUROSCI.5483-09.2010. [DOI] [PMC free article] [PubMed] [Google Scholar]
- Fontanini A, Katz DB. 7 to 12 Hz activity in rat gustatory cortex reflects disengagement from a fluid self-administration task. J Neurophysiol. 2005;93:2832–2840. doi: 10.1152/jn.01035.2004. [DOI] [PubMed] [Google Scholar]
- Fontanini A, Katz DB. Behavioral modulation of gustatory cortical activity. Ann N Y Acad Sci. 2009;1170:403–406. doi: 10.1111/j.1749-6632.2009.03922.x. [DOI] [PMC free article] [PubMed] [Google Scholar]
- Frey S, Petrides M. Re-examination of the human taste region: a positron emission tomography study. Eur J Neurosci. 1999;11:2985–2988. doi: 10.1046/j.1460-9568.1999.00738.x. [DOI] [PubMed] [Google Scholar]
- Friston KJ, Buechel C, Fink GR, Morris J, Rolls E, Dolan RJ. Psychophysiological and modulatory interactions in neuroimaging. Neuroimage. 1997;6:218–229. doi: 10.1006/nimg.1997.0291. [DOI] [PubMed] [Google Scholar]
- Friston KJ, Harrison L, Penny W. Dynamic causal modelling. Neuroimage. 2003;19:1273–1302. doi: 10.1016/s1053-8119(03)00202-7. [DOI] [PubMed] [Google Scholar]
- Gitelman DR, Penny WD, Ashburner J, Friston KJ. Modeling regional and psychophysiologic interactions in fMRI: the importance of hemodynamic deconvolution. Neuroimage. 2003;19:200–207. doi: 10.1016/s1053-8119(03)00058-2. [DOI] [PubMed] [Google Scholar]
- Green BG, Dalton P, Cowart B, Shaffer G, Rankin K, Higgins J. Evaluating the “labeled magnitude scale” for measuring sensations of taste and smell. Chem Sens. 1996;21:323–334. doi: 10.1093/chemse/21.3.323. [DOI] [PubMed] [Google Scholar]
- Haxby JV, Grady CL, Horwitz B, Ungerleider LG, Mishkin M, Carson RE, Herscovitch P, Schapiro MB, Rapoport SI. Dissociation of object and spatial visual processing pathways in human extrastriate cortex. Proc Natl Acad Sci U S A. 1991;88:1621–1625. doi: 10.1073/pnas.88.5.1621. [DOI] [PMC free article] [PubMed] [Google Scholar]
- Henson RN, Price CJ, Rugg MD, Turner R, Friston KJ. Detecting latency differences in event-related BOLD responses: application to words versus nonwords and initial versus repeated face presentations. Neuroimage. 2002;15:83–97. doi: 10.1006/nimg.2001.0940. [DOI] [PubMed] [Google Scholar]
- Huettel SA, McCarthy G. What is odd in the oddball task? Prefrontal cortex is activated by dynamic changes in response strategy. Neuropsychologia. 2004;42:379–386. doi: 10.1016/j.neuropsychologia.2003.07.009. [DOI] [PubMed] [Google Scholar]
- Kanwisher N, Wojciulik E. Visual attention: insights from brain imaging. Nat Rev Neurosci. 2000;1:91–100. doi: 10.1038/35039043. [DOI] [PubMed] [Google Scholar]
- Katz DB, Nicolelis MA, Simon SA. Gustatory processing is dynamic and distributed. Curr Opin Neurobiol. 2002;12:448–454. doi: 10.1016/s0959-4388(02)00341-0. [DOI] [PubMed] [Google Scholar]
- Laurienti PJ, Burdette JH, Wallace MT, Yen YF, Field AS, Stein BE. Deactivation of sensory-specific cortex by cross-modal stimuli. J Cogn Neurosci. 2002;14:420–429. doi: 10.1162/089892902317361930. [DOI] [PubMed] [Google Scholar]
- Linden DE, Prvulovic D, Formisano E, Völlinger M, Zanella FE, Goebel R, Dierks T. The functional neuroanatomy of target detection: an fMRI study of visual and auditory oddball tasks. Cereb Cortex. 1999;9:815–823. doi: 10.1093/cercor/9.8.815. [DOI] [PubMed] [Google Scholar]
- Macaluso E, Frith CD, Driver J. Supramodal effects of covert spatial orienting triggered by visual or tactile events. J Cogn Neurosci. 2002;14:389–401. doi: 10.1162/089892902317361912. [DOI] [PubMed] [Google Scholar]
- Macey PM, Macey KE, Kumar R, Harper RM. A method for removal of global effects from fMRI time series. Neuroimage. 2004;22:360–366. doi: 10.1016/j.neuroimage.2003.12.042. [DOI] [PubMed] [Google Scholar]
- Maunsell JH. Neuronal representations of cognitive state: reward or attention? Trends Cogn Sci. 2004;8:261–265. doi: 10.1016/j.tics.2004.04.003. [DOI] [PubMed] [Google Scholar]
- McClure SM, Berns GS, Montague PR. Temporal prediction errors in a passive learning task activate human striatum. Neuron. 2003;38:339–346. doi: 10.1016/s0896-6273(03)00154-5. [DOI] [PubMed] [Google Scholar]
- McClure SM, Li J, Tomlin D, Cypert KS, Montague LM, Montague PR. Neural correlates of behavioral preference for culturally familiar drinks. Neuron. 2004;44:379–387. doi: 10.1016/j.neuron.2004.09.019. [DOI] [PubMed] [Google Scholar]
- Menon V, Uddin L. Saliency, switching, attention and control: a network model of insula function. Brain Struct Funct. 2010;214:655–667. doi: 10.1007/s00429-010-0262-0. [DOI] [PMC free article] [PubMed] [Google Scholar]
- Mesulam M, Small DM, Vandenberghe R, Gitelman DR, Nobre AC. A heteromodal large-scale network for spatial attention. In: Itti L, Rees G, Tsotsos J, editors. Neurobiology of attention. San Diego: Elsevier Academic; 2005. pp. 29–34. [Google Scholar]
- Mozolic J, Joyner D, Hugenschmidt C, Peiffer A, Kraft R, Maldjian J, Laurienti P. Cross-modal deactivations during modality-specific selective attention. BMC Neurol. 2008;8:35. doi: 10.1186/1471-2377-8-35. [DOI] [PMC free article] [PubMed] [Google Scholar]
- Nitschke JB, Dixon GE, Sarinopoulos I, Short SJ, Cohen JD, Smith EE, Kosslyn SM, Rose RM, Davidson RJ. Altering expectancy dampens neural response to aversive taste in primary taste cortex. Nat Neurosci. 2006;9:435–442. doi: 10.1038/nn1645. [DOI] [PubMed] [Google Scholar]
- Nobre AC. Orienting attention to instants in time. Neuropsychologia. 2001;39:1317–1328. doi: 10.1016/s0028-3932(01)00120-8. [DOI] [PubMed] [Google Scholar]
- Nobre AC, Coull JT, Frith CD, Mesulam MM. Orbitofrontal cortex is activated during breaches of expectation in tasks of visual attention. Nat Neurosci. 1999;2:11–12. doi: 10.1038/4513. [DOI] [PubMed] [Google Scholar]
- O'Doherty J, Rolls ET, Francis S, Bowtell R, McGlone F. Representation of pleasant and aversive taste in the human brain. J Neurophysiol. 2001;85:1315–1321. doi: 10.1152/jn.2001.85.3.1315. [DOI] [PubMed] [Google Scholar]
- O'Doherty JP, Dayan P, Friston K, Critchley H, Dolan RJ. Temporal difference models and reward-related learning in the human brain. Neuron. 2003;38:329–337. doi: 10.1016/s0896-6273(03)00169-7. [DOI] [PubMed] [Google Scholar]
- O'Doherty JP, Buchanan TW, Seymour B, Dolan RJ. Predictive neural coding of reward preference involves dissociable responses in human ventral midbrain and ventral striatum. Neuron. 2006;49:157–166. doi: 10.1016/j.neuron.2005.11.014. [DOI] [PubMed] [Google Scholar]
- Oldfield RC. The assessment and analysis of handedness: the Edinburgh inventory. Neuropsychologia. 1971;9:97–113. doi: 10.1016/0028-3932(71)90067-4. [DOI] [PubMed] [Google Scholar]
- Pagnoni G, Zink CF, Montague PR, Berns GS. Activity in human ventral striatum locked to errors of reward prediction. Nat Neurosci. 2002;5:97–98. doi: 10.1038/nn802. [DOI] [PubMed] [Google Scholar]
- Penny WD, Stephan KE, Daunizeau J, Rosa MJ, Friston KJ, Schofield TM, Leff AP. Comparing families of dynamic causal models. PLoS Comput Biol. 2010;6:e1000709. doi: 10.1371/journal.pcbi.1000709. [DOI] [PMC free article] [PubMed] [Google Scholar]
- Plassmann H, O'Doherty J, Shiv B, Rangel A. Marketing actions can modulate neural representations of experienced pleasantness. Proc Natl Acad Sci U S A. 2008;105:1050–1054. doi: 10.1073/pnas.0706929105. [DOI] [PMC free article] [PubMed] [Google Scholar]
- Posner MI. Orienting of attention. Q J Exp Psychol. 1980;32:3–25. doi: 10.1080/00335558008248231. [DOI] [PubMed] [Google Scholar]
- Preuschoff K, Quartz SR, Bossaerts P. Human insula activation reflects risk prediction errors as well as risk. J Neurosci. 2008;28:2745–2752. doi: 10.1523/JNEUROSCI.4286-07.2008. [DOI] [PMC free article] [PubMed] [Google Scholar]
- Pritchard TC, Hamilton RB, Morse JR, Norgren R. Projections of thalamic gustatory and lingual areas in the monkey, Macaca fascicularis. J Comp Neurol. 1986;244:213–228. doi: 10.1002/cne.902440208. [DOI] [PubMed] [Google Scholar]
- Rescorla RA, Wagner AR. A theory of Pavlovian conditioning: variations in the effectiveness of reinforcement and nonreinforcement. In: Black AH, Prokasy WF, editors. Classical conditioning II. New York: Appleton-Century-Crofts; 1972. pp. 64–99. [Google Scholar]
- Schultz W, Tremblay L, Hollerman JR. Reward processing in primate orbitofrontal cortex and basal ganglia. Cereb Cortex. 2000;10:272–283. doi: 10.1093/cercor/10.3.272. [DOI] [PubMed] [Google Scholar]
- Scott TR, Plata-Salaman CR. Taste in the monkey cortex. Physiol Behav. 1999;67:489–511. doi: 10.1016/s0031-9384(99)00115-8. [DOI] [PubMed] [Google Scholar]
- Small D. Taste representation in the human insula. Brain Struct Funct. 2010;214:551–561. doi: 10.1007/s00429-010-0266-9. [DOI] [PubMed] [Google Scholar]
- Small DM. Central gustatory processing in humans. In: Hummel T, Welge-Lüssen A, editors. Taste and smell. An update. Advances in Otorhinolaryngology. Basel: Karger; 2006. pp. 191–220. [DOI] [PubMed] [Google Scholar]
- Small DM, Gregory MD, Mak YE, Gitelman D, Mesulam MM, Parrish T. Dissociation of neural representation of intensity and affective valuation in human gustation. Neuron. 2003;39:701–711. doi: 10.1016/s0896-6273(03)00467-7. [DOI] [PubMed] [Google Scholar]
- Small DM, Voss J, Mak YE, Simmons KB, Parrish T, Gitelman D. Experience-dependent neural integration of taste and smell in the human brain. J Neurophysiol. 2004;92:1892–1903. doi: 10.1152/jn.00050.2004. [DOI] [PubMed] [Google Scholar]
- Small DM, Veldhuizen MG, Felsted J, Mak YE, McGlone F. Separable substrates for anticipatory and consummatory food chemosensation. Neuron. 2008;57:786–797. doi: 10.1016/j.neuron.2008.01.021. [DOI] [PMC free article] [PubMed] [Google Scholar]
- Stephan KE, Penny WD, Daunizeau J, Moran RJ, Friston KJ. Bayesian model selection for group studies. Neuroimage. 2009;46:1004–1017. doi: 10.1016/j.neuroimage.2009.03.025. [DOI] [PMC free article] [PubMed] [Google Scholar]
- Stephan KE, Penny WD, Moran RJ, den Ouden HEM, Daunizeau J, Friston KJ. Ten simple rules for dynamic causal modeling. Neuroimage. 2010;49:3099–3109. doi: 10.1016/j.neuroimage.2009.11.015. [DOI] [PMC free article] [PubMed] [Google Scholar]
- Talairach J, Tournoux P. Co-planar stereotaxic atlas of the human brain. New York: Thieme; 1998. [Google Scholar]
- Tremblay L, Schultz W. Relative reward preference in primate orbitofrontal cortex. Nature. 1999;398:704–708. doi: 10.1038/19525. [DOI] [PubMed] [Google Scholar]
- Tremblay L, Schultz W. Modifications of reward expectation-related neuronal activity during learning in primate orbitofrontal cortex. J Neurophysiol. 2000;83:1877–1885. doi: 10.1152/jn.2000.83.4.1877. [DOI] [PubMed] [Google Scholar]
- Veldhuizen MG, Small DM. Modality-specific neural effects of selective attention to taste and odor. Chem Senses. 2011 doi: 10.1093/chemse/bjr043. [DOI] [PMC free article] [PubMed] [Google Scholar]
- Veldhuizen MG, Bender G, Constable RT, Small DM. Trying to detect taste in a tasteless solution: modulation of early gustatory cortex by attention to taste. Chem Sens. 2007;32:569–581. doi: 10.1093/chemse/bjm025. [DOI] [PubMed] [Google Scholar]
- Veldhuizen MG, Shepard TG, Wang M-F, Marks LE. Coactivation of gustatory and olfactory signals in flavor perception. Chem Sens. 2010;35:121–133. doi: 10.1093/chemse/bjp089. [DOI] [PMC free article] [PubMed] [Google Scholar]
- Verhagen JV, Engelen L. The neurocognitive bases of human multimodal food perception: sensory integration. Neurosci Biobehav Rev. 2006;30:613–650. doi: 10.1016/j.neubiorev.2005.11.003. [DOI] [PubMed] [Google Scholar]
- Wagner AR, Rescorla RA. Inhibition in Pavlovian conditioning: application of a theory. In: Boakes RA, Halliday MS, editors. Inhibition and learning. London: Academic; 1972. pp. 301–336. [Google Scholar]
- Zald DH, Pardo JV. Cortical activation induced by intraoral stimulation with water in humans. Chem Sens. 2000;25:267–275. doi: 10.1093/chemse/25.3.267. [DOI] [PubMed] [Google Scholar]