Abstract
Purpose
To evaluate effects of combining functional MRI data acquired from different field strengths on group analysis as a function of the number of subjects at each field strength.
Materials and Methods
28 subjects (18 at 3T) participated in an auditory task of passively listening to a 0.75s segment of jazz music in an event-related design. Results of single-subject analysis were combined to create all possible subject combinations for a group size of 8 subjects from each of the 3T and 1.5T pools, comprising subject mixtures of (3T/1.5T) 0/8, 2/6, 4/4, 6/2 and 8/0. Group analysis performance of each subject permutation was measured by receiver operating characteristic (ROC) curves and activation overlap maps.
Results
While area under ROC curves, extent of activation in the gold standard region and reliability of activation increased with the number of 3T subjects, marginal gain decreased. ROC performance overlap across mixtures was observed, indicating that some combinations of subjects markedly outperformed others. For detection of activation, 4/4 was arguably the minimum mixture level that was comparable to 3T-only group results.
Conclusion
Inclusion of 1.5T data does not necessarily reduce the validity of group analysis. Lower field strength data was found only to limit detection power, but did not affect specificity. Within the limits of realignment error, these results should also extend to group longitudinal analyses of subject mixtures from different field strengths.
Keywords: fMRI, 1.5T, 3T, data analysis, ROC analysis
Introduction
During the past decade, functional magnetic resonance imaging (fMRI) research has transitioned from a science primarily conducted on clinical 1.5 Tesla (T) systems to a specialized science commonly conducted on high field strength, research-only systems of 3T or higher. Since their introduction to clinical use in 1982, 1.5T magnetic resonance imaging (MRI) systems have served as the backbone of clinical imaging (1), and were the primary platform on which fMRI was developed (2,3), becoming a widespread tool for research. While higher field strength systems were commonly used in research (e.g., (4)), it is only in the past decade that 3T systems have become commonplace in clinical and research facilities. Introduction of these higher field systems has often resulted in replacement of lower field systems due to proven advantages of higher field strength (e.g., signal-to-noise ratio, SNR (5), spatial resolution (6), and fMRI contrast-to-noise ratio, CNR (7–10)). When such new (and better) systems become available to a researcher, a common question is whether on-going studies should be continued (where possible) at the lower field strength, or if they must be restarted at the higher field strength.
The opinion is frequently expressed by many who work in fMRI that data cannot be meaningfully combined across different systems, let alone across different field strengths. With increasing popularity of multisite neuroimaging trials (see (11) for recent trends), a body of literature on multisite studies has been growing (e.g., combination under same imaging hardware (12), SNR and CNR measurements (13), variability reduction with quality assurance (14–16), reliability (17, 18) and power analysis (19, 20)). Clearly, studies conducted across multiple sites have demonstrated that this negative opinion regarding fMRI data combination is incorrect, particularly with regard to different systems of the same field strength. However, the question remains open as to the consequences of combining data across field strengths. To address this question, a mixing study was conducted across 1.5T and 3T field strengths to investigate effects on fMRI group analysis as a function of the relative fraction of subjects included from each of the field strengths.
Materials and Methods
Subjects
28 subjects (15 male; age 19–35) participated in the studies contributing to this project. 10 (6 male; age 21–35) were imaged at 1.5T, and 18 (9 male; age 19–32) at 3T. All reported normal hearing, and provided written informed consent. The study was approved by the Human Research Protection Program at each institution where the work was performed, and was conducted in compliance with the Code of Ethical Principles for Medical Research Involving Human Subjects of the World Medical Association (Declaration of Helsinki).
Experimental Task
A 0.75s segment of jazz music with limited spectral roll-off over the range 0.5–8 kHz was used throughout this study. This stimulus was presented at a subject-determined comfortable listening level, binaurally into the ear canals using pneumatic delivery (Avotec SilentScan SS-3100, Stuart, FL) via plastic tubing and EAR EarLink 3A insert eartips (Kimmetrics, Smithsburg, MD). (Note that this delivery attenuates transmission above 3kHz.) Subjects were instructed to passively attend to the music throughout experimentation. Two event-related runs (435 and 301.5s total time at 1.5T and 3T, respectively) were conducted using both 12 and 24s inter-stimulus intervals (ISIs). Presentation of the ISIs was pseudo-random, with equal frequency across the aggregated runs. 46 total stimulus presentations were made at 1.5T, and 32 at 3T.
fMRI Acquisition
Data were acquired under the above paradigm at 1.5T and 3T. In all acquisitions, functional images were positioned to capture both left and right primary auditory cortex, with emphasis placed on encompassing the transverse temporal gyri.
1.5T imaging was performed on a GE Signa CVi (Milwaukee, WI). Bilateral auditory surface coils (21) were used with blipped EPI (TR/TE = 1500/40ms; FOV = 20cm×20cm; matrix = 64×64; flip angle = 70°) to obtain 290 images of each of 5 axial slices (5mm thick). A quadrature head coil was used to obtain 3D volumetric SPGR images of the whole brain (FOV = 24cm×24cm; matrix = 256×256; 124 slices, 1.0mm thick) for conversion to a standardized stereotactic reference frame for group analysis.
3T imaging was performed on a GE Signa HDx (Milwaukee, WI). For fMRI, an Invivo 8-channel brain array was used with blipped EPI (TR/TE = 1500/22ms; FOV = 24cm×24cm; matrix = 64×64; flip angle = 88°) to obtain 201 images of each of 12 axial slices (3.8mm thick). 3D volumetric FSPGR images of the whole brain (FOV = 24cm×24cm; matrix = 256×256; 190 slices, 1.0mm thick) were also acquired.
fMRI Processing
Data were preprocessed in a standard way using AFNI (22). Each subject’s whole-brain images were skull-stripped and converted to stereotactic Talairach coordinates (23), with resampling (quintic interpolation) to 1mm isotropic resolution. For each fMRI run, the first two time-points were discarded, and remaining images realigned (rigid-body) to the mean image of the run. Data were coregistered to the volumetric images and converted to Talairach space, with resampling (quintic interpolation) to 4mm isotropic resolution. Resampled data were detrended (third order) and smoothed (8mm Gaussian). The time-course in each voxel was mean normalized for comparison across runs and subjects.
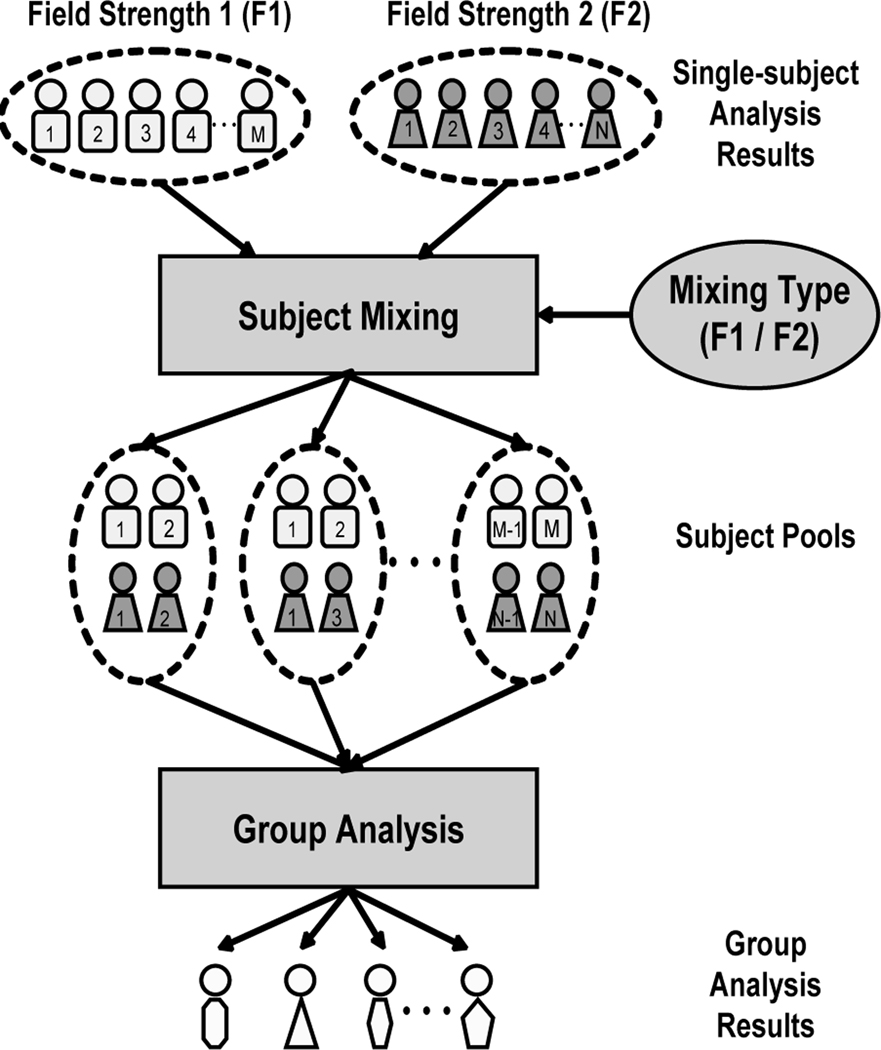
Preprocessed data were input to individual and group statistical analyses using the general linear model (GLM) (24) as implemented in AFNI, with statistical maps superimposed on group-averaged high resolution anatomical images. The general procedures of the mixing study are illustrated in Fig. 1.
Figure 1.
Framework for mixing study. Results of single-subject analysis conducted on equivalent paradigm at two field strengths (M subjects at F1; N subjects at F2) are combined to create all possible subject combinations (depicted here for a pool size of 4 subjects, 2 each from the F1 and F2 pools), for which an exhaustive set of group analyses are performed, with results tabulated for construction of receiver operating characteristic curves and activation overlap maps. Actual study utilized pool size of 8 subjects, comprising subject mixtures of (3T/1.5T) 0/8, 2/6, 4/4, 6/2 and 8/0.
Initial analysis of cross-field-strength effects involved processing single-subject data. First, all 1.5T runs were truncated from 288 images to 199 to match the pre-processed 3T data. As a result, 1.5T and 3T data comprise 32 total trials across the aggregated runs. At 1.5T and 3T the two runs on a subject were concatenated and processed using a three-column design matrix: (1) double Gamma Variate hemodynamic response function (HRF) (25) convolved with binary experimental paradigm, (2) same using the HRF temporal derivative, and (3) a constant. This single-subject analysis yielded parameter estimates corresponding to the HRF peak amplitude.
Single-subject HRF estimates (the first beta values) were input to the group analysis mixing study, in which 1.5T and 3T results were combined in varying proportion to evaluate effects of inclusion of higher field strength data on a group study that otherwise only contains data from a lower field strength. A group size of 8 subjects was assumed, with five possible mixing combinations of field strength (3T/1.5T: 0/8, 2/6, 4/4, 6/2, 8/0). The number of subject combinations (and corresponding number of group analyses performed) for each mixing combination were , respectively.
For each instance of each combination, random effects analysis of subject variance was hierarchically performed (26) using a one sample t-test to obtain T-scores. This takes into account inter-subject variance of the residual noise and single-subject parameter estimates. Resulting T-score maps served as outputs for evaluation.
For assessment of performance at each mixing combination, a “gold standard” map was constructed. Assuming that 3T data will exhibit a higher CNR (7–10), resulting in greater sensitivity and specificity, the gold standard was made from a random effects analysis on all 18 subjects imaged at 3T, thresholded at p < 0.05 corrected for false discovery rate (FDR). To ensure analysis was only conducted over anatomy present in all subject data, the activation map was masked by the intersection of the 28 normalized anatomical volumes.
Performance Analysis
First, direct comparison of group activation between field strengths was performed by random effects analysis of 10 and 18 subjects at 1.5T and 3T, respectively, as well as combination of all 28 subjects. An unpaired two sample t-test between the 10 and 18 subjects at the two field strengths was also computed. To evaluate reproducibility of activation maps as a function of mixing combination, two analyses were conducted: (1) receiver operating characteristic (ROC) analysis, and (2) fraction of overlap of activation (Roverlap). The second analysis was conducted after converting random effects T-scores to Z-scores.
For each mixing combination, masked T-score maps were evaluated at 40 threshold levels to yield ROC curves defined by (approximately) equally-distributed samples. Voxels meeting a given threshold under a particular mixing combination were compared to the gold standard, and each voxel was designated as a “True Positive” or a “False Positive.” The relative fractions of each were used to calculate the true (TPR) and false (FPR) positive rates associated with the threshold. For a given mixing combination, ROC curves were averaged across thresholds per (27).
To quantitatively assess sensitivity and specificity across mixing combinations, the area under the curve (AUC) was computed (sum of trapezoids) for each ROC. Qualitative assessment of activation as a function of mixing combination was made using a representative activation map for each combination, selected as the subject combination having median AUC for the mixing combination. This map was thresholded at p < 0.05 (uncorrected) to best reveal activation trends.
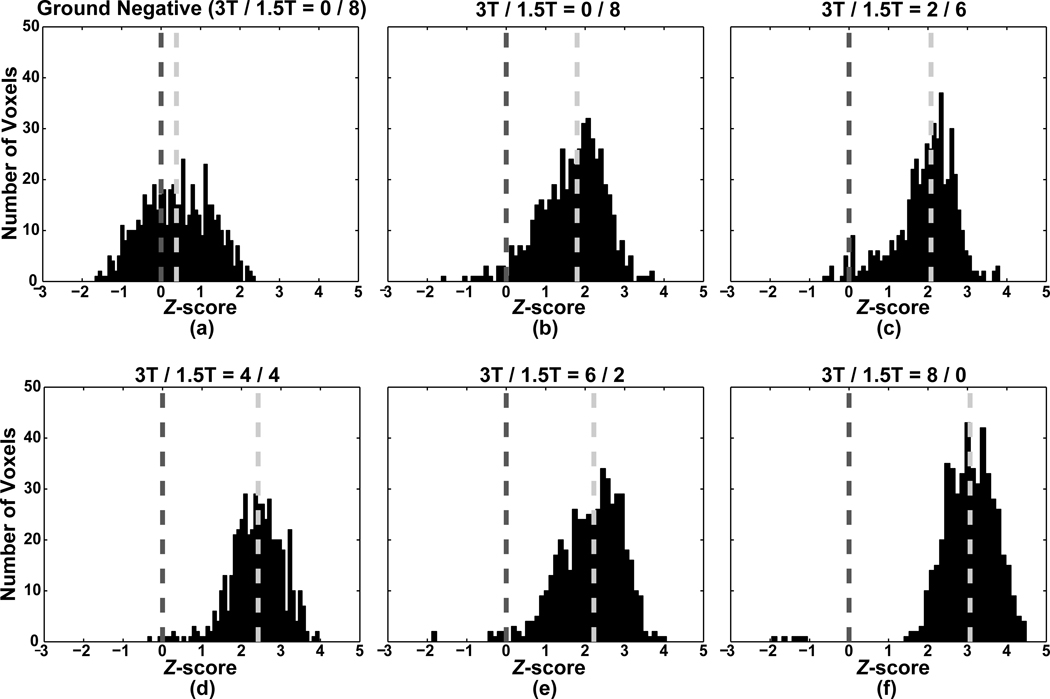
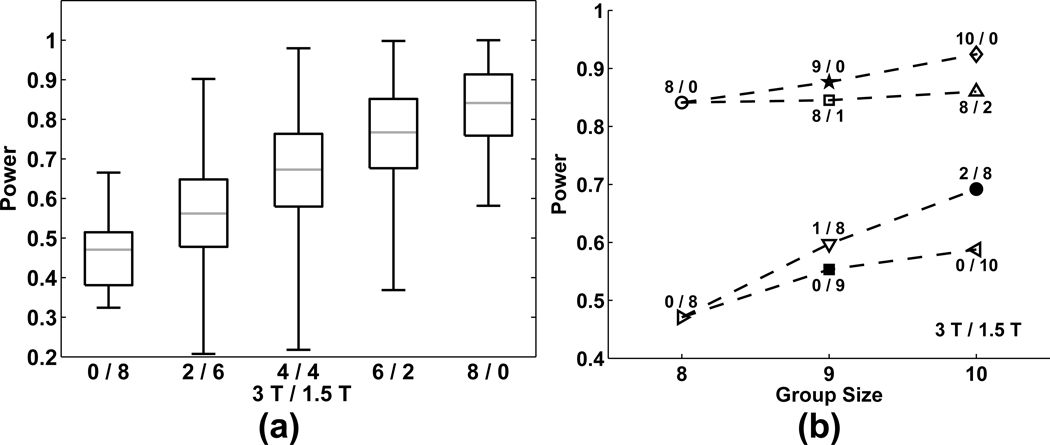
To illustrate effects of mixing combinations on statistical power, histograms of Z-scores in the gold standard region were constructed for each representative map. For comparison of each of the Z-score distributions in the gold standard region with noise distribution, the Z-score histogram for the converse of the gold standard was obtained for the 0/8 (i.e., 1.5T-only) mixing combination. To demonstrate changes in statistical power across mixing combinations, statistical power at α = 0.05 (uncorrected) was estimated empirically by calculating the corresponding TPR within the gold standard region. The power increase obtained by addition, to an already-acquired corpus, of subjects at a different field strength was evaluated by assessing the average power of subject combinations of 0/8 + X and 8/0 + X, respectively, where X ∈ {0/1, 0/2, 1/0, 2/0} and the 0/8 and 8/0 subject combination corresponds to that exhibiting the median power, as estimated above.
To assess reliability of activation across mixing combinations, 40 subject combinations were randomly selected and two metrics were calculated for the reliability of activation: the ratio of activation volume overlap (Roverlap) (28) for all pair-wise subject combinations within these sets () and the probability map of activation overlap (29). A threshold of p < 0.05 (uncorrected) was used for these analyses.
Results
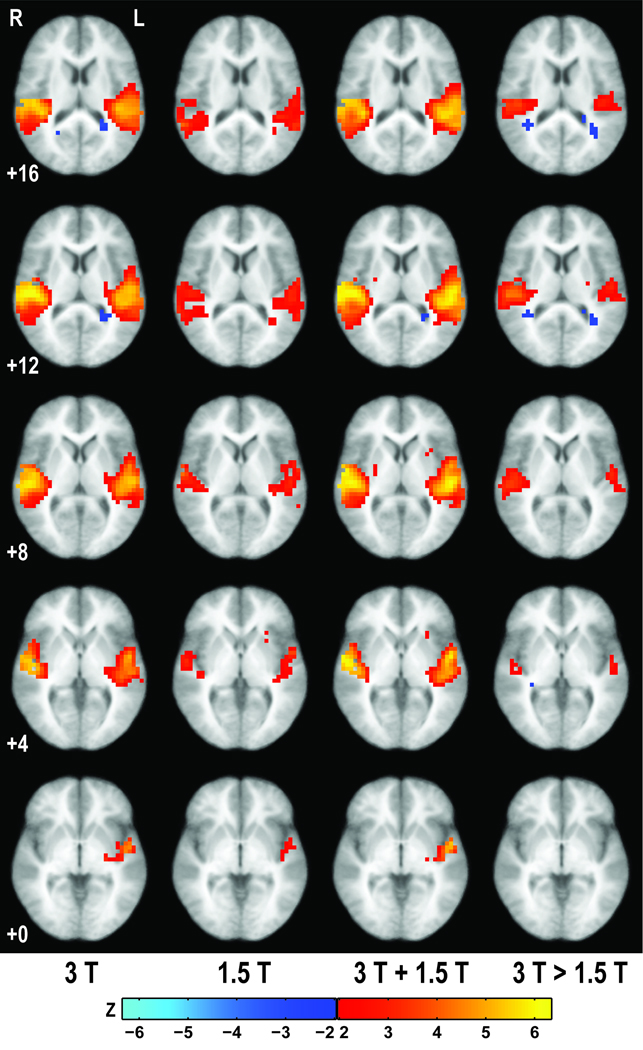
For direct comparison between field strengths, group activation maps (pUncorr < 0.05) are presented in Fig. 2. Group activation at 3T exhibits a larger extent of activation than at 1.5T, but the 1.5T group does not exhibit any structured activations that are absent at 3T. The direct comparison of the activations at 3T and 1.5T further supports this last point. Grater activation at 3T may primarily be attributed to obtaining a higher statistical score within the given voxels; isolated activations observed only for 1.5T are randomly distributed along bilateral cerebral white matter. These diffuse activations only observed at 1.5T do not significantly contribute to the group activation map when combining across field strengths, with the composite group activation being similar to the “gold standard” in Fig. 4.
Figure 2.
Group activation maps (p < 0.05, uncorrected) obtained from random effects analysis of (left to right) 18 subjects at 3T, 10 subjects at 1.5T, aggregated 28 subjects, and a contrast map between activations observed at 3T and 1.5T. Rows correspond to the indicated Talairach z-coordinate, with activations superimposed on an averaged, spatially normalized, structural image.
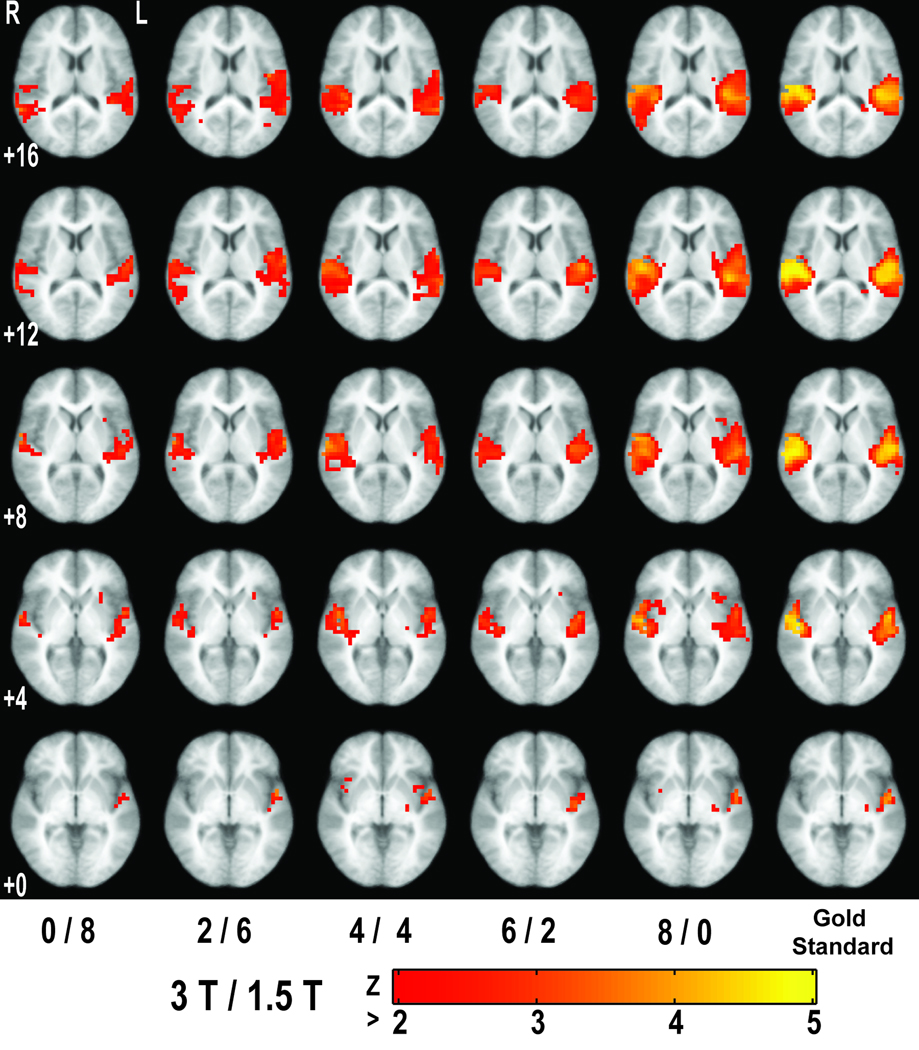
Figure 4.
Study of mixing combinations (left five columns; p < 0.05, uncorrected) and the gold standard (right column; p < 0.05, FDR-corrected) obtained from random effects analysis of all 18 subjects acquired at 3T, shown in Fig. 3b. Images are at the same Talairach z-coordinates as in Fig. 2.
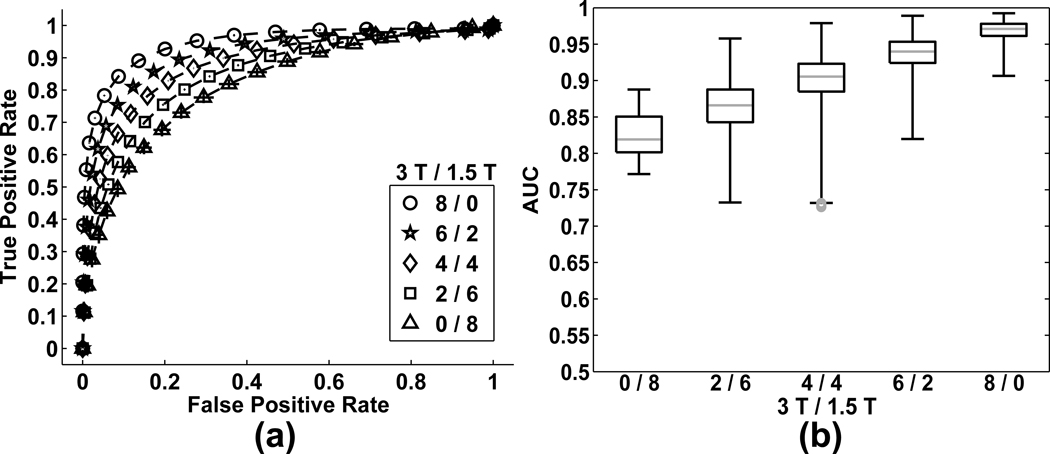
Per combining subjects across field strengths, as expected, ROC curves shift toward the upper left (ideality, relative to the gold standard) as the number of included 3T subjects increases (Fig. 3a). Note that mean FPR never increases with number of 3T subjects. Box plots of AUC are shown in Fig. 3b. Representative subject combination activations are presented in Fig. 4 (pUncorr < 0.05), along with the gold standard (pFDR < 0.05). As expected from other analyses of these data (30), activation associated with the gold standard is primarily in auditory cortex.
Figure 3.
(a) Aggregated ROC curves for random effect analyses results at 0/8, 2/6, 4/4, 6/2 and 8/0. X-Y error bars indicate 95% confidence intervals. (b) Box and whisker plots of the area under the ROC curve.
As the number of 3T subjects increases, extent of activation exceeding the threshold grows, along with the corresponding Z-scores in the gold standard region (Fig. 5). Note that these distributions (even at 0/8, or 1.5T-only) are markedly different from that observed in the converse of the gold standard region at the 0/8 mixing combination. Statistical power increases monotonically with the number of included 3T subjects (Fig. 6a). Fig. 6b shows that addition of one or two subjects at different field to existing subjects does not yield harmful effects on statistical power. In other words, addition of subjects increased statistical power even with new subjects collected at a different field strength.
Figure 5.
(a) Plot of Z-score distribution in the converse of the assumed gold standard (i.e., ground negative) region for the 0/8 mixing combination (i.e., 1.5T-only). (b)–(f) Plots of Z-score distributions in the assumed gold standard region for the five mixing combinations (3T/1.5T: 0/8, 2/6, 4/4, 6/2, 8/0). The light gray vertical dotted line indicates the median of each Z-score distribution and the dark gray vertical dotted line indicates Z = 0.
Figure 6.
(a) Box and whisker plots of power (assessed by true positive rate, TPR, for α = 0.05, uncorrected) across the five mixing combinations (3T/1.5T: 0/8, 2/6, 4/4, 6/2, 8/0). (b) Plot of average power as a function of main data collection group exhibiting the median TPR, after inclusion of 0–2 additional subjects (either field strength).
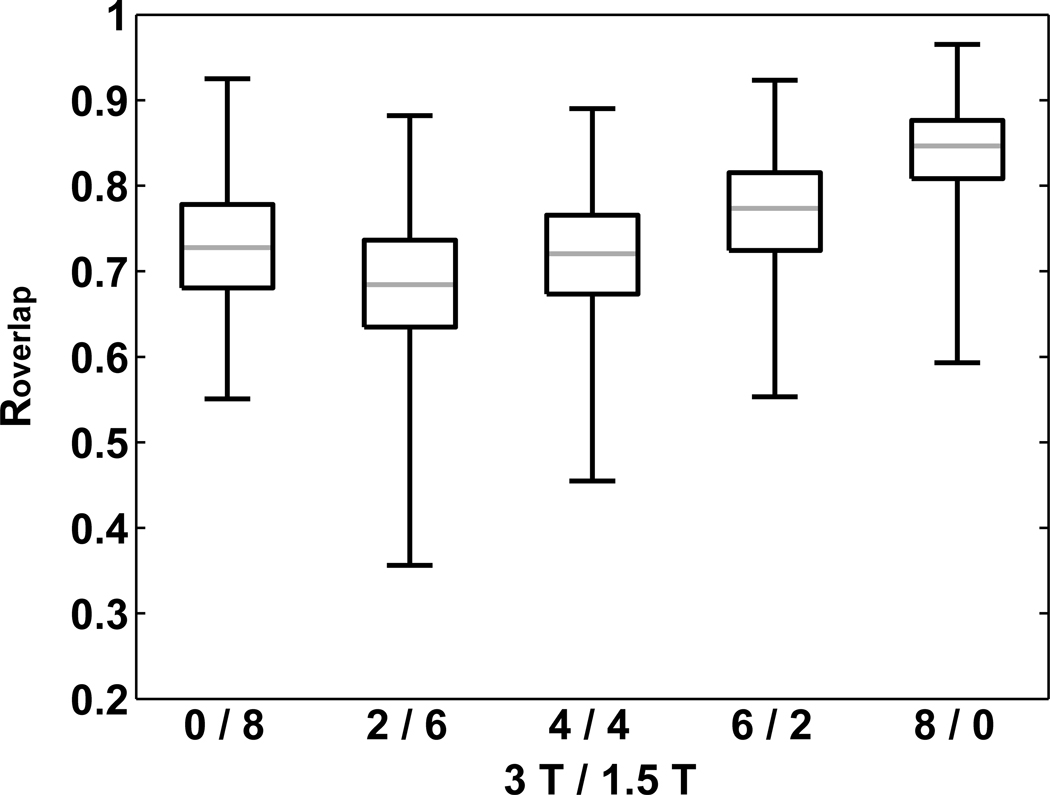
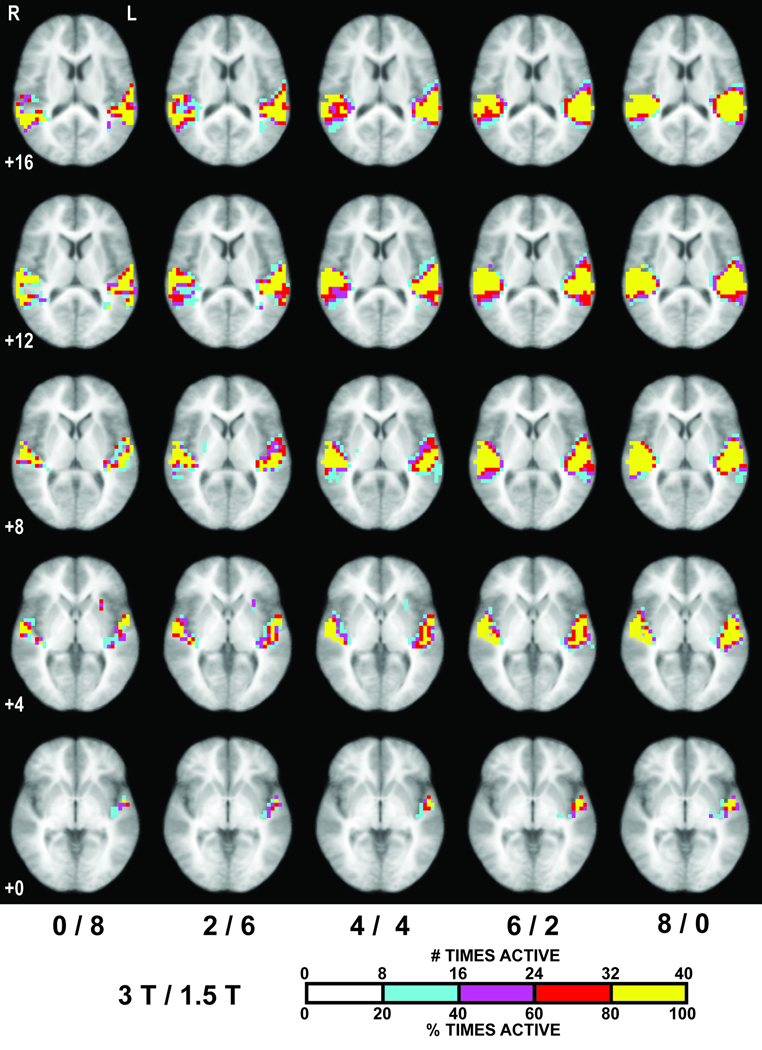
Box plots of Roverlap across mixing combinations (Fig. 7) reveal that reliability of activation increases with fraction of 3T subjects except from 0/8 to 2/6 (see discussion). Consistency of classification of any given voxel (Fig. 8) also increases with fraction of 3T data. For 0/8, 2/6, 4/4 and 6/2, the fractional overlap of volume in which voxels are active in at least 80% of the tested subject combinations (i.e., 32 of 40) relative to the volume at 8/0 is 31.0%, 43.6%, 58.9% and 79.3%, respectively.
Figure 7.
Box and whisker plots of Roverlap across the five mixing combinations (3T/1.5T: 0/8, 2/6, 4/4, 6/2, 8/0).
Figure 8.
Maps of probability activation overlap across the 40 selected subject combinations for each mixing combination, indicating the number of subject combinations in which a given voxel met Z > 1.96 (p < 0.05, uncorrected). Voxels active at least 20%, 40%, 60% and 80% of the combinations are colored cyan, purple, red and yellow, respectively. Images are at the same Talairach z-coordinates as in Fig. 4.
Discussion
This mixing study has quantified the marginal gains of group analysis performance in terms of activation, power and reliability as higher field strength (3T) data are added to a study otherwise conducted only at lower field strength (1.5T). This mixing study across field strengths has contributed to the growth of previous research on multicenter fMRI studies. Our study results of mixing subjects across field strengths allow researchers to increase sample size by including not only data from different manufactures and imaging protocols, but also different field strengths.
Fig. 2–8 demonstrate the expected finding that group analysis is superior at 3T than at 1.5T (5–10, 31). Interestingly, a 4/4 mixture was found to be a critical point beyond which increases in statistical power (i.e., CNR) were more prominent than expansion of the detected area of activation. Therefore, for binary detection (i.e., either active or non-active), 4/4 was arguably the minimum mixture level that was comparable to 3T-only group results.
Critically, differences observed in mixtures containing 1.5T data were primarily in missed detections rather than false positives. In Fig. 5 the primary difference between the 0/8 and 8/0 mixing combinations is mean Z-score value in the “active” (gold standard) region rather than a falsely elevated statistical mean in the “non-active” (i.e., noise) region. Therefore reduced sensitivity and extent of activation observed when incorporating lower field strength data is largely due to reduced detection power while retaining a measurable BOLD response. Fig. 6b suggests that including lower field strength data will yet increase detection power (i.e., achieve a higher TPR) through the larger sample size. For example, in an existing 1.5T study with 8 subjects, the addition of 1 or 2 3T subjects is quite helpful in terms of sensitivity. Similarly, the hypothetical case of combining several 1.5T pilot subjects with 8 subjects later acquired at 3T does not adversely affect the TPR obtained from the 3T data, alone.
While there is a drop in Roverlap from 0/8 to 2/6 (Fig. 7), this decrease is attributed here to the relatively small size of our 1.5T subject pool. As such, 40 out of 45 possible subject combinations were chosen for pair-wise Roverlap, which yields a high probability of overlap in the subjects present in any two combinations. In fact, each pair of the 10 pair-wise subject combinations exhibiting the highest Roverlap for 0/8 has 7 subjects in common across a pair of the combinations. Therefore, for the 0/8 case, the small subject pool at 1.5T led to insufficient randomness for these Roverlap values to be meaningfully contrasted with the other mixing combinations.
This study illustrates that some care should be taken when mixing data across field strengths, but this procedure need not be avoided. While a greater proportion of higher field strength data is generally advisable, Fig. 3b indicates that ROC performance overlap exists across mixtures. This non-monotonicity implies that some combinations of subjects markedly outperform others, presumably due to subject-dependent CNR. Therefore, procedures to optimize reliability across subjects will produce the best results regardless of field strength and will make a study (group or individual longitudinal) more robust to changes in imaging hardware and software.
While not directly assessed in this study, longitudinal studies are a common source of concern at the time of equipment changes. This study suggests that improvements in equipment will result in group analyses with better detection power without an increase in false detections. However, Greve and his colleagues (32) have concluded that voxel shifts by site-specific B0 distortion can affect registration to standardized templates and introduce variability to data, with voxel shifts as small as 2mm shifting activation off cortex. Therefore one must ensure that appropriate alignment and registration procedures are followed when group-based longitudinal studies span multiple hardware configurations.
Note that results obtained from this study do not represent a best-case scenario, such as may exist after an upgrade rather than replacement. Acquisitions at the tested field strengths involved different imaging protocols (e.g., coil, slice thickness), subjects and time intervals over which data were acquired. Several of these variations are not expected to be significant factors, given a common processing scheme (e.g., slice thickness (33), coil and pulse sequence (17), data acquisition interval (34) and combinations thereof (8, 10)). In a well-controlled setting where procedures may be held constant and system stability is monitored and can be verified equivalent across an upgrade, results from mixtures involving greater percentages of lower field strength data may be better than documented here.
In conclusion, this study qualitatively and quantitatively investigated auditory fMRI group analysis performance under conditions of a mixed pool of data acquired at two field strengths. ROC analysis and activation assessments indicate that results are reproducible across field strengths, and that an upgrade in system does not require that a group study be restarted. This study also implies that acquisition of data across multiple configurations need not harm group longitudinal studies. Critically, findings demonstrate that detections at lower field strengths are neither meaningless nor wrong since the statistical distributions in known-to-be activated areas are markedly different from non-activated areas. Rather, inclusion of data from a lower field strength in group analysis will only serve to limit detection power relative to a study conducted with only the higher field strength data, and does not inherently result in incorrect detection.
Acknowledgments
Grant support: NIH R01EB003990 and R03EB004855
Authors would like to thank Dr. Olumide Olulade for graciously providing data.
References
- 1.Lawrence LN, Tanenbaum N. 3T MRI in clinical practice. Appl Radiol. 2005;34:8–17. [Google Scholar]
- 2.Belliveau JW, Kennedy DN, Weisskoff RM, et al. Functional mapping of the human visual cortex by magnetic resonance imaging. Science. 1991;254:716–719. doi: 10.1126/science.1948051. [DOI] [PubMed] [Google Scholar]
- 3.Kwong KK, Belliveau JW, Chesler DA, et al. Dynamic magnetic resonance imaging of human brain activity during primary sensory stimulation. Proc Natl Acad Sci U S A. 1992;89:5675–5679. doi: 10.1073/pnas.89.12.5675. [DOI] [PMC free article] [PubMed] [Google Scholar]
- 4.Ogawa S, Tank D, Menon R, et al. Intrinsic signal changes accompanying sensory stimulation: functional brain mapping with magnetic resonance imaging. Proc Natl Acad Sci U S A. 1992;89:5951–5955. doi: 10.1073/pnas.89.13.5951. [DOI] [PMC free article] [PubMed] [Google Scholar]
- 5.Thulborn KR, Chang SY, Shen GX, Voyvodic JT. High-resolution echo-planar fMRI of human visual cortex at 3.0 Tesla. NMR Biomed. 1997;10:183–190. doi: 10.1002/(sici)1099-1492(199706/08)10:4/5<183::aid-nbm469>3.0.co;2-w. [DOI] [PubMed] [Google Scholar]
- 6.Paley M, Mayhew J, Martindale A, et al. Design and initial evaluation of a low-cost 3-Tesla research system for combined optical and functional MR imaging with interventional capability. J Magn Reson Imaging. 2001;13:87–92. doi: 10.1002/1522-2586(200101)13:1<87::aid-jmri1013>3.0.co;2-0. [DOI] [PubMed] [Google Scholar]
- 7.Kruger G, Kastrup A, Glover GH. Neuroimaging at 1.5 T and 3.0 T: comparison of oxygenation-sensitive magnetic resonance imaging. Magn Reson Med. 2001;45:595–604. doi: 10.1002/mrm.1081. [DOI] [PubMed] [Google Scholar]
- 8.Turner R, Jezzard P, Wen H, et al. Functional mapping of the human visual cortex at 4 and 1.5 Tesla using deoxygenation contrast EPI. Magn Reson Med. 1993;29:227–279. doi: 10.1002/mrm.1910290221. [DOI] [PubMed] [Google Scholar]
- 9.Gati JS, Menon RS, Ugurbil K, Rutt BK. Experimental determination of the BOLD field strength dependence in vessels and tissue. Magn Reson Med. 1997;38:296–302. doi: 10.1002/mrm.1910380220. [DOI] [PubMed] [Google Scholar]
- 10.Yang Y, Wen H, Mattay VS, Balaban RS, Frank JA, Duyn JH. Comparison of 3D BOLD functional MRI with spiral acquisition at 1.5 and 4.0 T. NeuroImage. 1999;9:446–451. doi: 10.1006/nimg.1998.0422. [DOI] [PubMed] [Google Scholar]
- 11.Van Horn JD, Toga AW. Multisite neuroimaging trials. Curr Opin Neurol. 2009;22:370–378. doi: 10.1097/WCO.0b013e32832d92de. [DOI] [PMC free article] [PubMed] [Google Scholar]
- 12.Sutton BP, Goh H, Hebrank A, Welsh R, Chee MWL, Park DC. Investigation and validation of intersite fMRI studies using the same imaging hardware. J Magn Reson Imaging. 2008;28:21–27. doi: 10.1002/jmri.21419. [DOI] [PMC free article] [PubMed] [Google Scholar]
- 13.Magnotta VA, Friedman L FBIRN. Mesaurement of signal-to-noise and contrast-noise in the fBIRN multicenter imaging study. J Digit Imaging. 2006;19:140–147. doi: 10.1007/s10278-006-0264-x. [DOI] [PMC free article] [PubMed] [Google Scholar]
- 14.Friedman L, Glover GH. Report on a multicenter fMRI quality assurance protocol. J Magn Reson Imaging. 2006;23:827–839. doi: 10.1002/jmri.20583. [DOI] [PubMed] [Google Scholar]
- 15.Friedman L, Glover GH FBIRN. Reducing interscanner variability of activation in a multicenter fMRI study: controlling for signal-to-fluctuation-noise-ratio (SFNR) differences. NeuroImage. 2006;33:471–481. doi: 10.1016/j.neuroimage.2006.07.012. [DOI] [PubMed] [Google Scholar]
- 16.Friedman L, Glover GH, Krenz D, Magnotta VA FBIRN. Reducing inter-scanner variability of activation in a multicenter fMRI study: role of smoothness equalization. NeuroImage. 2006;32:1656–1668. doi: 10.1016/j.neuroimage.2006.03.062. [DOI] [PubMed] [Google Scholar]
- 17.Friedman L, Stern H, Brown GG, et al. Test-retest and between-site reliability in a multicenter fMRI study. Hum Brain Mapp. 2008;29:958–972. doi: 10.1002/hbm.20440. [DOI] [PMC free article] [PubMed] [Google Scholar]
- 18.Bosnell B, Wegner C, Kincses ZT, et al. Reproducibility of fMRI in the clinical setting: implications for trial designs. NeuroImage. 2008;42:603–610. doi: 10.1016/j.neuroimage.2008.05.005. [DOI] [PubMed] [Google Scholar]
- 19.Suckling J, Ohlssen D, Andrew C, et al. Components of variance in a multicentre functional MRI study and implications for calculation of statistical power. Hum Brain Mapp. 2008;29:1111–1122. doi: 10.1002/hbm.20451. [DOI] [PMC free article] [PubMed] [Google Scholar]
- 20.Suckling J, Barnes A, Job D, et al. Power calculation for multicenter imaging studies controlled by the false discovery rate. Hum Brain Mapp. 2010;31:1183–1195. doi: 10.1002/hbm.20927. [DOI] [PMC free article] [PubMed] [Google Scholar]
- 21.Talavage TM, Ledden PJ, Benson RR, Rosen BR, Melcher JR. Frequency-dependent responses exhibited by multiple regions in human auditory cortex. Hear Res. 2000;150:225–244. doi: 10.1016/s0378-5955(00)00203-3. [DOI] [PubMed] [Google Scholar]
- 22.Cox RW. AFNI: software for analysis and visualization of functional magnetic resonance neuroimages. Comput Biomed Res. 1996;29:162–173. doi: 10.1006/cbmr.1996.0014. [DOI] [PubMed] [Google Scholar]
- 23.Talairach J, Tournoux P. Co-planar Sterotaxic Atlas of the Human Brain. New York: Thieme Medical; 1998. [Google Scholar]
- 24.Friston KJ, Holmes A, Worsley K, Poline J, Frith C, Frackowiak R. Statistical parametric maps in functional imaging: a general linear approach. Hum Brain Mapp. 1995;2:189–210. [Google Scholar]
- 25.Glover GH. Deconvolution of impulse response in event-related BOLD fMRI. NeuroImage. 1999;9:416–429. doi: 10.1006/nimg.1998.0419. [DOI] [PubMed] [Google Scholar]
- 26.Penny WD, Holmes AP. Random effects analysis. In: Friston KJ, Ashburner J, Kiebel S, Nichols T, Penny WD, editors. Statistical parametric mapping. London: Academic Press; 2007. pp. 156–165. [Google Scholar]
- 27.Fawcett T. An introduction to ROC analysis. Pattern Recognition Letters. 2006;27:861–874. [Google Scholar]
- 28.Rombouts SA, Barkhof F, Hoogenraad FG, Sprenger M, Scheltens P. Within-subject reproducibility of visual activation patterns with functional magnetic resonance imaging using multislice echo planar imaging. Magn Reson Imaging. 1998;16:105–113. doi: 10.1016/s0730-725x(97)00253-1. [DOI] [PubMed] [Google Scholar]
- 29.Gonzalez Castillo J, Talavage TM. Reproducibility of fMRI activations associated with auditory sentence comprehension. NeuroImage. 2011;54:2138–2155. doi: 10.1016/j.neuroimage.2010.09.082. [DOI] [PMC free article] [PubMed] [Google Scholar]
- 30.Olulade O, Hu S, Tamer GG, Luh WM, Talavage TM. State-dependence of fMRI auditory cortex responses to desired and undesired acoustic stimuli. Proceedings of the 16th annual meeting of the organization for Human Brain Mapping; June, 2010; Barcelona, Spain. (abstract 2444). [Google Scholar]
- 31.Krasnow B, Tamm L, Greicius MD, et al. Comparison of fMRI activation at 3 and 1.5 T during perceptual, cognitive, and affective processing. NeuroImage. 2003;18:813–826. doi: 10.1016/s1053-8119(03)00002-8. [DOI] [PubMed] [Google Scholar]
- 32.Greve D, Mueller B, Brown G, Liu T, Glover GH FBIRN. Processing methods to reduce intersite variability in fMRI. Proceedings of the 16th annual meeting of the organization for Human Brain Mapping; June, 2010; Barcelona, Spain. (abstract 1318). [Google Scholar]
- 33.Howseman AM, Grootoonk S, Porter DA, Ramdeen J, Holmes AP, Turner R. The effect of slice order and thickness on fMRI activation data using multislice echo-planar imaging. NeuroImage. 1999;9:363–376. doi: 10.1006/nimg.1998.0418. [DOI] [PubMed] [Google Scholar]
- 34.Aron AR, Gluck MA, Poldrack RA. Long-term test-retest reliability of functional MRI in a classification learning task. NeuroImage. 2006;29:1000–1006. doi: 10.1016/j.neuroimage.2005.08.010. [DOI] [PMC free article] [PubMed] [Google Scholar]


