Abstract
Telapristone is a selective progesterone antagonist that is being developed for the long-term treatment of symptoms associated with endometriosis and uterine fibroids. The population pharmacokinetics of telapristone (CDB-4124) and CDB-4453 was investigated using nonlinear mixed-effects modeling. Data from two clinical studies (n = 32) were included in the analysis. A two-compartment (parent) one compartment (metabolite) mixture model (with two populations for apparent clearance) with first-order absorption and elimination adequately described the pharmacokinetics of telapristone and CDB-4453. Telapristone was rapidly absorbed with an absorption rate constant (Ka) of 1.26 h−1. Moderate renal impairment resulted in a 74% decrease in Ka. The population estimates for oral clearance (CL/F) for the two populations were 11.6 and 3.34 L/h, respectively, with 25% of the subjects being allocated to the high-clearance group. Apparent volume of distribution for the central compartment (V2/F) was 37.4 L, apparent inter-compartmental clearance (Q/F) was 21.9 L/h, and apparent peripheral volume of distribution for the parent (V4/F) was 120 L. The ratio of the fraction of telapristone converted to CDB-4453 to the distribution volume of CDB-4453 (Fmetest) was 0.20/L. Apparent volume of distribution of the metabolite compartment (V3/F) was fixed to 1 L and apparent clearance of the metabolite (CLM/F) was 2.43 L/h. A two-compartment parent-metabolite model adequately described the pharmacokinetics of telapristone and CDB-4453. The clearance of telapristone was separated into two populations and could be the result of metabolism via polymorphic CYP3A5.
KEY WORDS: CDB-4453, mixture model, parent-metabolite, population pharmacokinetics, telapristone (CDB-4124)
INTRODUCTION
Over the last 25 years, several progesterone receptor antagonists have been evaluated for the treatment of progesterone-dependent diseases such as endometriosis and uterine leiomyoma (1). However, many of the potential candidates also exhibited potent antiglucocorticoid activity (1,2). Additional anti-progestins have been synthesized and tested in order to identify candidates that are progesterone antagonist with little to no antiglucocorticoid activity. Telapristone (US adopted name: telapristone acetate) was one of the compounds developed by the Contraception and Reproductive Health Branch (National Institute of Child Health and Human Development) for the chronic treatment of symptoms associated with endometriosis and leiomyoma (3).
Telapristone opposes progesterone action at the molecular and receptor level, and has been shown in animals to exhibit potent anti-progesterone effects. Administration of telapristone to endometriosis-induced cynomolgus monkeys demonstrated that telapristone lead to reduction in the height and development of the endometrium as well as changes in the mitotic index, glands and stroma. It was also noted that telapristone was not associated with any antiglucocorticoid activity, as shown by a lack of measurable increase in serum cortisol. Clinical evaluation of hormone levels and ovulation showed that telapristone did not affect serum estrogen or progesterone and did not appear to affect ovulation when used once every 7 days.
A phase I/II study (ZN001) in pre-menopausal women (n = 30) with symptomatic leiomyoma was completed (Trial identification number: CTNNCT01069094). It consisted of a single-dose pharmacokinetic arm (telapristone only) followed by a randomized, double-blind, placebo-controlled safety trial of three doses of telapristone (12.5, 25, and 50 mg) given once a day for 3 months and intramuscular (3.75 mg) Lupron Depot (leuprolide acetate) given once a month for 3 months. Single-dose pharmacokinetic results showed a bi-phasic decline in concentration for all subjects. Telapristone was rapidly absorbed reaching peak levels in 0.5–2 h. Telapristone exhibited linear kinetics over the dose ranges tested. Overall findings were more favorable to the telapristone treatment groups, particularly the 50 mg when compared with Lupron Depot and placebo. Telapristone subjects experienced fewer bleeding days as well as a greater reduction in global tumor size (4).
The reduced antiglucocorticoid activity (5), indications that physiologic concentrations of estrogen are preserved and results from efficacy trials for both uterine fibroids and endometriosis (4,7–9), suggest that telapristone may offer advantages in both safety and efficacy that other currently available treatments do not.
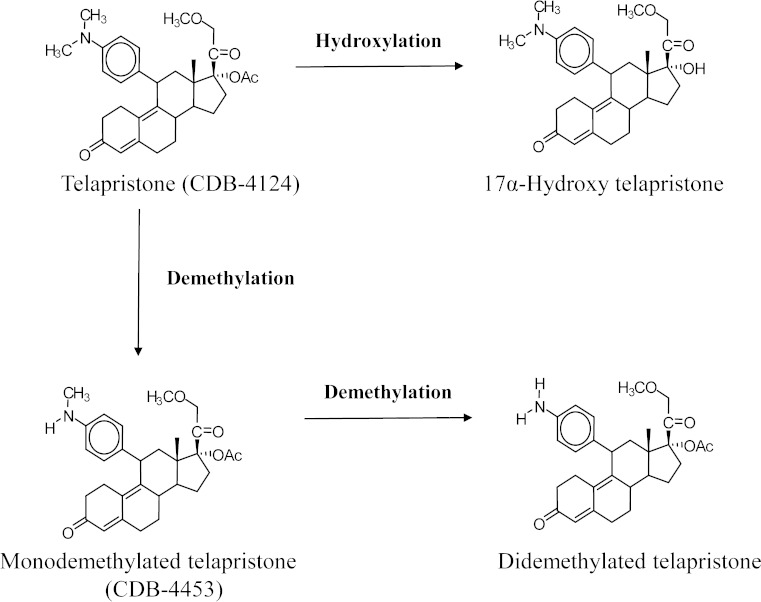
Data in mice indicates that telapristone is primarily metabolized in the liver. It has been proposed that telapristone (Fig. 1) undergoes demethylation to produce mono (CDB-4453) and didemethylated metabolites as well as hydroxylation of the propynyl group to produce the hydroxylated metabolite. Like mifepristone, it is proposed that metabolism of telapristone to the monodemethylated and hydroxylated metabolite is rapid, but formation of the didemethylated metabolite occurs more slowly and to a much lesser extent (6,10,11). Out of the three characterized metabolites, in vitro data indicated that CDB-4453 was equipotent to CDB-4124 as an anti-progesterone. In addition, a study evaluating the in vitro activity of CDB-4453 showed that it had less antiglucocorticoid activity than telapristone (5,6). Since CDB-4453 and telapristone share similar anti-progestational activity in vitro, the presence of CDB-4453 might contribute significantly to the in vivo anti-progesterone activity of telapristone. Therefore, it is important to understand the kinetics of both telapristone and CDB-4453.
Fig. 1.
Proposed metabolism of telapristone
Information pertaining to the pharmacokinetics and sources of variability within parameter estimates for telapristone and CDB-4453 is limited. The aim of this analysis was to develop a pharmacokinetic model for telapristone and CDB-4453, evaluate the effects of covariates on the interindividual variability associated with parameters, and simulate concentration time profiles of telapristone and CDB-4453 in order to assess the range of variability in pharmacokinetic parameters.
MATERIALS AND METHODS
Description of Studies
Study ZP-005 was a phase I/II, open-label study to evaluate the safety and pharmacokinetics of telapristone in female patients with moderate hepatic impairment (meeting the Child–Pugh class B severity criteria) versus healthy volunteers. Patients and volunteers received a single oral dose of 25 mg of telapristone acetate (fasted) followed by 50 mg of telapristone acetate (fasted) after a 14-day washout period (Trial identification number: NCT00741273).
Study ZP-006 was a phase I/II single-dose open-label parallel study to evaluate the pharmacokinetics and safety profile of telapristone in female patients with mild and moderate renal impairment versus healthy volunteers. Subjects received a single oral dose of 50 mg of telapristone acetate (fasted) (Trial identification number: NCT00787618).
Pharmacokinetic samples for both studies were taken at pre-dose, 0.25, 0.5, 0.75, 1, 1.5, 2, 2.5, 3, 5, 7, 9, 12, 16, 20, 24, 28, 32, 36, 40, 44, and 48 h postdose.
All protocols, amendments, and informed consent forms were reviewed and approved by an Institutional Review Board (IRB) at each study site. The study did not start until the IRB had approved the protocol or a modification. The IRB was constituted and operated in accordance with the principles and requirements described in the US Code of Federal Regulations (21 CFR Part 56).
Bioanalytical Methods
Plasma samples were analyzed for both telapristone and CDB-4453 using LC/MS/MS. Sample analysis involved the extraction of telapristone or CDB-4453, and the internal standard mifepristone, using protein precipitation. This extract was then subjected to reverse-phase high-performance liquid chromatography on an Aquasil C18 column and detection of the analytes by tandem mass spectroscopy using the Sciex API3000 LC/MS/MS. The lower limit of quantification was 5 ng/mL. The coefficient of variation for intra-assay precision and accuracy ranged from 1.5% to 4.7% and −1.0% to 5.5%, respectively. This method was previously validated over the range of 5.00–1,000 ng/mL with 100-μl aliquot volume.
Data Analysis
Population Pharmacokinetic Analysis
Data Handling
Due to the difference in molecular weight of telapristone (505.6 g/mol; http://www.ama-assn.org/resources/doc/usan/telapristone-acetate.pdf) and CDB-4453, concentrations of telapristone and CDB-4453 were converted to equivalent nanomoles per liter. Concentrations of telapristone and CDB-4453 were also log-transformed before the analysis. All concentration values below the quantification limit (BQL) of the assay were excluded from the pharmacokinetic analysis.
Base Pharmacokinetic Model
Non-linear mixed-effect model building was conducted using NONMEM® 7 (ICON Development Solutions, Ellicott City, MD, USA) (12) with G95 Fortran compiler (Free Software Foundation, Boston, MA, USA). All models were fitted using the first-order conditional estimation method. Output was processed using PDx-Pop 4.0 (ICON Development Solutions, Ellicott City, MD, USA) and Xpose version 4.0 (Uppsala University, Uppsala, Sweden) (13). Graphical plots were produced using S-PLUS version 8.1 (TIBCO, Somerville, MA, USA) and R 2.11.1 (Free Software Foundation, Boston, MA, USA). Model selection was guided by the plausibility of the estimates, minimum objective function value (MOFV), Akaike Information Criterion, condition number, visual inspection of diagnostic plots and the precision of parameter estimates.
Based on visual inspection of the concentration-time profiles of telapristone and CDB-4453, and previously published data (4), two- and three-compartment pharmacokinetic models for the parent and one- and two-compartment models for the metabolite were fitted to the data simultaneously to determine the best structural model. Elimination was assumed to occur from the central compartment as a first order process, and conversion of telapristone to CDB-4453 was considered to be an irreversible process.
Interindividual variability (IIV) of the pharmacokinetic parameters was modeled assuming a log-normal distribution, as follows:
 |
Where P i is the estimated parameter value for individual i, P pop represents the typical population estimate for the parameter and η i is the deviation of P i from P pop. The η random effects were assumed to be independent and symmetrically distributed with a mean of zero and variance ω2. The magnitude of IIV was expressed as coefficient of variation (%CV).
Residual variability (RV) was modeled using a log error model as shown below:
 |
Where Cij and Cpred,ij represent the jth observed and model predicted telapristone or CDB-4453 concentrations, respectively, for individual i. ε ij denotes the additive residual random error for individual i and observation j. The ε random effects were assumed to be independent and symmetrically distributed with mean of zero and variance σ2.
Covariate Analysis
Covariate analysis was performed in order to identify additional variables that might be able to explain the variability seen in the parameter estimates of the base model. Continuous covariates available for screening were age, weight, height, BMI, aspartate aminotransferase (AST) and alanine aminotransferase (ALT), and creatinine clearance (CrCl). Categorical covariates available were hepatic and renal impairment status. Covariates were initially screened for inclusion using visual inspection of the IIV versus covariates plots and generalized additive modeling using Xpose. The potential covariates were then tested for statistical significance using the stepwise forward addition, followed by stepwise backward elimination procedure (14). An MOFV change of 3.84 (corresponding to a significance level of 5% at 1 degree of freedom) was used as the cutoff to include a covariate in stepwise forward addition. For a covariate to remain in the model during backward elimination, a change in MOFV of at least 10.83 (corresponding to a significance level of 0.1% at 1 degree of freedom) was needed. An improvement in the precision of the parameter estimate (relative standard error), and reduction in intersubject and residual variability were also used to determine the importance of the covariate as a predictor.
Mixture Model
Comparison of total clearance of telapristone, via noncompartmental analysis, showed that generally, subjects could be separated into two clearance groups based on metabolic ratios (Fig. 2). The reason for the differences seen in clearance is unknown. Since inclusion of covariates did not account for the differences seen in total clearance of telapristone, a mixture model (using the $MIXTURE subroutine in NONMEM©) was employed in order to model two subpopulations for total clearance of telapristone. Because the NONMEM© output results only gives the overall probability of being in a particular group, individual objective value contributions were used to evaluate the probability of a subject being in each population. This was done using the method published by Carlsson et al. (15). Where:
 |
the individual’s contribution to the objective function value (OFVi) and estimated probability (P) evaluated for all populations (pop, k) was used to calculate that individual’s likelihood (ILi). These values were then used to calculate the individual’s probability of belonging to either population (IPk).
Fig. 2.
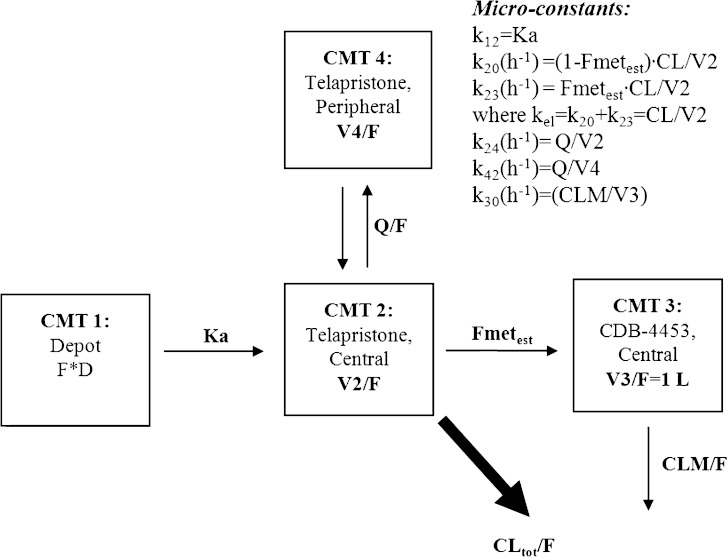
Pharmacokinetic model for telapristone and CDB-4453, where F is the oral bioavailability, Ka is the absorption rate constant, CL/F is telapristone oral clearance, V2/F is the apparent volume of distribution for the central compartment of telapristone, V4/F is the apparent volume of distribution for the peripheral compartment for telapristone, Q/F is the apparent intercompartmental clearance for telapristone, Fmet true is the true fraction of telapristone converted to CDB-4453, Fmet est is the true fraction of telapristone converted to CDB-4453 to distribution volume of CDB-4453 (Fmettrue/V3app), V3/F is the apparent volume of distribution for CDB-4453 (V3app), and CLM/F is the apparent clearance of CDB-4453
Model Evaluation
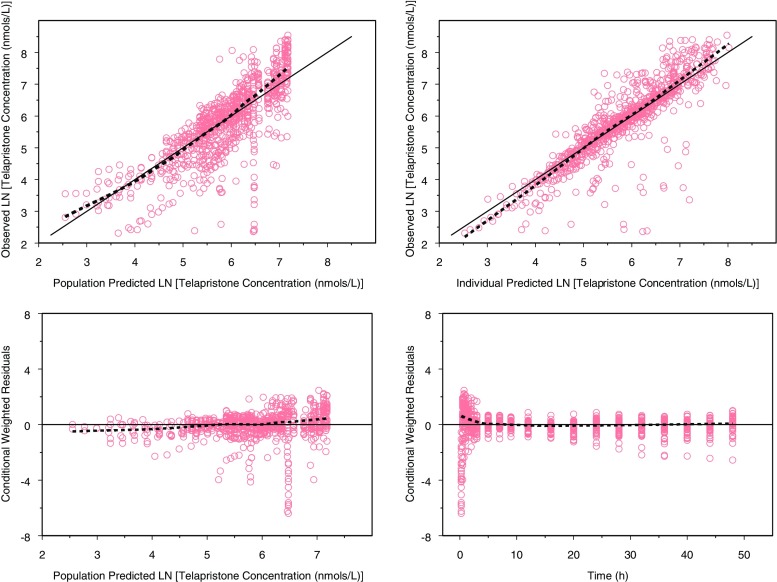
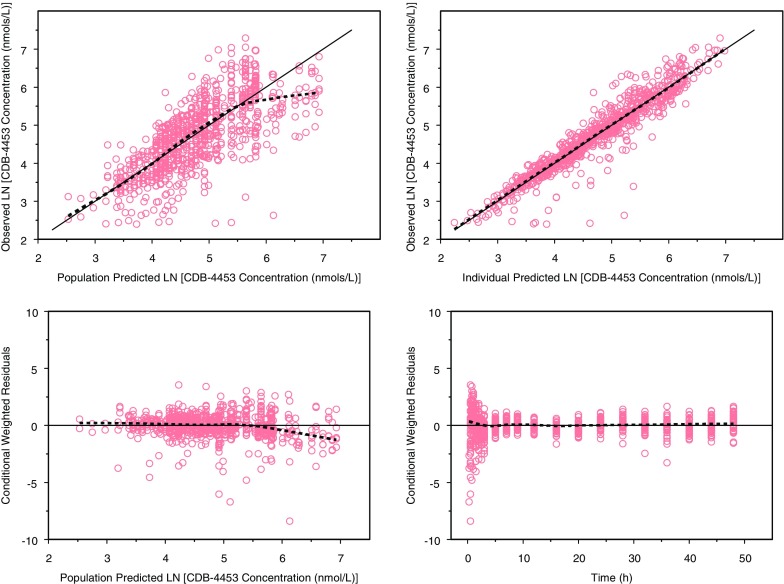
Diagnostic plots used to assess model goodness-of-fit included observed concentrations versus population predictions (PRED), observed concentrations versus individual predictions (IPRED), conditional weighted residuals (CWRES) versus PRED, and CWRES versus time.
The standard errors of the final model parameter values were estimated using the non-parametric bootstrap approach in Perl-speaks-NONMEM© (PsN©) (16). For the final model, 500 bootstrap datasets were generated. The mean and 95% confidence intervals for the population pharmacokinetic parameters were calculated, and compared with the estimates from the final model. The bootstrap 95% confidence interval was calculated based on the percentile of the empirical distribution of the estimated parameters from the bootstrap runs.
Model Prediction
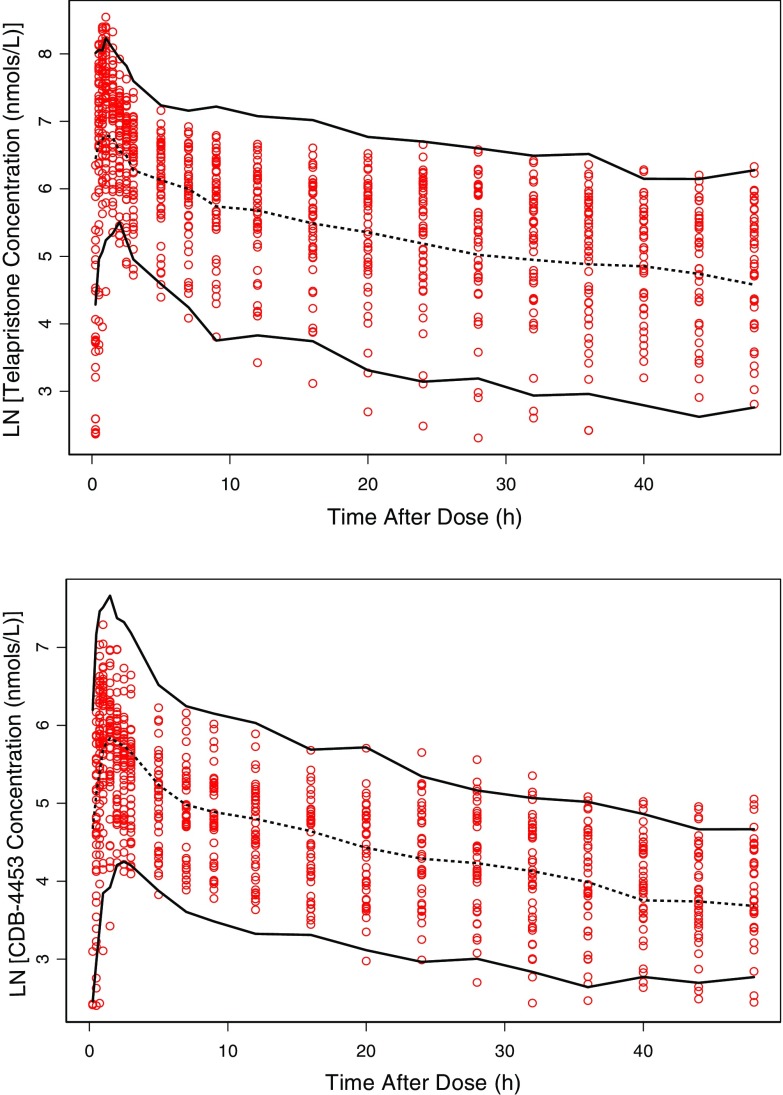
Visual predictive check was performed to evaluate the predictive ability of the final model. One thousand virtual observations at each sampling time point for the full dataset (including time points for BQL data) were simulated using the final model parameter estimates. The observed data were then plotted with the median and 90% prediction interval of the simulated data. Simulated concentrations below the quantification limit (BQL) were excluded, and not used in the calculation of the prediction intervals.
Secondary Parameters
Secondary parameters for each individual were calculated using maximum a posteriori Bayesian estimates for each individual. The equations below were used to calculate secondary parameters:
 |
Simulations
Monte Carlo simulations were performed in order to reflect the expected range of variability in concentration values using the final model parameter estimates. Since telapristone is being developed for the chronic treatment of endometriosis and uterine fibroids, 500 simulations of telapristone and CDB-4453 were performed at steady state, 25 mg. Total concentration (nanomoles per liter) of telapristone and CDB-4453 were used in the analysis since CDB-4453 is an active metabolite with possible equipotent anti-progestational activity in vivo.
RESULTS
Dataset
Demographic and clinical data for subjects enrolled in both studies are provided in Table I. There were a total of 1,805 concentration measurements for studies ZP-005 and ZP-006. Ninety (5.0%) concentration measurements of telapristone and CDB-4453 were BQL.
Table I.
Summary of Demographic and Clinical Data for Studies ZP-005 and ZP-006
| STUDY | |||
|---|---|---|---|
| ZP-005 | ZP-006 | ZP-005/006 | |
| Age, years | 46 (35–61) | 55 (42–66) | 52.5 (35–66) |
| Median (range) | |||
| Weight, kg | 77.3 (54.1–94.1) | 70.6 (52.3–102.3) | 71.65 (52.3–102.3) |
| Median (range) | |||
| Height, cm | 163 (158–172.7) | 162.6 (149–176.4) | 162.6 (149–176.4) |
| Median (range) | |||
| BMI, kg/m2 | 28 (21–36) | 27 (20–34) | 27 (20–36) |
| Median (range) | |||
| Baseline ALT, U/L | 35 (17–85) | 20 (7–46) | 23.5 (7–85) |
| Median (range) | |||
| Baseline AST, U/L | 40 (25–99) | 21 (16–32) | 24.5 (16–99) |
| Median (range) | |||
| Baseline CrCl, mL/min | 121.2 (78.7–176.9) | 73.1 (30–105) | 91.45 (30–176.9) |
| Median (range) | |||
| Healthy (n) | 4 | 9 | 13 |
| Moderate hepatic impairment (Child–Pugh class B) | 7 | – | 7 |
| Mild renal impairment (CrCl = 50–80 mL/min) | – | 6 | 6 |
| Moderate renal impairment (CrCl = 30–50 mL/min) | – | 6 | 6 |
BMI body mass index, ALT alanine aminotransferase, AST aspartate aminotransferase, CrCl creatinine clearance
Population Pharmacokinetic Analysis
Model Development
The final base model, shown in Fig. 2, was a two-compartment parent, one-compartment metabolite mixture model with first-order absorption without lag and first-order elimination. The model was parameterized in terms of absorption rate constant (K a), oral clearance (CL/F), apparent volume of distribution of the central compartment (V2/F), apparent peripheral volume of distribution for the parent (V4/F) apparent inter-compartmental clearance (Q/F), and apparent clearance of CDB-4453 (CLM/F).
Since CDB-4453 was not administered alone and the true fraction of telapristone converted to CDB-4453 (Fmet) is unknown, Fmet and V3/F are unidentifiable. Hence, the apparent volume of distribution of the metabolite (V3/F) was fixed to 1 L (17). Because V3/F (V app) was fixed to 1 L, estimated Fmetest was then interpreted as the ratio of the fraction of telapristone converted to CDB-4453 to the distribution volume of CDB-4453 (Fmet/V3app).
Covariate Analysis
Renal and hepatic insufficiency, age, weight, height, BMI, ALT, and AST were tested for significance as covariates. Moderate renal impairment was found to be the only significant covariate and was incorporated using a proportional covariate model.
 |
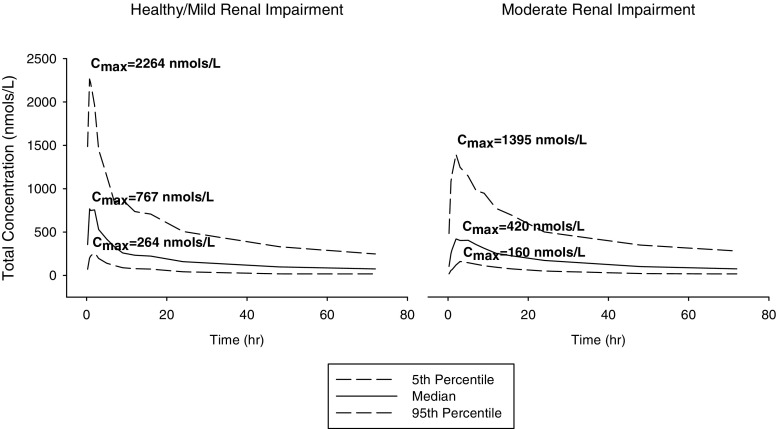
Where θ 1 was the estimated value for absorption rate constant in healthy and mild renal-impaired subjects (RENAL = 0) and θ 2 is the proportional constant for the presence of moderate renal impairment (RENAL = 1). Inclusion of moderate renal impairment resulted in a 74% decrease in absorption rate constant when compared to healthy and mild renal impairment. Stochastic simulation of concentration time profiles for moderate renal impaired and healthy/mild renal impaired subjects showed that there was on average a lower total C max in subjects with moderate renal impairment (Fig. 3). In addition, evaluation of post hoc estimates showed the moderate renal-impaired subjects had a mean K a value of 0.36 ± 0.20 h−1 and healthy/mild renal-impaired subjects had a mean K a value of 1.27 ± 0.36 h−1. It should be noted that there was only limited data available on mild (n = 6) and moderate (n = 6) renal-impaired subjects.
Fig. 3.
Simulated concentration time profile for moderate renal impaired and healthy/mild renal impaired subjects at 25 mg
Mixture Model
Incorporation of a mixture model for total clearance of telapristone resulted in a 3.15-drop in the MOFV and IIV to decrease by 26.1% when compared to the non-mixture model. The population estimates for apparent oral clearance (CL/F) for the two populations were 11.6 and 3.37 L/h, respectively. Elimination half-life for the high- and low-clearance group was 12 and 35 h, respectively. The probability of being in the high-clearance group was 0.251, and the low-clearance group was 0.749. Assessment of the individual population probabilities showed that most subjects were separated into their respective clearance groups with very high probability.
Model Evaluation
The population pharmacokinetic parameters along with standard errors, interindividual variability, and residual variability are presented in Table II. Basic goodness-of-fit plots for telapristone and CDB-4453 are presented in Figs. 4 and 5. Overall, the model adequately described the data. There appeared to be some bias in the predictions of telapristone concentrations at the earlier time points, but evaluation of other types of absorption profiles (first order with lag, mixed, parallel, and Weibull) lead to model instability, decrease in precision of parameter estimates, and/or unreasonable parameter estimates.
Table II.
Pharmacokinetic Parameter Estimates, Standard Errors, and Bootstrap Results for Final Model
| Parameter | Estimate | %RSE | Bootstrap estimate (standard error) | Bootstrap estimate (95% CI) |
|---|---|---|---|---|
| CL/F (L/h)—high clearance | 11.6 | 36.0 | 12.8 (4.63) | (6.50–24.28) |
| CL/F (L/h)—low clearance | 3.34 | 19.1 | 3.31 (0.637) | (2.42–4.67) |
| V2/F (L) | 37.4 | 10.2 | 37.5 (3.83) | (30.4–46) |
| V3/F (L) | 1 | – | – | – |
| V4/F (L) | 120 | 12.4 | 123 (15.92) | (94.6–156) |
| Q/F (L/h) | 21.9 | 14.4 | 22.3 (3.28) | (16.1–29.0) |
| Ka (h−1) | 1.26 | 7.21 | 1.27 (0.102) | (1.10–1.51) |
| Moderate renal impairment on Ka | −0.744 | 11.6 | −0.722 (0.174) | (−0.874–(−0.391)) |
| Fmetest (L−1) | 0.201 | 16.8 | 0.201 (0.032) | (0.137–0.267) |
| CLM/F (L/h) | 2.43 | 15.1 | 2.41 (0.343) | (1.73–3.14) |
| Probability | 0.251 | 61.0 | 0.278 (0.131) | (0.038–0.534) |
| IIV (variances and %CV) | ||||
| IIV-CL/F | 0.200 (44.7) | 43.4 | 0.163 (0.073) | (0.046–0.318) |
| IIV-V2/F | 0.443 (66.6) | 29.1 | 0.434 (0.142) | (0.207–0.739) |
| IIV-V4/F | 0.426 (65.3) | 33.3 | 0.416 (0.144) | (0.165–0.736) |
| IIV-Q/F | 0.457 (67.6) | 31.9 | 0.432 (0.145) | (0.160–0.731) |
| IIV-Ka | 0.280 (52.9) | 45.7 | 0.263 (0.127) | (0.433–0.557) |
| IIV-Fmetest | 0.196 (44.3) | 22.5 | 0.189 (0.044) | (0.109–0.282) |
| RV (log error) | ||||
| Telapristone (nmol/L) | 0.378 | 15.8 | 0.378 (0.061) | (0.267–0.516) |
| CDB-4453 (nmol/L) | 0.109 | 18.6 | 0.109 (0.020) | (0.073–0.156) |
Fig. 4.
Goodness-of-fit plots for telapristone (dashed lines are smoothing lines and solid lines are lines of identity)
Fig. 5.
Goodness-of-fit plots for CDB-4453 (dashed lines are smoothing lines and solid lines are lines of identity)
The parameter estimates with standard error and 95% confidence interval generated from the bootstrap method are presented in Table II. Ninety-nine percent of the runs converged successfully. The parameter estimates obtained from the final model were reasonably close to the ones obtained from the bootstrap analysis. All the parameter estimates from the final model were also contained within the 95% bootstrap intervals. For the visual predictive check, 7.95% of the telapristone observations and 6.00% of CDB-4453 observations were not contained within the 90% prediction interval (Fig. 6).
Fig. 6.
Visual predictive check for telapristone and CDB-4453: Observed concentration (open circles), 50th percentile (dashed line), and 90% prediction interval (solid lines)
Simulations
For steady-state simulation of telapristone and CDB-4453, total Cmax, and AUC0–24 were higher in the low-clearance group (Table III).
Table III.
Steady State Pharmacokinetic Parameters (Using Total Concentration of Telapristone and CDB-4453) for 500 Simulated Subjects at 25 mg
| 25 mg Steady state | ||
|---|---|---|
| Parameter | Median | 5th and 95th Percentiles |
| High-clearance group | ||
| C max (nmol/L) | 1,273 | 538–2,750 |
| T max (h) | 2.00 | 0.750–7.00 |
| AUCtot 0–24 (nmol*h/L) | 9,141 | 5,507–16,288 |
| Low-clearance group | ||
| C max (nmol/L) | 2,308 | 1,099–5,266 |
| T max (h) | 2.00 | 0.25–16 |
| AUCtot 0–24 (nmol*h/L) | 22,458 | 11,238–46,691 |
DISCUSSION
A two-compartment (parent) one-compartment (metabolite) mixture model with first-order absorption and elimination adequately described the pharmacokinetics of telapristone and CDB-4453. There appeared to be some bias in the predictions of telapristone concentrations at the earlier time points such that concentrations were underpredicted. Inspection of individual concentration time profiles (observed, individual-predicted, and population-predicted values) did not show any systematic biases; however, there were some subjects that appeared to exhibit a lag time while others did not.
Since Fmetest (Fmet/Vapp) was estimated to be 0.20 L−1, and Fmet can be no greater than 1; the apparent volume of distribution of the metabolite (V3/F) cannot be greater than 5 L. Therefore, it appears that the central volume of distribution of the metabolite is smaller than that of the parent. The removal of methyl group from a parent compound could lead to a more polar metabolite. Therefore, the smaller volume of distribution of CDB-4453 could be due to increased hydrophilicity as a result of the removal of the methyl group.
The only significant covariate found in this analysis was moderate renal impairment on absorption rate constant. The effect of renal impairment on absorption rate constant has been reported previously in literature (18–22). Changes in the gastrointestinal tract as a result of renal insufficiency could result in delayed gastric emptying. This, in turn, can lead to a decrease in the rate of absorption of the drug, and hence increase time to reach maximal concentration (Tmax). Although delayed gastric emptying can lead to an increase in Tmax, it generally does not affect the extent of absorption (22–24). A delay in Tmax might be problematic in drugs that are administered acutely, as the onset of a response might be delayed. However, for chronic treatment, as is the case of telapristone, the effect of a decrease in absorption rate constant might be clinically irrelevant. Since creatinine clearance did not meet the inclusion criteria to be tested as a covariate, it is believed that the effect of moderate renal impairment is not directly related to the disease state (e.g., changes in glomerular filtration rate). Rather, it might be a reflection of other pathophysiological states precluding or resulting from chronic renal impairment. The lack of significance of hepatic impairment as a covariate is important since it is believed that the majority of telapristone is primarily metabolized in the liver. This suggests that dosage adjustment may not be required on a pharmacokinetic basis in patients with mild or moderate hepatic impairment. Although the ranges of values for the covariates tested were wide, the sample size was very small. Therefore, a larger sample size might be required to detect additional covariate effects.
The detection of two subpopulations for total clearance might reflect the polymorphic metabolism of telapristone to CDB-4453. The percentage of the population in the low- and high-clearance groups was 75% and 25%, respectively. Since it is proposed that telapristone utilizes the same metabolic pathways as mifepristone (10,11), the cytochrome P450 (CYP) that would be responsible for production of the major metabolites of telapristone is CYP3A4 and 3A5. Even though there is known pharmacokinetic interindividual variability in drugs that are substrates for CYP3A4, there are no known polymorphisms that result in phenotypic differences in drug metabolism (25,26). On the other hand, CYP3A5 is known to be polymorphic and have overlapping substrates with CYP3A4 (26–28). Studies show that functioning CYP3A5 is present in 10–40% of the Caucasian population, approximately 50% of African Americans, and about 33% of Asians (26,29,30). Individuals that express CYP3A5 also express CYP3A4 and it is believed that the presence of both of these CYPs lead to an increase in clearance of drugs that are substrates for both enzymes (26). Based on the percentages of the study population in the high- and low-clearance groups, it is hypothesized that, like mifepristone, telapristone is both a substrate for CYP3A4 and CYP3A5. Additional studies are needed to evaluate telapristone metabolic pathways.
Because telapristone acetate is being developed for the chronic treatment of symptoms associated with leiomyoma and endometriosis, steady-state simulations are important for evaluating the pharmacokinetics of telapristone and CDB-4453. The resulting higher total C max and AUC0–24 in the low-clearance group compared to the high-clearance group at steady state could be the result of the longer half-life of telapristone seen in the low-clearance group. A longer half-life could lead to greater accumulation of the drug. Therefore, the presence of two groups for total clearance may play an important role in the efficacy/toxicity of telapristone and CDB-4453 with long-term treatment.
CONCLUSIONS
In conclusion, a parent-metabolite mixture model adequately described the pharmacokinetics of telapristone and CDB-4453 after oral administration. Inclusion of a mixture model resulted in detection of two subpopulations for the total clearance of telapristone. Inclusion of renal impairment as a covariate resulted in a decrease in the absorption rate constant of telapristone. It is believed that the significance of moderate renal impairment on absorption rate constant was not directly attributed to renal impairment (in terms of decrease glomerular filtration rate/changes in creatinine clearance). Rather, the changes in absorption rate constant, was attributed to some other disease precluding/resulting in renal impairment or other pathophysiologic states induced by renal impairment (e.g., delayed gastric emptying as a result of diabetes).
Conflict of Interest
Joseph Podolski, Alan Kirsch, and Ronald Wiehle are employees of Repros Therapeutics.
Open Access
This article is distributed under the terms of the Creative Commons Attribution Noncommercial License which permits any noncommercial use, distribution, and reproduction in any medium, provided the original author(s) and source are credited.
REFERENCES
- 1.Jang GR, Benet LZ. Antiprogestin pharmacodynamics, pharmacokinetics, and metabolism: implications for their long-term use. J Pharmacokinet Biopharm. 1997;25(6):647–672. doi: 10.1023/A:1025725716343. [DOI] [PubMed] [Google Scholar]
- 2.Neef G, Beier S, Elger W, Henderson D, Wiechert R. New steroids with antiprogestational and antiglucocorticoid activities. Steroids. 1984;44(4):349–372. doi: 10.1016/S0039-128X(84)80027-6. [DOI] [PubMed] [Google Scholar]
- 3.Contraceptive and Reproductive Health Branch, NICHD, Report to the National Advisory Child Health and Human Development Council. http://www.nichd.nih.gov/publications/pubs/upload/CRHB-council-report-June-2008.pdf. Updated 2008. Accessed September, 2010.
- 4.Wiehle RD, Goldberg J, Brodniewicz T, Jarus-Dziedzic K, Jabiry-Zieniewicz Z. Effects of a new progesterone receptor modulator, CDB-4124, on fibroid size and uterine bleeding. US Obstet Gynecol. 2008;3:17–20. [Google Scholar]
- 5.Attardi BJ, Burgenson J, Hild SA, Reel JR, Blye RP. CDB-4124 and its putative monodemethylated metabolite, CDB-4453, are potent antiprogestins with reduced antiglucocorticoid activity: in vitro comparison to mifepristone and CDB-2914. Mol Cell Endocrinol. 2002;188(1–2):111–123. doi: 10.1016/S0303-7207(01)00743-2. [DOI] [PubMed] [Google Scholar]
- 6.Attardi BJ, Burgenson J, Hild SA, Reel JR. In vitro antiprogestational/antiglucocorticoid activity and progestin and glucocorticoid receptor binding of the putative metabolites and synthetic derivatives of CDB-2914, CDB-4124, and mifepristone. J Steroid Biochem Mol Biol. 2004;88(3):277–288. doi: 10.1016/j.jsbmb.2003.12.004. [DOI] [PubMed] [Google Scholar]
- 7.Spitz IM. Clinical utility of progesterone receptor modulators and their effect on the endometrium. Curr Opin Obstet Gynecol. 2009;21(4):318–324. doi: 10.1097/GCO.0b013e32832e07e8. [DOI] [PubMed] [Google Scholar]
- 8.Spitz I.M., Wiehle R.D., van As A. Progesterone receptor modulators in endometriosis: A new therepeutic option. In: Gracia-Valesco J, Rizk B,RMB., eds. Endometriosis Current Management and Future Trends. India: Jaypee Brpthers Medical Publishers Ltd; 2009:226.
- 9.Ioffe OB, Zaino RJ, Mutter GL. Endometrial changes from short-term therapy with CDB-4124, a selective progesterone receptor modulator. Mod Pathol. 2009;22(3):450–459. doi: 10.1038/modpathol.2008.204. [DOI] [PubMed] [Google Scholar]
- 10.Jang GR, Wrighton SA, Benet LZ. Identification of CYP3A4 as the principal enzyme catalyzing mifepristone (RU 486) oxidation in human liver microsomes. Biochem Pharmacol. 1996;52(5):753–761. doi: 10.1016/0006-2952(96)00357-7. [DOI] [PubMed] [Google Scholar]
- 11.Khan KK, He YQ, Correia MA, Halpert JR. Differential oxidation of mifepristone by cytochromes P450 3A4 and 3A5: selective inactivation of P450 3A4. Drug Metab Dispos. 2002;30(9):985–990. doi: 10.1124/dmd.30.9.985. [DOI] [PubMed] [Google Scholar]
- 12.Beal S, Sheiner LB, Boeckmann A, Bauer RJ. NONMEM User’s Guide. Elliot City: ICON Development Solutions; 2009. [Google Scholar]
- 13.Jonsson EN, Karlsson MO. Xpose–an S-PLUS based population pharmacokinetic/pharmacodynamic model building aid for NONMEM. Comput Methods Programs Biomed. 1999;58(1):51–64. doi: 10.1016/S0169-2607(98)00067-4. [DOI] [PubMed] [Google Scholar]
- 14.Jonsson EN, Karlsson MO. Automated covariate model building within NONMEM. Pharm Res. 1998;15(9):1463–1468. doi: 10.1023/A:1011970125687. [DOI] [PubMed] [Google Scholar]
- 15.Carlsson KC, Savic RM, Hooker AC, Karlsson MO. Modeling subpopulations with the $MIXTURE subroutine in NONMEM: finding the individual probability of belonging to a subpopulation for the use in model analysis and improved decision making. AAPS J. 2009;11(1):148–154. doi: 10.1208/s12248-009-9093-4. [DOI] [PMC free article] [PubMed] [Google Scholar]
- 16.Lindbom L, Ribbing J, Jonsson EN. Perl-speaks-NONMEM (PsN)–a Perl module for NONMEM-related programming. Comput Methods Programs Biomed. 2004;75(2):85–94. doi: 10.1016/j.cmpb.2003.11.003. [DOI] [PubMed] [Google Scholar]
- 17.Huitema AD, Mathot RA, Tibben MM, Schellens JH, Rodenhuis S, Beijnen JH. Population pharmacokinetics of thioTEPA and its active metabolite TEPA in patients undergoing high-dose chemotherapy. Br J Clin Pharmacol. 2001;51(1):61–70. doi: 10.1046/j.1365-2125.2001.01301.x. [DOI] [PMC free article] [PubMed] [Google Scholar]
- 18.Barnes JN, Williams AJ, Tomson MJ, Toseland PA, Goodwin FJ. Dihydrocodeine in renal failure: further evidence for an important role of the kidney in the handling of opioid drugs. Br Med J (Clin Res Ed) 1985;290(6470):740–742. doi: 10.1136/bmj.290.6470.740. [DOI] [PMC free article] [PubMed] [Google Scholar]
- 19.McNamee PT, Moore GW, McGeown MG, Doherty CC, Collins BJ. Gastric emptying in chronic renal failure. Br Med J (Clin Res Ed) 1985;291(6491):310–311. doi: 10.1136/bmj.291.6491.310. [DOI] [PMC free article] [PubMed] [Google Scholar]
- 20.Perazella MA, Parikh C. Pharmacology. Am J Kidney Dis. 2005;46(6):1129–1139. doi: 10.1053/j.ajkd.2005.07.051. [DOI] [PubMed] [Google Scholar]
- 21.Brown-Cartwright D, Smith HJ, Feldman M. Gastric emptying of an indigestible solid in patients with end-stage renal disease on continuous ambulatory peritoneal dialysis. Gastroenterology. 1988;95(1):49–51. doi: 10.1016/0016-5085(88)90289-2. [DOI] [PubMed] [Google Scholar]
- 22.Lam YW, Banerji S, Hatfield C, Talbert RL. Principles of drug administration in renal insufficiency. Clin Pharmacokinet. 1997;32(1):30–57. doi: 10.2165/00003088-199732010-00002. [DOI] [PubMed] [Google Scholar]
- 23.Nolin TD, Frye RF, Matzke GR. Hepatic drug metabolism and transport in patients with kidney disease. Am J Kidney Dis. 2003;42(5):906–925. doi: 10.1016/j.ajkd.2003.07.019. [DOI] [PubMed] [Google Scholar]
- 24.Gabardi S, Abramson S. Drug dosing in chronic kidney disease. Med Clin North Am. 2005;89(3):649–687. doi: 10.1016/j.mcna.2004.11.007. [DOI] [PubMed] [Google Scholar]
- 25.Sata F, Sapone A, Elizondo G, et al. CYP3A4 allelic variants with amino acid substitutions in exons 7 and 12: evidence for an allelic variant with altered catalytic activity. Clin Pharmacol Ther. 2000;67(1):48–56. doi: 10.1067/mcp.2000.104391. [DOI] [PubMed] [Google Scholar]
- 26.Lamba JK, Lin YS, Schuetz EG, Thummel KE. Genetic contribution to variable human CYP3A-mediated metabolism. Adv Drug Deliv Rev. 2002;54(10):1271–1294. doi: 10.1016/S0169-409X(02)00066-2. [DOI] [PubMed] [Google Scholar]
- 27.Wrighton SA, Brian WR, Sari MA, et al. Studies on the expression and metabolic capabilities of human liver cytochrome P450IIIA5 (HLp3) Mol Pharmacol. 1990;38(2):207–213. [PubMed] [Google Scholar]
- 28.Paine MF, Khalighi M, Fisher JM, et al. Characterization of interintestinal and intraintestinal variations in human CYP3A-dependent metabolism. J Pharmacol Exp Ther. 1997;283(3):1552–1562. [PubMed] [Google Scholar]
- 29.Gorski JC, Hall SD, Jones DR, VandenBranden M, Wrighton SA. Regioselective biotransformation of midazolam by members of the human cytochrome P450 3A (CYP3A) subfamily. Biochem Pharmacol. 1994;47(9):1643–1653. doi: 10.1016/0006-2952(94)90543-6. [DOI] [PubMed] [Google Scholar]
- 30.Hustert E, Haberl M, Burk O, et al. The genetic determinants of the CYP3A5 polymorphism. Pharmacogenetics. 2001;11(9):773–779. doi: 10.1097/00008571-200112000-00005. [DOI] [PubMed] [Google Scholar]


