

Abstract
Obesity is associated with chronic inflammation and elevated levels of IL-6. The role of IL-6 in induction of acute-phase proteins and modulation of haematological responses has been demonstrated in models of inflammation and aging, but not in obesity. We hypothesized that IL-6 is necessary to regulate the acute-phase response and hematological changes associated with diet-induced obesity (DIO) in mice. Feeding a 60% kcal/fat diet for 13 weeks to C57BL6 WT male mice induced a significant increase in IL-6 expression in visceral adipose tissue (VAT), but not liver, compared to mice fed chow diet. Significantly elevated IL-6 levels were present in the peritoneal lavage fluid, but not plasma, of DIO compared to lean mice.
A comparable degree of obesity, hepatomegaly, hyperleptinemia, VAT inflammation and insulin resistance was observed in DIO WT and IL-6 KO mice compared to WT and KO mice fed chow diet. Significant leukocytosis was observed in DIO WT but not DIO KO mice compared to lean groups. A significant reduction in platelet counts, without alterations in platelet size, percentage of circulating reticulated platelets and number of bone marrow megakaryocytes, was present in DIO KO mice compared to each other group. Hepatic expression of thrombopoietin was comparable in each group, with DIO WT and KO mice having reduced VAT expression compared to lean mice. Lean KO mice had significantly elevated plasma levels of thrombopoietin compared to each other group, whereas liver-associated thrombopoietin levels were comparable in each group. Deficiency of IL-6 resulted in blunted hepatic induction of the acute-phase protein serum amyloid A-1, whereas expression of hepcidin-1 and -2, LPS-binding protein, ceruloplasmin, plasminogen activator inhibitor-1 and thrombospondin-1 was IL-6-independent. In conclusion, in the absence of overt metabolic alterations, IL-6 modulates leukocytosis,thrombopoiesis induction of SAA-1, but not other acute-phase proteins in obese mice.
Keywords: obesity, inflammation, acute-phase response, platelets, leukocytes
1. Introduction
Obesity is associated with a state of chronic inflammation, characterized by infiltration by macrophages and other leukocytes in adipose tissue and increased production of several inflammatory mediators, including the pleiotropic cytokine IL-6 [1]. Experimental evidence indicates the involvement of IL-6 in modulating development of obesity and insulin resistance in mice. Development of age-related obesity has been demonstrated in IL-6 KO (KO) mice fed a standard chow diet, with significant differences in body weight reported to begin at either 6 months [2] or 17-20 weeks of age [3]. However, other studies reported either lower body weight or no differences in KO compared with WT mice on either chow or high-fat diet (HFD) [4-6]. In addition, increased insulin resistance and exacerbated hepatic damage develop in KO mice fed a HFD for 20 weeks [3]. Expression of IL-6 receptor α on hepatocytes is necessary for IL-6 to exert its beneficial effects on insulin sensitivity and modulate hepatic inflammation induced by a euglycemic-hyperinsulinemic clamp in mice fed chow diet [7]. Despite some controversy, overall the available data indicate that IL-6 regulates adipogenesis and glucose metabolism, suggesting that increased production of IL-6 in obesity might represent an attempt at protecting the organism against the damage associated with excessive fat accumulation and the associated development of chronic inflammation and insulin resistance.
The acute-phase response (APR) is a set of reactions set in motion by infection and inflammation and characterized by changes in the pattern of protein production by the liver and other tissues, altered metabolism and leukocytosis [8]. Although likely beneficial to cope with acute infections, chronic activation of the APR, as it occurs in obesity, is thought to be detrimental [9]. The metabolic alterations that accompany the APR include increased hepatic glycogenesis and glucose turnover, reduced muscle uptake of glucose, as well as increased insulin secretion and insulin resistance, each favoring development of type 2 diabetes, particularly in the context of obesity [9]. Moreover, alterations in the pattern of protein production by the liver and adipose tissue in obesity contribute to chronicization of inflammation and augment the risk of associated pathologies. Thus, elevated expression of - among others - serum amyloid A-1 (SAA-1), plasminogen activator inhibitor -1 (PAI-1) and thrombospondin-1 (TSP-1) increases cardiovascular disease (CVD) risk [10-12]. Elevated levels of LPS binding protein (LBP) may enhance the bioactivity of low levels of LPS, leading to amplification of inflammatory responses [13], while increased production of hepcidin (Hamp1) and ceruloplasmin (CP) disrupts iron metabolism [14].
Obesity is associated with mild but significant chronic reactive leukocytosis [15, 16]. Although this finding is likely benign, it represents additional evidence of the ongoing APR of obese subjects. A significant increase in platelet counts with increasing body mass index has been described in women but not men [17], although lack of significant differences in circulating platelet counts between lean and obese subjects has also been reported [18, 19]. On the other hand, the significantly elevated mean platelet volume (MPV) of obese subjects and patients with impaired glucose tolerance [19-21] is an additional indicator of increased CVD risk [22]. When considered as a whole, the metabolic and hematologic alterations that characterize the chronic APR of obesity can be seen as both active players and biomarkers of increased risk for CVD and type 2 diabetes.
The critical role of IL-6 as a modulator of inflammation, inducer of the APR and regulator of hematopoiesis and thrombopoiesis has been demonstrated in several experimental models of inflammatory diseases and aging [23]. However, despite the abundance of studies investigating the role of IL-6 in modulating adiposity and insulin resistance in the context of obesity, whether IL-6 is necessary to regulate adipose tissue inflammation, the APR and the hematological changes associated with obesity has not been studied to date.
The goal of the present study was to investigate the role of IL-6 in visceral adipose tissue (VAT) inflammation, haematological alterations and induction of the APR in a model of diet-induced obesity (DIO) in mice, under the hypothesis that IL-6 is necessary to modulate these parameters. To avoid the confounding effects of increased adiposity, insulin resistance and hepatic inflammation previously reported in KO mice beginning at 20 weeks of age [3], we chose to compare WT and KO mice on chow and HFD at 17 weeks of age, before the two strains of mice diverge in their obese and metabolic phenotype. Results obtained from the present study demonstrate that IL-6 mediates modulation of SAA-1 expression and participates in regulation of leukocytosis and thrombopoiesis in obese mice, whereas development of VAT inflammation and induction of several acute-phase proteins in this model is independent of IL-6.
2. Materials and Methods
2.1 Animals and treatment
Animal protocols were approved by the Animal Care Committee of the University of Illinois at Chicago. Four-week-old male WT and KO mice (B6.129S2-Il6tm1Kopf/J) on a C57BL6 background were obtained from The Jackson Laboratories (Bar Harbor, ME). Mice were fed either a chow diet (10 Kcal% fat) or a HFD (60 Kcal% fat, from Research Diets, Inc., New Brunswick, NJ) ad libitum for 13 weeks. Body weight was monitored weekly. At 17 weeks of age, mice were fasted overnight. Blood was collected in EDTA-treated tubes and plasma prepared. Epididymal VAT, pancreas and liver were weighed and immediately snap frozen in liquid nitrogen and stored at −70°C for subsequent processing or fixed in formalin for H&E staining and histological evaluation. Femurs were obtained, fixed in formalin overnight, decalcified and stained with H&E. The number of megakaryocytes in bone marrow sections was counted by two investigators (MP and GF) blinded to the experimental group. The number of megakaryocytes was counted in three separate fields by each investigator and the results averaged to obtain number of megakaryocytes /field.
For IL-6 neutralization experiments, lean and DIO WT mice were injected ip with 1 mg of an anti-murine IL-6 antibody (Biolegend, San Diego CA) previously showed to effectively neutralize IL-6 activity in vivo [24, 25]. Mice were euthanized 1 day after administration of the neutralizing antibody.
2.2 Miscellaneous Measurements
Leptin, TPO, IL-6, SAA and insulin levels were measured using ELISA kits from R&D Systems (Minneapolis, MN), Invitrogen (Carlsbad, CA) and Alpco (Salem, NH). Blood glucose levels were measured using the One-Touch glucose monitoring system (LifeScan, Inc., Milpitas, CA). The HOMA-IR index was calculated using the formula glucose (mmol/l) × insulin (μU/ml)/22.5.
Circulating levels of alanine aminotransferase and triglycerides were measured using kits from Teco Diagnostics (Anaheim, CA). Hematological parameters were evaluated on peripheral EDTA-treated blood using the Hemavet 950 FS (Drew Scientific, Inc, Waterbury, CT). For evaluation of reticulated platelets, the thiazole orange (TO) method was used, as previously described [26]. Briefly, 5 μl of EDTA-anticoagulated blood were diluted in 1 ml of PBS and incubated for 15 minutes with a phycoerythrin-conjugated anti-CD41 antibody (BD, San Diego, CA) and TO (0.1 μg/ml final concentration; Molecular Probes, Eugene, OR), following by washing and fixation in 10% formalin. Samples were analyzed by flow cytometry using a FACScalibur (BD) set on logarithmic amplification of light scatter and low flow rate. Platelets were identified by their forward and side scatter characteristics and positivity for CD41. A TO-free sample from each mouse was included as negative control. Reticulated platelets were calculated as % of TO-positive platelets/total platelets.
2.3 RNA expression analysis
Total RNA was isolated from liver and VAT using Trizol and reverse transcribed. Gene expression levels were assessed by real time RT-PCR using the TaqMan system and primers from Applied Biosystems (Foster City, CA). Table 2 reports the catalog numbers of the specific primers used. Relative expression was calculated using the ΔΔCT method after normalizing for expression of the geometric mean of the housekeeping markers GAPDH and S18. No significant differences among the 4 groups were observed for either marker or their geometric mean in either tissue.
Table 2. Catalog numbers of qPCR primers.
| Gene | Primer # | Gene | Primer # |
|---|---|---|---|
| APN | Mm00456425_m1 | IL-18 | Mm00434225_m1 |
| CCL2 | Mm00441242_m1 | IL-33 | Mm00505403_m1 |
| CCL11 | Mm00441238_m1 | iNOS | Mm00440502_m1 |
| CXCL2 | Mm00436450_m1 | LBP | Mm00493139_m1 |
| CD68 | Mm03047340_m1 | PAI-1 | Mm00435860_m1 |
| CD206 | Mm00485148_m1 | SAA-1 | Mm00656927_g1 |
| CP | Mm00432654_m1 | TNFα | Mm01161290_g1 |
| Hamp-1 | Mm00519025_m1 | TPO | Mm00437040_m1 |
| Hamp-2 | Mm00842044_g1 | TSP-1 | Mm01335418_m1 |
| ICAM-1 | Mm00516023_m1 | VCAM-1 | Mm01320970_m1 |
| IL-1α | Mm00439620_m1 | ||
| IL-1β | Mm01336189_m1 | ||
| IL-1Ra | Mm00446186_m1 | ||
| IL-6 | Mm00446190_m1 | ||
| IL-11 | Mm00434162_m1 |
Catalog numbers of qPCR primers from Applied Biosystems [54]
2.4 Statistical Analysis
Data are expressed as mean +/− SEM. Statistical significance of differences were determined by ANOVA or unpaired Student’s t-test, as appropriate. Statistical analyses were performed using the MedCalc software (Mariakerke, Belgium).
3. Results
3.1 Levels of IL-6 in lean and DIO mice
Feeding a 60% kcal/fat diet for 13 weeks induced a significant increase in VAT, but not liver, IL-6 mRNA expression in DIO compared to lean WT mice (Fig 1). At the protein level, IL-6 was significantly elevated in the peritoneal lavage fluid of DIO compared to lean WT mice, whereas only a non-significant trend was observed in circulating IL-6 levels (Fig 1).
Figure 1. Levels of IL-6 in lean and DIO WT mice.
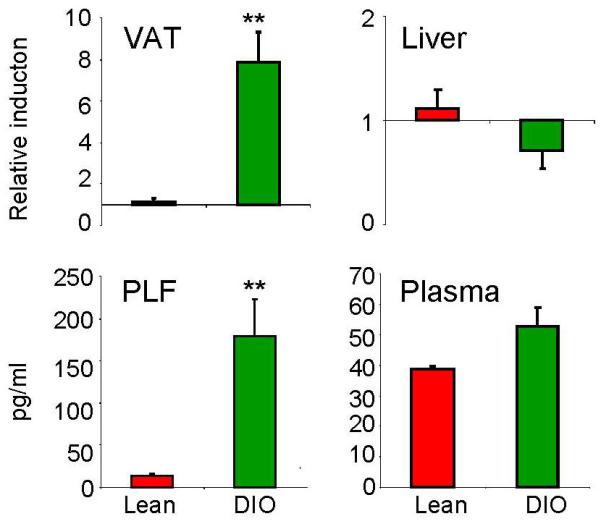
Expression of IL-6 mRNA in VAT and liver of lean (red) and DIO (green) WT mice was evaluated by real-time RT-PCR.
Data are reported as gene expression relative to the lean group using the ΔΔct method. Levels of IL-6 protein in peritoneal lavage fluid (PLF) and plasma were evaluated by ELISA in lean (red) and DIO (green) WT mice.
Data are mean +/− SEM of 5 mice per group.
**p<0.01 vs lean by unpaired Student’s t-test.
3.2 Obesity, insulin resistance and VAT inflammation in DIO WT and KO mice
A significant and comparable increase in body weight (Fig. 2A) and circulating leptin levels (Fig. 2B) was observed in DIO WT and KO mice relative to WT and KO mice fed a chow diet for 13 weeks. No significant differences in body weight between WT and KO mice either on chow or HFD were observed at any time point during the feeding period (Fig. 2A). Histological analysis of VAT indicated development of an equivalent degree of adipocyte hypertrophy and increased amount of stromovascular fraction in DIO WT and KO mice compared to lean groups (Fig. 2L).
Figure 2. Obesity and insulin resistance in DIO WT and KO mice.
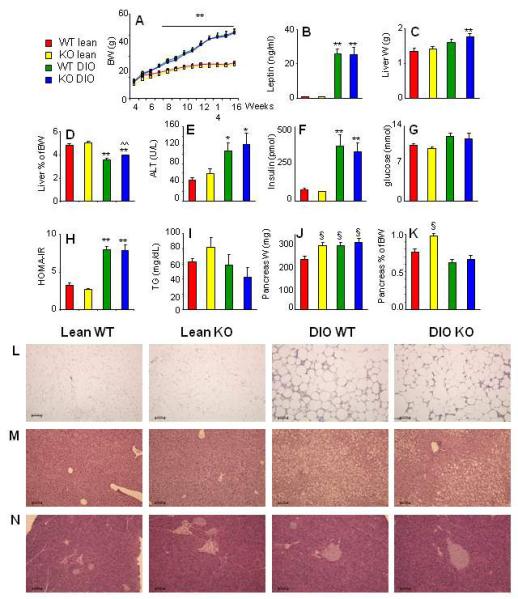
Body weight measured weekly beginning at 4 weeks of age (A), serum leptin (B), weight of the liver (C), the ratio of liver weight/body weight (D), serum Alanine Aminotranferase (ALT) (E), serum insulin (F), serum glucose (G), the HOMA-IR index (H), triglycerides (TG) (I) weight of the pancreas (J) and the ratio of pancreas weight/body weight (K) were evaluated in lean WT (red), lean KO (yellow), DIO WT (green) and DIO KO (blue) mice. Representative H&E-stained sections of VAT (L), liver (M) and pancreas (N) from lean WT, lean KO, DIO WT and DIO KO mice are shown. Magnification is 10X/0.30. Data are mean +/− SEM of 8-10 mice per group.
*p<0.05, **p<0.01 vs respective lean; ^^p<0.01 vs DIO WT; §p<0.05 vs WT lean by ANOVA.
The liver of DIO KO mice was slightly but significantly enlarged compared to that of lean KO mice, whereas the difference in liver weight did not reach statistical significance in DIO vs lean WT mice (Fig. 2C). As a result, DIO KO mice had a significantly higher ratio of liver weight/body weight compared with DIO WT mice (Fig. 2D). A significant and equivalent elevation of circulating alanine amino transferase levels was observed in DIO WT and KO mice compared to lean animals (Fig. 2E), indicating a similar degree of hepatic damage in the two strains of mice when fed a HFD. This finding was confirmed by histological analysis of liver sections (Fig 2L), which demonstrated the presence on an equivalent degree of micro- and macro-vescicular steatosis in DIO WT and KO mice. Obesity was associated with development of a comparable degree of insulin resistance in DIO WT and KO mice, as demonstrated by a significant increase in serum insulin levels (Fig. 2F) with no significant changes in glycemia (Fig. 2G) in both DIO groups relative to lean mice, leading to an equivalent elevation of the HOMA-IR index (Fig. 2H). Circulating levels of triglycerides were comparable in the four experimental groups (Fig. 2I).
As shown in Fig. 2J, lean KO mice had an enlarged pancreas compared with lean WT mice. In fact, the absolute weight of the pancreas in lean KO mice was comparable to that of DIO mice. This resulted in lean KO mice having a significantly higher ratio of pancreas weight/body weight compared with each of the other groups (Fig. 2K). However, in agreement with previous reports evaluating pancreatic morphology of 10-12 week-old KO mice on chow diet [6], the enlarged pancreas of lean KO mice did not show any overt alteration in islet size or number and overall appearance of the exocrine parenchima upon histological examination (Fig. 2M). A comparable amount of intrapancreatic fat was observed in DIO WT and KO mice, but not in lean animals, in agreement with previous data indicating development of nonalcoholic fatty pancreas in obese leptin-deficient ob/ob mice [27].
In both DIO WT and KO mice, obesity was associated with induction of an inflammatory response in VAT compared to lean mice. Expression of the anti-inflammatory adipokine adiponectin (APN) was significantly and comparably reduced in VAT of DIO WT and KO mice relative to lean mice (Fig. 3). A significantly and comparably elevated expression of the markers of macrophage infiltration CD68 and CD206, the chemokines CCL2, CCL11 and CXCL2, the cytokines TNFα, IL-1α, IL-1β and IL-1Ra, and the adhesion molecules vascular cell adhesion molecule-1 (VCAM-1) and intercellular adhesion molecule-1 (ICAM-1) was observed in VAT of DIO WT and KO mice relative to lean controls (Fig. 3). Moreover, expression of IL-18, IL-33 and inducible nitric oxide synthase (iNOS) in VAT did not significantly differ among the four groups (Fig. 3).
Figure 3. Adipose tissue inflammation in DIO WT and KO mice.
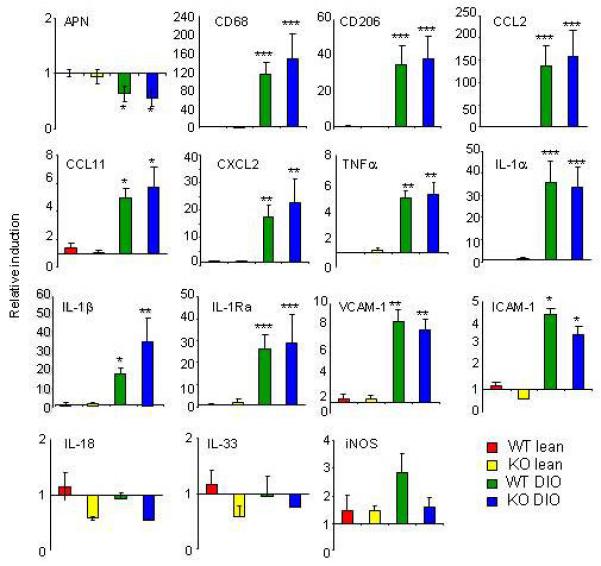
Expression of Adiponectin (APN), CD68, CD206, CCL2, CCL11, CXCL2, TNFα, IL-1α, IL-1β, IL-1Ra, vascular cell adhesion molecule-1 (VCAM-1), intercellular adhesion molecule-1 (ICAM-1), IL-18, IL-33 and inducible nitric oxide synthase (iNOS) was evaluated by real-time RT-PCR in VAT of lean WT, lean KO, DIO WT and DIO KO mice.
Data are mean +/− SEM of 8-10 mice per group and are reported as gene expression relative to the WT lean group using the ΔΔct method.
*p<0.05, **p<0.01 vs respective lean by ANOVA.
3.3 Hematological alterations in DIO WT and KO mice
In agreement with data obtained in obese subjects [16], analysis of peripheral blood demonstrated a significant increase in total leukocyte counts in DIO WT mice compared with each other group (Table 1). Differential counts indicated that the absolute number of neutrophils and lymphocytes was significantly higher in DIO WT mice compared with each other group, without significant differences in the relative percentages of each cell population (Table 1).
Table 1. Hematological parameters in lean and DIO WT and KO mice.
| Lean WT | Lean KO | DIO WT | DIO KO | |
|---|---|---|---|---|
| WBC (103/μl) | 7.8 +/− 0.4 | 6.9 +/− 0.4 | 10.0 +/− 1.0* | 7.7 +/− 0.6 |
| # NE (103/μl) | 1.6 +/− 0.1 | 1.7 +/− 0.1 | 2.6 +/− 0.6* | 1.8 +/− 0.1 |
| # LY (103/μl) | 5.7 +/− 0.3 | 4.7 +/− 0.2 | 6.6 +/− 0.7* | 5.5 +/− 0.5 |
| # MO (103/μl) | 0.4 +/− 0.04 | 0.3 +/− 0.03 | 0.5 +/− 0.07 | 0.4 +/− 0.05 |
| # EO (103/μl) | 0.07+/− 0.03 | 0.06 +/− 0.02 | 0.1 +/− 0.07 | 0.08 +/− 0.03 |
| # BA (103/μl) | 0.02 +/− 0.01 | 0.01 +/− 0.01 | 0.02 +/− 0.01 | 0.01 +/− 0.01 |
| %NE | 22.4 +/− 1.0 | 24.3 +/− 1.0 | 22.7 +/− 0.6 | 24.3 +/− 1.3 |
| % LY | 71.5 +/− 1.2 | 69.6 +/− 1.0 | 71.9 +/− 0.8 | 69.5 +/− 1.2 |
| %MO | 5.1 +/− 0.4 | 5.1 +/− 0.3 | 4.9 +/− 0.5 | 5.2 +/− 0.3 |
| %EO | 0.8+/− 0.3 | 0.8 +/− 0.2 | 0.8 +/− 0.4 | 0.9 +/− 0.2 |
| %BA | 0.2 +/− 0.1 | 0.1 +/− 0.1 | 0.2 +/− 0.1 | 0.2 +/− 0.1 |
| RBC (106/μl) | 9.4 +/− 0.3 | 9.1 +/− 0.1 | 9.8 +/− 0.2 | 9.8 +/− 0.5 |
| Hgb (g/dl) | 12.2 +/− 0.3 | 12.3 +/− 0.1 | 12.8 +/− 0.3 | 12.6 +/− 0.6 |
| Platelets (103/μl) | 938 +/− 36 | 847 +/− 31 | 873 +/− 23 | 690 +/− 37* |
| MPV (fl) | 4.6 +/− 0.1 | 4.4 +/− 0.1 | 4.5 +/− 0.1 | 4.6 +/− 0.1 |
| % ret. platelets | 2.7 +/− 0.5 | 2.5 +/− 0.1 | 2.2 +/− 0.2 | 2.6 +/− 0.2 |
| # MK/field | 27.6 +/− 2.7 | 31.4 +/− 2.7 | 33.6 +/− 2.4 | 36.4 +/− 2.8 |
White blood cell (WBC) counts, Neutrophil (NE), Lymphocyte (LY), Monocyte (MO), Eosinophil (EO) and Basophil (BA) absolute numbers and percentages, Red Blood cell (RBC) numbers, Hemoglobin (Hgb) levels, platelet number and Mean Platelet Volume(MPV) were evaluated using EDTA-anticoagulated peripheral blood obtained from lean and DIO WT and KO mice using a Hemavet 950FS. The percentage of reticulated platelets (ret platelets) was evaluated on EDTA-anticoagulated peripheral blood using the thiazole orange assay as described in the Methods section. The number of megakaryocytes (MK) in the bone marrow was evaluated on H&E sections as described in the Methods section.
Data are mean +/− SEM of 8-10 mice per group.
p<0.05 vs each other group by ANOVA.
A significant reduction in the number of circulating platelets was observed in DIO KO mice compared with each other group (Table 1). However, no significant differences in mean platelet volume (MPV), percentage of reticulated platelets (which indicates the presence of circulating immature platelets) or number of megakaryocytes in bone marrow were observed among the different groups (Table 1).
IL-6 regulates megakaryopoiesis by inducing production of thrombopoietin (TPO) by the liver and by synergizing with TPO for induction of megakaryocyte maturation [28, 29]. An additional source of TPO, particularly in obesity, is represented by VAT [30]. To assess whether altered TPO production might be responsible for the reduced platelet counts of DIO KO mice, we evaluated expression of TPO in liver and VAT as well as serum and liver-associated TPO protein levels. Hepatic TPO expression was comparable in each group (Fig. 4A), whereas TPO VAT expression was significantly and comparably reduced in DIO WT and KO mice compared to lean mice (Fig. 4B). However, as expected [31], TPO expression in the liver was significantly higher compared to VAT in each group, but particularly so in DIO WT and KO mice (Fig. 4C). Plasma TPO, whose levels were comparable to those in previous reports [32], was significantly elevated in lean KO mice compared to each other group (Fig. 4D, whereas liver-associated TPO levels were comparable in the four experimental groups (Fig. 4E). Expression of IL-11, another cytokine with thrombopoietic properties [33], was comparable in liver and VAT of each group (Fig. 4 F and G), suggesting that overproduction of this cytokine did not compensate for lack of IL-6 in KO mice.
Figure 4. Thrombopoietin and IL-11 levels in lean and DIO WT and KO mice.
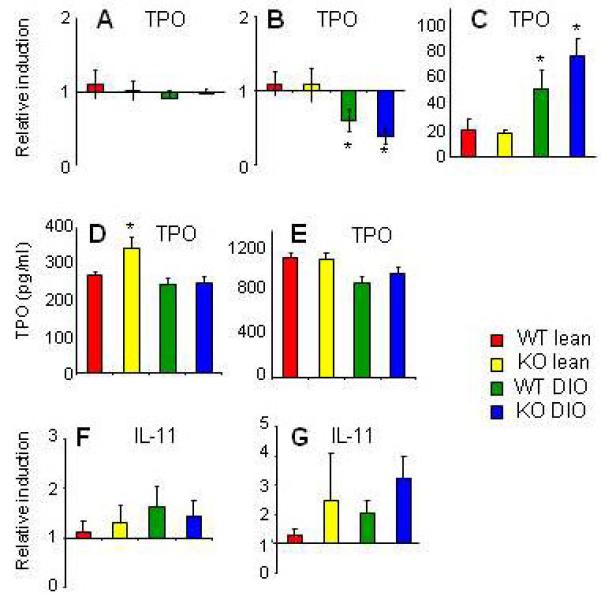
Expression of thrombopoietin (TPO) in liver (A) and VAT (B) and relative TPO levels in liver vs. VAT (C) were evaluated by real-time RT-PCR in lean WT (red), lean KO (yellow), DIO WT (green) and DIO KO (blue) mice. Plasma (D) and liver-associated (E) TPO levels (C) were evaluated by ELISA. Expression of IL-11 in liver (F) and VAT (G) was evaluated by real-time RT-PCR
Data are mean +/− SEM of 8-10 mice per group. Data in panels A, B, F and G are reported as gene expression relative to the WT lean group using the ΔΔct method. Data in panel C are reported as gene expression relative to the respective VAT value using the ΔΔct method.
^p<0.05 vs lean WT; *p<0.05 vs lean KO by ANOVA.
When IL-6 was acutely neutralized in lean and DIO WT mice using a specific antibody, a trend towards reduced platelet numbers was observed in DIO but not in lean mice (platelet numbers were 828+/−140, 818+/−100, 793+/−85, and 661+/−54 x103/μl in lean, lean+anti-IL-6, DIO and DIO+anti-IL-6, respectively; n=5).
Red blood cell counts and hemoglobin concentrations were comparable in the four groups (Table 1).
3.4 The APR in DIO WT and KO mice
Obesity is associated with elevated levels of several acute-phase proteins in both humans and mice [34]. However, whether IL-6 is responsible for obesity-associated induction of acute-phase proteins has not been investigated.
In both liver and VAT, Serum Amyloid A-1 (SAA-1) was the only protein whose modulation by obesity was IL-6-dependent. In fact, significantly higher mRNA expression of hepatic SAA-1 was observed in DIO WT mice compared to lean WT and KO as well as DIO KO mice (Fig 5A). In VAT, a significant reduction of SAA-1 expression was observed in DIO WT, but not DIO KO mice, compared to lean groups (Fig. 5B). In lean WT and KO mice, as well as DIO KO mice, the liver expressed ~1,000-2,000-fold higher levels of SAA-1 compared to VAT, whereas in DIO WT mice the liver expressed ~15,000-fold higher levels of SAA-1 compared to VAT (Fig. 5C). As a result of the differential expression of SAA-1 between tissues, circulating SAA levels reflected liver expression and were significantly elevated in DIO WT mice compared to each other group (Fig. 6).
Figure 5. Expression of acute phase proteins in liver and VAT of lean and DIO WT and KO mice.
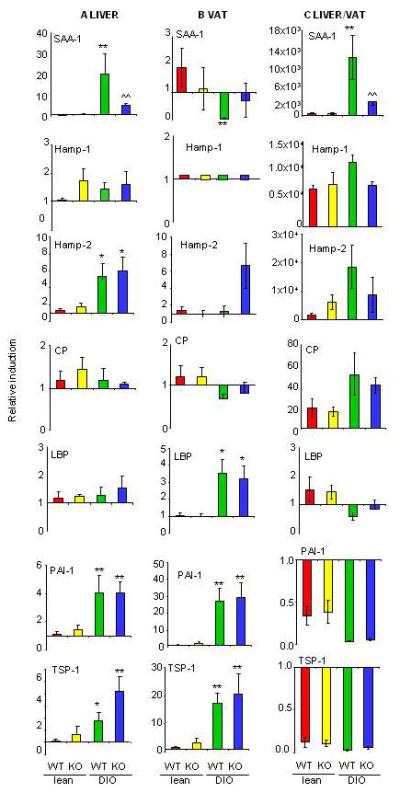
Expression of Serum Amyloid A-1 (SAA-1), Hepcidin Antimicrobial peptide-1 (Hamp-1), Hepcidin Antimicrobial peptide-2 (Hamp-2), Ceruloplasmin (CP), LPS Binding Protein (LBP), Plasminogen Activator Inhibitor-1 (PAI-1) and Thrombospondin-1 (TSP-1) was evaluated by real time RT-PCR. Gene expression in liver (Panel A), VAT (Panel B), and liver vs VAT (Panel C) is reported for of lean WT (red), lean KO (yellow), DIO WT (green) and DIO KO (blue) mice. Data in panels A and B are reported as gene expression relative to the lean WT group using the ΔΔct method. Data in Panel C are reported as gene expression relative to the respective VAT value for each mouse using the ΔΔct method.
Data are mean +/− SEM of 8-10 mice per group.
*p<0.05, **p<0.01 vs respective lean; ^^p<0.01 vs DIO WT by ANOVA.
Figure 6. Circulating SAA levels in lean and DIO WT and KO mice.
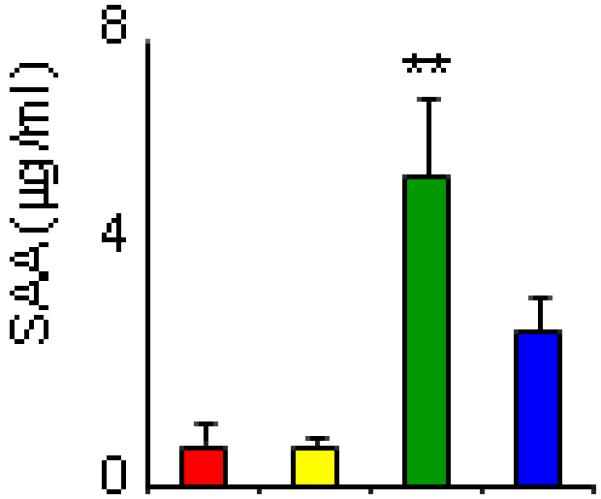
Circulating SAA levels were measured by ELISA in serum of of lean WT (red), lean KO (yellow), DIO WT (green) and DIO KO (blue) mice. Data are mean +/− SEM of 8-10 mice per group. **p<0.01 vs each other group by ANOVA.
Expression of the iron-regulatory protein Hepcidin-1 (Hamp-1) was unaltered in liver of DIO compared to lean mice (Fig. 5A). As expected, Hamp-1 was preferentially expressed in the liver compared to VAT [35] (Fig. 5C). At variance with lack of regulation of Hamp-1, expression of Hamp-2 was significantly increased in liver, but not VAT, of DIO WT and KO mice compared to lean groups. Similar to Hamp-1, expression of Hamp-2 was also higher in liver compared to VAT (Fig 5 A-C).
Expression of ceruloplasmin (CP) was unaffected by obesity in either liver or VAT, whereas expression of LPS-binding protein (LBP) was significantly elevated in VAT, but not liver, of DIO WT and KO mice in comparison with lean mice (Fig 5 A-C).. Plasminogen activator inhibitor-1 (PAI-1) and thrombospondin -1 (TSP-1) were preferentially expressed in VAT compared to liver in each group (Fig 5C) and were significantly and comparably elevated in liver and VAT of both DIO WT and KO mice compared to lean mice (Fig. 5 A and B) .
4. Discussion
The goal of the present study was to investigate the role of IL-6 in obesity-associated VAT inflammation, hematological alterations and induction of the APR. We demonstrate that IL-6 modulates leukocytosis and thrombopoiesis and is responsible for regulation of SAA-1, but not other acute-phase proteins, in obese mice.
4.1 Obesity and insulin resistance
No significant differences in body weight, serum leptin levels, markers of VAT inflammation, insulin resistance or degree of hepatic damage were observed between WT and KO mice on either chow or HFD, at variance with some, but not other, earlier reports [2-6]. Mice in our study were evaluated at 17 weeks of age, before the earliest time point in which a significant difference between WT and KO mice had been previously reported [3]. While we chose this time point in order to avoid the confounding effect of metabolic differences between WT and KO mice, it is possible that evaluation at later time points would have revealed differences in adiposity, glucose metabolism and hepatic inflammation, in agreement with previous studies [2, 3]. However, because evaluation of obesity and insulin resistance was not the central aim of this study, we did not investigate these parameters at multiple time points.
The pancreas of lean KO mice was as large as that of DIO WT and KO mice, indicating a possible early alteration of the pancreatic environment that precedes the development of insulin resistance reported for older KO mice [3, 6]. Similarly, the liver of DIO KO mice was slightly but significantly enlarged compared with that of DIO WT mice, again suggesting the beginning of the process that will eventually lead to overt hepatomegaly and hepatic inflammation in DIO KO mice at an older age [3]. However, no overt alterations of pancreas, liver or VAT in lean or DIO KO mice were evident upon histological examination at the time point examined.
The effect of IL-6 deficiency on obesity-associated VAT inflammation had not been reported previously. Although we cannot exclude the possibility of compensatory mechanisms, our results indicate that IL-6 is dispensable for induction of VAT inflammation by HFD, since no significant differences between DIO WT and KO mice were observed for any of the parameters evaluated.
4.2 Hematological parameters
Despite the association of obesity with leukocytosis being long known [16], whether IL-6 mediates this response had been not been investigated. Previous studies demonstrated that the acute neutrophilia induced by administration of Concanavalin A and hepatic infiltration with neutrophils in response to acute inflammatory stimuli or aging is mediated by IL-6 [36, 37]. The present data indicate that DIO leads to development of mild but significant leukocytosis in WT but not in KO mice, suggesting that IL-6 participates in the chronic induction of leukocytosis of the obese state. These data also indicate that VAT inflammation and peripheral leukocytosis in obesity are differentially regulated, with IL-6 participating in modulating the latter but not the former.
We also show significantly reduced platelet counts in DIO KO mice and a trend towards reduced platelet counts in DIO WT mice receiving anti-IL-6 antibodies. Although earlier reports, in agreement with current data, indicated lack of alterations in platelet counts in lean KO mice [38, 39], the effect of IL-6 deficiency superimposed on obesity on thrombopoiesis had not been previously investigated. The present paper shows lack of significant alterations in MPV, percent of reticulated platelets in peripheral blood and number of megakaryocytes in bone marrow of DIO KO mice compared to the other groups, suggesting that thrombopoiesis in DIO KO mice reaches a steady-state at significantly lower platelet counts, though still in the physiological range, compared to WT mice.
Because IL-6 regulates megakaryopoiesis and reactive thrombocytosis by inducing hepatic production of TPO and by synergizing with TPO for induction of megakaryocyte maturation [28, 29, 39], we investigated whether alterations in TPO levels might be responsible for the observed effects. Data demonstrate lack of significant differences between WT and KO mice in terms of liver TPO mRNA expression and protein levels, indicating that differential production of TPO from the liver is not responsible for the observed differences in platelet counts. Expression of TPO in VAT was significantly but comparably reduced in both DIO WT and KO mice relative to lean groups, again suggesting that differential production from VAT did not account for the lower platelet counts observed in DIO KO mice. Despite lower TPO expression in VAT, plasma TPO levels were comparable in DIO WT, DIO KO and lean WT mice, likely as a result of the significantly higher expression of TPO in liver versus VAT, as shown in Figure 4C. On the other hand, plasma TPO levels were significantly higher in lean KO mice compared to each other group. However, expression of TPO in the liver, the major organ that contributes to circulating TPO levels [31], was not increased in lean KO mice relative to the other groups. Circulating TPO levels are mostly regulated by binding to c-MPL and subsequent elimination of the complex rather than by transcriptional or translational mechanisms [40]. Therefore, our results suggest the possibility of reduced rates of TPO extraction from plasma in lean KO mice, perhaps as a compensatory response to maintain efficient thrombopoiesis in the absence of endogenous IL-6. Lack of this compensatory mechanism in DIO KO mice, possibly as a consequence of the stress of excess adiposity, would lead to reduced platelet counts in the presence of unaltered TPO levels.
Data showing unaltered MPV together with reduced VAT TPO expression in DIO compared to lean mice suggest that obesity differentially affects thrombopoiesis in mice compared to humans, since elevated MPV and VAT TPO expression have been reported in obese subjects and linked to increased CVD risk [18, 19, 30]. Similarly, we did not detect significant alterations in erythrocyte counts, hemoglobin levels and expression of the main iron-regulatory protein Hamp-1 in DIO compared to lean mice, although anemia secondary to elevated Hamp-1 levels has been widely reported in obese subjects [41]. Inter-species differences in thrombopoiesis, erythropoiesis and iron metabolism likely account for these differences [42, 43].
4.3 Acute-phase response (APR)
The chronic APR of obesity exerts a detrimental effect by favoring development of type 2 diabetes and CVD through alterations in metabolic pathways and pattern of protein production [9]. Although IL-6 is considered the most important regulator of the APR, its role is stimulus- and protein-dependent [8, 44]. In the present report we demonstrate that, of the seven acute-phase proteins evaluated, SAA-1 is the only one whose modulation in liver, VAT and plasma during of obesity is IL-6-dependent, in agreement with previous studies evaluating induction of SAA-1 during acute inflammation [44, 45]. In contrast, expression of other proteins that have been associated with elevated CVD risk, such as PAI-1 and TSP-1 [10, 12], was not affected by IL-6 deficiency. These results suggest that strategies aimed at reducing IL-6 bioactivity in obesity may not significantly alter CVD risk, at least regarding modulation of the APR, although they are likely to lower the elevated risk of cancer of obese subjects [46].
A significantly elevated expression of LBP was observed in VAT of DIO WT and KO mice compared to lean animals, in agreement with data obtained in obese subjects [13]. Increased expression of LBP is likely to amplify adipose tissue inflammation, that has been suggested to arise from the metabolic endotoxemia of obesity [47]. However, our data indicate that IL-6 is dispensable for upregulation of LBP during obesity.
No significant alterations in expression of the iron-regulatory proteins Hamp-1 and CP were observed among the four groups in either liver or VAT, indicating lack of effect of both obesity and IL-6 deficiency in regulating expression of these two proteins in mice. These data are at variance with the upregulation of both Hamp-1 and CP in human obesity that has been linked to obesity-associated anemia, a variant of the anemia of inflammation, in which IL-6 likely plays an important role [41, 48-50]. As mentioned above, inter-species differences in hematopoiesis and regulation of iron metabolism are likely to account for this discrepancy [43, 51]. Inter-species differences are further underscored by the observation that, unlike humans, mice have two hepcidin genes, Hamp-1, a critical regulator of iron metabolism, and Hamp-2, whose biological function remains unknown [52]. Our data indicate differential regulation of Hamp-1 and Hamp-2 in response to obesity, in agreement with previous reports demonstrating differential patterns of expression and promoter structure of the two murine Hamp genes [51, 53]. Our data also indicate that, in obese mice, VAT rather than liver is the most important source of PAI-1 and TSP-1, whereas SAA-1, Hamp-1, Hamp-2 and CP are predominantly produced by the liver, while expression of LBP is comparable in liver and VAT of obese mice. Thus, the relative contribution of liver and VAT to the APR of obesity is protein-dependent. A limitation of the present study is that, with the exception of SAA, evaluation of the acute-phase response was only performed at the level of mRNA expression.
4.4 Conclusions
In the present report we demonstrate that, in the absence of overt metabolic alterations, IL-6 modulates leukocytosis and thrombopoiesis in obese mice. However, IL-6 is dispensable for development of adipose tissue inflammation and selectively regulates induction of SAA-1, but not other acute-phase proteins, in obesity.
Highlights.
Adipose tissue inflammation is not affected by IL-6 deficiency in mice
IL-6 KO obese mice do not develop leukocytosis but have reduced platelet numbers
SAA-1 is the only acute-phase protein that requires IL-6 for induction by obesity
Abbreviations
- APR
Acute-phase response
- CP
ceruloplasmin
- CVD
cardiovascular disease
- DIO
Diet-induced obesity
- Hamp
hepcidin
- HFD
high fat diet
- LBP
LPS binding protein
- MPV
mean platelet volume
- PAI-1
plasminogen activator inhibitor -1
- SAA-1
serum amyloid A-1
- TO
thiazole orange
- TPO
thrombopoietin
- TSP-1
thrombospondin-1
- VAT
visceral adipose tissue
Footnotes
Publisher's Disclaimer: This is a PDF file of an unedited manuscript that has been accepted for publication. As a service to our customers we are providing this early version of the manuscript. The manuscript will undergo copyediting, typesetting, and review of the resulting proof before it is published in its final citable form. Please note that during the production process errors may be discovered which could affect the content, and all legal disclaimers that apply to the journal pertain.
5. References
- [1].Fantuzzi G. Adipose tissue, adipokines, and inflammation. J Allergy Clin Immunol. 2005;115:911–919. doi: 10.1016/j.jaci.2005.02.023. quiz 920. [DOI] [PubMed] [Google Scholar]
- [2].Wallenius V, Wallenius K, Ahren B, Rudling M, Carlsten H, Dickson SL, Ohlsson C, Jansson JO. Interleukin-6-deficient mice develop mature-onset obesity. Nat Med. 2002;8:75–79. doi: 10.1038/nm0102-75. [DOI] [PubMed] [Google Scholar]
- [3].Matthews VB, Allen TL, Risi S, Chan MHS, Henstridge DC, Watson N, Zaffino J-O, Bruce CR, Febbraio MA. Interleukin-6-deficient mice develop hepatic inflammation and systemic insulin resistance. Diabetologia. 2010;53:2431–2441. doi: 10.1007/s00125-010-1865-y. [DOI] [PubMed] [Google Scholar]
- [4].Di Gregorio GB, Hensley L, Lu T, Ranganathan G, Kern PA. Lipid and carbohydrate metabolism in mice with a targeted mutation in the IL-6 gene: absence of development of age-related obesity. Am J Physiol Endocrinol Metab. 2004;287:E182–187. doi: 10.1152/ajpendo.00189.2003. [DOI] [PubMed] [Google Scholar]
- [5].Park EJ, Lee JH, Yu GY, He G, Ali SR, Holzer RG, Osterreicher CH, H T, Karin M. Dietary and genetic obesity promote liver inflammation and tumorigenesis by enhancing IL-6 and TNF alpha expression. Cell. 2010;140:197–208. doi: 10.1016/j.cell.2009.12.052. [DOI] [PMC free article] [PubMed] [Google Scholar]
- [6].Ellingsgaard H, Ehses JA, Hammar EB, Van Lommel L, Quintens R, Martens G, Kerr-Conte J, Pattou F, Berney T, Pipeleers D, Halban PA, Schuit FC, Donath MY. Interleukin-6 regulates pancreatic alpha-cell mass expansion. Proc Natl Acad Sci U S A. 2008;105:13163–13168. doi: 10.1073/pnas.0801059105. [DOI] [PMC free article] [PubMed] [Google Scholar]
- [7].Wunderlich FT, Ströhle P, Könner AC, Gruber S, Tovar S, Brönneke HS, Juntti-Berggren L, Li LS, van Rooijen N, Libert C, Berggren PO, Brüning JC. Interleukin-6 signaling in liver-parenchymal cells suppresses hepatic inflammation and improves systemic insulin action. Cell Metab. 2010;12:237–249. doi: 10.1016/j.cmet.2010.06.011. [DOI] [PubMed] [Google Scholar]
- [8].Suffredini AF, Fantuzzi G, Badolato R, Oppenheim JJ, O’Grady NP. New insights into the biology of the acute phase response. J Clin Immunol. 1999;19:203–214. doi: 10.1023/a:1020563913045. [DOI] [PubMed] [Google Scholar]
- [9].Bengmark S. Acute and “chronic” phase reaction-a mother of disease. Clin Nutr. 2004;23:1256–1266. doi: 10.1016/j.clnu.2004.07.016. [DOI] [PubMed] [Google Scholar]
- [10].Aso Y. Plasminogen activator inhibitor (PAI)-1 in vascular inflammation and thrombosis. Front Biosci. 2007;12:2957–2966. doi: 10.2741/2285. [DOI] [PubMed] [Google Scholar]
- [11].Hua S, Song C, Geczy CL, Freedman SB, Witting PK. A role for acute-phase serum amyloid A and high-density lipoprotein in oxidative stress, endothelial dysfunction and atherosclerosis. Redox Rep. 2009;14:187–196. doi: 10.1179/135100009X12525712409490. [DOI] [PubMed] [Google Scholar]
- [12].Varma V, Yao-Borengasser A, Bodles AM, Rasouli N, Phanavanh B, Nolen GT, Kern EM, Nagarajan R, Spencer HJ, 3rd, Lee MJ, Fried SK, McGehee RE, Jr., Peterson CA, Kern PA. Thrombospondin-1 is an adipokine associated with obesity, adipose inflammation, and insulin resistance. Diabetes. 2008;57:432–439. doi: 10.2337/db07-0840. [DOI] [PMC free article] [PubMed] [Google Scholar]
- [13].Ruiz AG, Casafont F, Crespo J, Cayon A, Mayorga M, Estebanez A, Fernadez-Escalante JC, Pons-Romero F. Lipopolysaccharide-binding protein plasma levels and liver TNF-alpha gene expression in obese patients: evidence for the potential role of endotoxin in the pathogenesis of non-alcoholic steatohepatitis. Obes Surg. 2007;17:1374–1380. doi: 10.1007/s11695-007-9243-7. [DOI] [PubMed] [Google Scholar]
- [14].Chua AC, Graham RM, Trinder D, Olynyk JK. The regulation of cellular iron metabolism. Crit Rev Clin Lab Sci. 2007;44:413–459. doi: 10.1080/10408360701428257. [DOI] [PubMed] [Google Scholar]
- [15].Herishanu Y, Rogowski O, Polliack A, Marilus R. Leukocytosis in obese individuals: possible link in patients with unexplained persistent neutrophilia. Eur J Haematol. 2006;76:516–520. doi: 10.1111/j.1600-0609.2006.00658.x. [DOI] [PubMed] [Google Scholar]
- [16].Nanji AA, Freeman JB. Relationship between body weight and total leukocyte count in morbid obesity. Am J Clin Pathol. 1985;84:346–347. doi: 10.1093/ajcp/84.3.346. [DOI] [PubMed] [Google Scholar]
- [17].Samocha-Bonet D, Justo D, Rogowski O, Saar N, Abu-Abeid S, Shenkerman G, Shapira I, Berliner S, Tomer A. Platelet counts and platelet activation markers in obese subjects. Mediators of inflammation. 2008;2008:834153. doi: 10.1155/2008/834153. [DOI] [PMC free article] [PubMed] [Google Scholar]
- [18].Coban E, Ozdogan M, Yazicioglu G, Akcit F. The mean platelet volume in patients with obesity. International journal of clinical practice. 2005;59:981–982. doi: 10.1111/j.1742-1241.2005.00500.x. [DOI] [PubMed] [Google Scholar]
- [19].Coban E, Yilmaz A, Sari R. The effect of weight loss on the mean platelet volume in obese patients. Platelets. 2007;18:212–216. doi: 10.1080/09537100600975362. [DOI] [PubMed] [Google Scholar]
- [20].Coban E, Bostan F, Ozdogan M. The mean platelet volume in subjects with impaired fasting glucose. Platelets. 2006;17:67–69. doi: 10.1080/09537100500220729. [DOI] [PubMed] [Google Scholar]
- [21].Arslan N, Makay B. Mean platelet volume in obese adolescents with nonalcoholic fatty liver disease. Journal of pediatric endocrinology & metabolism: JPEM. 2010;23:807–813. doi: 10.1515/jpem.2010.130. [DOI] [PubMed] [Google Scholar]
- [22].Slavka G, Perkmann T, Haslacher H, Greisenegger S, Marsik C, Wagner OF, Endler G. Mean platelet volume may represent a predictive parameter for overall vascular mortality and ischemic heart disease. Arteriosclerosis, thrombosis, and vascular biology. 2011;31:1215–1218. doi: 10.1161/ATVBAHA.110.221788. [DOI] [PubMed] [Google Scholar]
- [23].Kishimoto T, Kishimoto N. Interleukin 6: from bench to bedside. Nature Clin Pract Rheumatol. 2006;2:619–626. doi: 10.1038/ncprheum0338. [DOI] [PubMed] [Google Scholar]
- [24].Riedemann NC, Neff TA, Guo RF, Bernacki KD, Laudes IJ, Sarma JV, Lambris JD, Ward PA. Protective effects of IL-6 blockade in sepsis are linked to reduced C5a receptor expression. J Immunol. 2003;170:503–507. doi: 10.4049/jimmunol.170.1.503. [DOI] [PubMed] [Google Scholar]
- [25].Yen D, Cheung J, Scheerens H, Poulet F, McClanahan T, McKenzie B, Kleinschek MA, Owyang A, Mattson J, Blumenschein W, Murphy E, Sathe M, Cua DJ, Kastelein RA, Rennick DM. IL-23 is essential for T cell-mediated colitis and promotes inflammation via IL-17 and IL-6. J Clin Invest. 2006;116:1310–1316. doi: 10.1172/JCI21404. [DOI] [PMC free article] [PubMed] [Google Scholar]
- [26].Matic GB, Chapman ES, Zaiss M, Rothe G, Schmitz G. Whole blood analysis of reticulated platelets: improvements of detection and assay stability. Cytometry. 1998;34:229–234. doi: 10.1002/(sici)1097-0320(19981015)34:5<229::aid-cyto4>3.0.co;2-2. [DOI] [PubMed] [Google Scholar]
- [27].Mathur A, Marine M, Lu D, Swartz-Basile DA, Saxena R, Zyromski NJ, Pitt HA. Nonalcoholic fatty pancreas disease. HPB (Oxford) 2007;9:312–318. doi: 10.1080/13651820701504157. [DOI] [PMC free article] [PubMed] [Google Scholar]
- [28].Kaser A, Brandacher G, Steurer W, Kaser S, Offner F, Zoller H, Theurl I, Widder W, Molnar C, Ludwiczek O, Atkins MB, Mier JW, Tilg H. Interleukin-6 stimulates thrombopoiesis through thrombopoietin: role in inflammatory thrombocytosis. Blood. 2001;98:2720–2725. doi: 10.1182/blood.v98.9.2720. [DOI] [PubMed] [Google Scholar]
- [29].Sui X, Tsuji K, Ebihara Y, Tanaka R, Muraoka K, Yoshida M, Yamada K, Yasukawa K, Taga T, Kishimoto T, Nakahata T. Soluble interleukin-6 (IL-6) receptor with IL-6 stimulates megakaryopoiesis from human CD34(+) cells through glycoprotein (gp)130 signaling. Blood. 1999;93:2525–2532. [PubMed] [Google Scholar]
- [30].Maury E, Ehala-Aleksejev K, Guiot Y, Detry R, Vandenhooft A, Brichard SM. Adipokines oversecreted by omental adipose tissue in human obesity. Am J Physiol Endocrinol Metab. 2007;293:E656–665. doi: 10.1152/ajpendo.00127.2007. [DOI] [PubMed] [Google Scholar]
- [31].Kaushansky K. Determinants of platelet number and regulation of thrombopoiesis. Hematology Am Soc Hematol Educ Program. 2009:147–152. doi: 10.1182/asheducation-2009.1.147. [DOI] [PubMed] [Google Scholar]
- [32].Tiedt R, Coers J, Ziegler S, Wiestner A, Hao-Shen H, Bornmann C, Schenkel J, Karakhanova S, de Sauvage FJ, Jackson CW, Skoda RC. Pronounced thrombocytosis in transgenic mice expressing reduced levels of Mpl in platelets and terminally differentiated megakaryocytes. Blood. 2009;113:1768–1777. doi: 10.1182/blood-2008-03-146084. [DOI] [PubMed] [Google Scholar]
- [33].Ciurea SO, Hoffman R. Cytokines for the treatment of thrombocytopenia. Semin Hematol. 2007;44:166–182. doi: 10.1053/j.seminhematol.2007.04.005. [DOI] [PubMed] [Google Scholar]
- [34].Tzotzas T, Evangelou P, Kiortsis DN. Obesity, weight loss and conditional cardiovascular risk factors. Obes Rev. 2010 doi: 10.1111/j.1467-789X.2010.00807.x. In press. [DOI] [PubMed] [Google Scholar]
- [35].Nemeth E, Ganz T. Regulation of iron metabolism by hepcidin. Annu Rev Nutr. 2006;26:323–342. doi: 10.1146/annurev.nutr.26.061505.111303. [DOI] [PubMed] [Google Scholar]
- [36].Malchow S, Thaiss W, Janner N, Gewiese-Rabsch J, Garbers C, Yamamoto K, Rose-John S, Scheller J. Essential role of neutrophil mobilization in concanavalin A-induced hepatitis is based on classic IL-6 signaling but not on IL-6 trans signaling. Biochim Biophys Acta. 2010 doi: 10.1016/j.bbadis.2010.11.009. In press. [DOI] [PubMed] [Google Scholar]
- [37].Gomez CR, Nomellini V, Baila H, Oshima K, Kovacs EK. Comparison of the effects of aging and IL-6 on the hepatic inflammatory response in two models of systemic injury: scald injury versus i.p. LPS administration. Shock. 2009;31:178–184. doi: 10.1097/SHK.0b013e318180feb8. [DOI] [PMC free article] [PubMed] [Google Scholar]
- [38].Gainsford T, Nandurkar H, Metcalf D, Robb L, Begley CG, Alexander WS. The residual megakaryocyte and platelet production in c-mpl-deficient mice is not dependent on the actions of interleukin-6, interleukin-11, or leukemia inhibitory factor. Blood. 2000;95:528–534. [PubMed] [Google Scholar]
- [39].Burmester H, Wolber EM, Freitag P, Fandrey J, Jelkmann W. Thrombopoietin production in wild-type and interleukin-6 knockout mice with acute inflammation. J Interferon Cytokine Res. 2005;25:407–413. doi: 10.1089/jir.2005.25.407. [DOI] [PubMed] [Google Scholar]
- [40].Deutsch VR, Tomer A. Megakaryocyte development and platelet production. Br J Haematol. 2006;134:453–466. doi: 10.1111/j.1365-2141.2006.06215.x. [DOI] [PubMed] [Google Scholar]
- [41].Cepeda-Lopez AC, Aeberli I, Zimmermann MB. Does obesity increase risk for iron deficiency? A review of the literature and the potential mechanisms. Int J Vitam Nutr Res. 2010;80:263–270. doi: 10.1024/0300-9831/a000033. [DOI] [PubMed] [Google Scholar]
- [42].Rivera S, Ganz T. Animal models of anemia of inflammation. Semin Hematol. 2009;46:351–357. doi: 10.1053/j.seminhematol.2009.06.003. [DOI] [PMC free article] [PubMed] [Google Scholar]
- [43].Schmitt A, Guichard J, Masse JM, Debili N, Cramer EM. Of mice and men: comparison of the ultrastructure of megakaryocytes and platelets. Exp Hematol. 2001;29:1295–1302. doi: 10.1016/s0301-472x(01)00733-0. [DOI] [PubMed] [Google Scholar]
- [44].Fattori E, Cappelletti M, Costa P, Sellitto C, Cantoni L, Carelli M, Faggioni R, Fantuzzi G, Ghezzi P, Poli V. Defective inflammatory response in interleukin 6-deficient mice. 1994:180. doi: 10.1084/jem.180.4.1243. [DOI] [PMC free article] [PubMed] [Google Scholar]
- [45].Gamble L, Bagby GJ, Quinton LJ, Happel KI, Mizgerd JP, Zhang P, Nelson S. The systemic and pulmonary LPS binding protein response to intratracheal lipopolysaccharide. Shock. 2009;31:212–217. doi: 10.1097/SHK.0b013e31817c0d7d. [DOI] [PubMed] [Google Scholar]
- [46].Naugler WE, Karin M. The wolf in sheep’s clothing: the role of interleukin-6 in immunity, inflammation and cancer. Trends Mol Med. 2008;14:109–119. doi: 10.1016/j.molmed.2007.12.007. [DOI] [PubMed] [Google Scholar]
- [47].Manco M, Putignani L, Bottazzo GF. Gut microbiota, lipopolysaccharides, and innate immunity in the pathogenesis of obesity and cardiovascular risk. Endocr Rev. 2010;31:817–844. doi: 10.1210/er.2009-0030. [DOI] [PubMed] [Google Scholar]
- [48].Cignarelli M, DePergola G, Picca G, Sciaraffia M, Pannacciulli N, Tarallo M, Laudadio E, Turrisi E, Giorgino R. Relationship of obesity and body fat distribution with ceruloplasmin serum levels. Int J Obes Relat Metab Disord. 1996;20:809–813. [PubMed] [Google Scholar]
- [49].Kim OY, Shin MJ, Moon J, Chung JH. Plasma ceruloplasmin as a biomarker for obesity: a proteomic approach. Clin Biochem. 2011;44:351–356. doi: 10.1016/j.clinbiochem.2011.01.014. [DOI] [PubMed] [Google Scholar]
- [50].Tussing-Humphreys LM, Nemeth E, Fantuzzi G, Freels S, Holterman AX, Galvani C, Ayloo S, Vitello J, Braunschweig C. Decreased serum hepcidin and improved functional iron status 6 months after restrictive bariatric surgery. Obesity (Silver Spring) 2010;18:2010–2016. doi: 10.1038/oby.2009.490. [DOI] [PubMed] [Google Scholar]
- [51].Truksa J, Lee P, Beutler E. The role of STAT, AP-1, E-box and TIEG motifs in the regulation of hepcidin by IL-6 and BMP-9: lessons from human HAMP and murine Hamp1 and Hamp2 gene promoters. Blood Cells Mol Dis. 2007;39:255–262. doi: 10.1016/j.bcmd.2007.06.014. [DOI] [PMC free article] [PubMed] [Google Scholar]
- [52].Lou DQ, Nicolas G, Lesbordes JC, Viatte L, Grimber G, Szajnert MF, Kahn A, Vaulont S. Functional differences between hepcidin 1 and 2 in transgenic mice. Blood. 2004;103:2816–2821. doi: 10.1182/blood-2003-07-2524. [DOI] [PubMed] [Google Scholar]
- [53].Ilyin G, Courselaud B, Troadec MB, Pigeon C, Alizadeh M, Leroyer P, Brissot P, Loreal O. Comparative analysis of mouse hepcidin 1 and 2 genes: evidence for different patterns of expression and co-inducibility during iron overload. FEBS Lett. 2003;542:22–26. doi: 10.1016/s0014-5793(03)00329-6. [DOI] [PubMed] [Google Scholar]
- [54].Ahmed M, Neville MJ, Edelmann MJ, Kessler BM, Karpe F. Proteomic analysis of human adipose tissue after rosiglitazone treatment shows coordinated changes to promote glucose uptake. Obesity. 2009;18:27–34. doi: 10.1038/oby.2009.208. [DOI] [PubMed] [Google Scholar]