

Abstract
Here, we present a method for measuring the concentration of endogenous protein in cellular compartments. Importantly, the method is applicable to compartments such as dendritic spines with dimensions often close to the resolution limit of optical microscopy. To our knowledge, a method with such capabilities has not yet been described. The method utilizes overexpression of the protein of interest, which is tagged with fluorescent protein. This is followed by immunostaining of both overexpressed and endogenous proteins. Expression of a volume marker is also required. We applied this method to measure the concentration of Ca/Calmodulin kinase II (CaMKII) in different cellular compartments of hippocampal pyramidal neurons. It was found that the concentrations of CaMKIIα subunits in cell bodies, proximal dendrites, and spines on these dendrites are 71, 46, and 103 μM, respectively. Considering the 3:1 ratio of α to β CaMKII subunits in the hippocampus, the concentrations of total (α + β) CaMKII subunits in these compartments are 94, 61, and 138 μM, respectively.
Keywords: slice cultures, brain, hippocampus, concentration, protein, CaMKII, dendritic spines, neuromodelling
1. Introduction
In order to develop a realistic model of molecular processes, it is important to know the concentration of molecules in the specific cellular compartment where the processes occur (Byrne et al., 2010; Neves et al., 2008; Zhabotinsky et al., 2006). In neurons, many important functions occur in dendritic spines—tiny dendritic protrusions containing excitatory synapses. During synaptic plasticity, which underlies the formation of memory, spines change their morphology and protein composition (Kasai et al., 2010; Lee et al., 2009; Otmakhov et al., 2004). Therefore, knowing the concentrations of molecules in spines is a requirement for understanding synaptic function. Because the dimensions of spines are often near the resolution of light microscopy (~0.5 μm (Harris and Stevens, 1989)), it has been a challenge to develop a method for measuring protein concentration in these structures. Recently, one method was reported and used (Lee et al., 2009) to estimate the concentration of CaMKIIα in hippocampal neurons. However, this method was designed to measure endogenous concentration only in large and spatially distinct cellular compartments such as the cell soma or large dendrites. Another method was reported to allow estimation of the number of molecules even in very small cellular compartments such as the postsynaptic density (Sugiyama et al., 2005). This method can be extended to determine protein concentrations in any compartment, provided that the compartment volume can be measured. However, a limitation of this method is the requirement for complicated techniques, including the measurement of single-molecule fluorescence. Here, we developed a simpler method for the estimation of the concentration of protein in small compartments such as dendritic spines.
2. Materials and methods
2.1. Preparation of slice cultures and protein overexpression
Hippocampal slice cultures were prepared at postnatal days 6 (P6)–P10, as described by (Otmakhov et al., 2004). After 11 to 17 days in vitro, slice cultures were transfected with plasmids containing cDNAs of monomeric green fluorescent protein fused with CaMKIIα (GFPCaMKII) and monomeric red fluorescent protein mCherry (RFP). The plasmids were previously described elsewhere (Otmakhov et al., 2007). Transfection was performed by single-cell electroporation method (Haas et al., 2001; Pi et al., 2010). Briefly, DNAs (100–200 ng/μl were mixed with Ringer solution containing 2 mM Ca2+ and 12 mM Mg2+. The mixture was filter sterilized and loaded into a patch pipette of 4 megohm resistance containing a filament for easy loading. A slice, still attached to a small patch of porous membrane on which it was grown, was placed in an imaging type microscope chamber filled with the sterilized Ringer solution (see above) without superfusion. Electroporation was performed by a single train of voltage pulses (1 ms, 200 Hz, 1 s, ~10 V) delivered through a Master 8 pulse generator (A.M.P.I., Israel). Normally, two to five pairs of CA1 pyramidal cells were transfected in a slice. These pairs were nearby cells, one transfected with RFP and the other cotransfected with GFPCaMKII plus RFP DNAs.
2.2. Imaging and image analysis
The next day after transfection, slices were transferred to an imaging chamber of a two-photon microscope (Leica SP2MP, Wetzlar, Germany) equipped with a 60x (1.1 numerical aperture, water immersion) objective and a femtosecond pulse infrared laser (Chameleon; Coherent, Santa Clara, CA). GFP and RFP were excited with 940 nm, and emitted fluorescence was collected using 525/50 and 610/75 nm emission bands, respectively. Fixed slices were imaged using Leica SP2 confocal system with 63x (1.4 NA) oil objective and visible Ar/Kr and UV lasers. In the confocal mode, GFP, RFP, and DAPI were excited with 488, 543, and 405 nm, respectively, and imaged using 525/50, 630/50, and 450/70 nm emission bands in consecutive mode for each focal plane. In the consecutive mode, each fluorophore was excited independently of others, which ensured more specific excitation and emission and practically eliminated a leak between channels. Specifically the bleedthrough between channels in the confocal mode was less than 5% and, in the two-photon mode, was less than 7%; the data were not corrected for this artifact. Each cell pair was imaged at both low resolution (0.34 μm/pixel) at cell body/proximal dendrites and at high resolution (0.093–0.116 μm/pixel) at distal dendritic/spine region. Normally, stacks of 10–30 images with focal steps of 0.5 μm (dendrites/spines) and 2–3 μm (cell body) were collected. All images were 8 bit levels. Fluorescence intensity values for spines, dendritic shafts, and cell bodies were calculated as average pixel values in a region of interest (ROI) in the best focal plane of each structure (Otmakhov et al., 2007). For quantifications, ROIs were carefully placed at locations that showed the most homogeneous distribution. For example, for cell bodies, attention was paid not to place the ROI in the location of the cell nucleus, where CaMKII immunostaining is drastically reduced. In dendrites, ROIs were placed in the locations that do not have a sharp local increase in immunostaining, indicative of the possible presence of dendritic spines, as can be seen on superimposed RFP images.
2.3. GFP standard curve
40 μM standard GFP solution was purchased from Cell Biolabs, Inc. (AKR120, Cell Biolabs, Inc.), and two additional dilutions of 24 and 13 μM were prepared using dilution buffer included in the kit (0.05% NaAzide in PBS). Fluorescence intensity of GFP standards was measured in 20 μm thick, 200 μm wide rectangular microslides (Wales apparatus, Hellertown, PA, #5002-050) using the same imaging parameters as those used during imaging of live cells. Because actual microscope performance may differ from day to day, the calibration curve needs to be measured during each imaging experiment. The GFP sample can be replaced by a cheaper fluorescent dye such as fluorescein (pH 9) (Sigma) at concentrations producing similar fluorescence to those of the GFP standard. Since fluorescence intensity of purified GFP is linearly proportional to the protein quantity (Richards et al., 2003), our calibration data were fit using linear fit method with forced intercept at 0, and the slope value was obtained from that fit.
2.4. Fixation, sectioning, and immunostaining
2.4.1. Solutions for immunostaining
Phosphate-buffered saline (PBS) was used without Ca2+ and Mg2+, pH 7.4, Osm 320 mOsm.
Paraformaldehyde was prepared from 16%, EM grade solution (comp). Slice was dropped in 2 ml centrifuge tube containing 1 ml of PBS, and then 1 ml of 8% paraformaldehyde / 8% sucrose (in PBS) solution was added drop by drop and mixed by hand shaking (all solutions were at room temperature).
Washing solution #1: PBS
Washing solution #2: 50 mM NH4Cl/0.1% TX in PBS
Washing solution #3: 2% BSA in PBS
Permeabilizing solution: 10% Goat serum (GS) / 0.3% Triton X 100 (TX100) in PBS.
Permeabilizing-blocking solution: 10% GS / 0.3% TX100 / 0.02% NaAzide in PBS
Primary antibody solution: mouse anti-rat CaMKIIα monoclonal antibody (ABR MA1-048, Clone 6G9) 1:400 dilution in 10% GS in PBS
Secondary antibody: Goat anti-mouse Alexa 405 (1:400)
2.4.2 Tissue fixation sectioning and immunostaining procedures
Slices were fixed by 4% paraformaldehyde / 4%sucrose solution in PBS for 2 hrs at room temperature and then overnight at 4C°. The next day, they were washed three times for 30 min. The first and third washes were in PBS; the second wash, in washing solution #2.
Washed slices were glued by crazy glue to the bottom of the sample holder of a Leica vibrotome and sectioned by 20–30 μm thickness in ice cold PBS. Sections were placed in a custom-made “immunostaining” holder for all further treatments. The holder had a shape of rectangular plate made of black Delrin plastic and had several rows of not trough holes (depressions). Each such hole held up to three to four slices and was composed of three concentric depressions. The first depression (4 mm deep and 20 mm in diameter) was used for permeabilization and washing and could accommodate > 1 ml of solution. At the bottom of it, there was a smaller diameter and more shallow depression (1 mm deep and 14 mm in diameter and of 200 μl volume), which was used for slice permeabilization. A third depression (8 mm in diameter and 1.5 mm deep) was used for antibody treatment and could hold 80–100 μl. This construction allowed changing solutions by pipetting without transferring tissue sections out of a single hole of this holder. This holder was placed in a plastic box with a small amount of water on the bottom to provide humidified atmosphere during long tissue treatment. Thin sections were permeabilized for 30 min in the permeabilizing solution (1.0 ml) at 4C° with continuous shaking and then blocked in permeabilizing-blocking solution (200 μl) at 4C° with shaking. The blocking solution was then sucked out and replaced by solution containing primary antibody for CaMKIIα for overnight treatment at 4C° with shaking. The next day, sections were washed three times for 30 min in washing solution #3 at 4C°. Washing solution was replaced by the secondary antibody solution for overnight treatment at 4C° with shaking. After 3 × 30 min wash in washing solution #3 at 4C°, sections were mounted in ProLong Gold Antifade (Invitrogen), dried overnight, sealed with nail polish, and stored at -20C°.
It was important to make the slice sections not thicker than 30 μm because thicker sections were not stained homogeneously through the slice depth (Fig.2).
Figure 2.
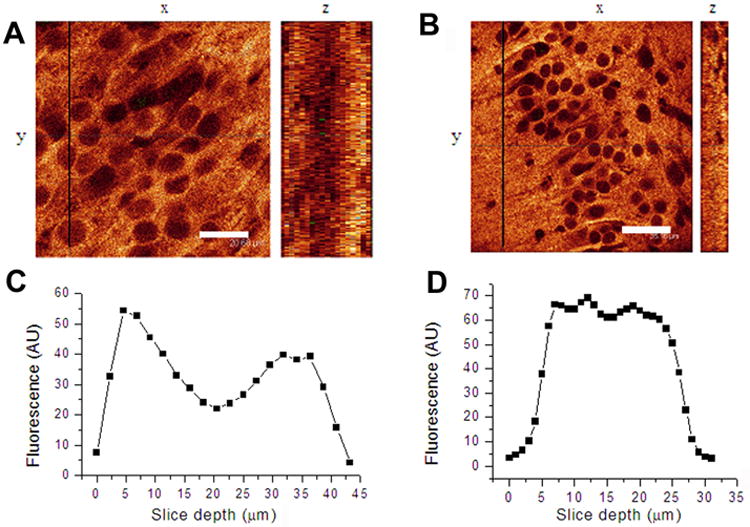
Slices thicker than 20–30 μm were not stained homogeneously through the depth of the slice. A, B, single horizontal (x, y) and vertical (z) optical sections obtained from 40 μm (A) and 20 μm (B) thick slices stained with anti-CaMKIIα/Alexa405 antibodies; x, y images were taken at the depth of 7–10 μm from the section surface; z-axis images were reconstructed from stacks of x, y images along the black lines indicated A and B. Scale: 20 μm (A) and 35 μm (B). C, D, depth profiles of Alexa 405 fluorescence show a decrease in antibody staining in the middle of the 40 μm (C), but not the 20 μm (D) sections.
3. Results
3.1. General method description
The general idea is first to overexpress a protein of interest tagged with a fluorescent protein (for example, green fluorescent protein [GFP]). This can be done either in vivo or in hippocampal slice culture. By comparing the fluorescence intensity of the overexpressed protein in living cells with the fluorescence intensity of solutions with known GFP concentrations (GFP standard), the concentration of overexpressed protein in relatively large cellular compartments can be determined. By then comparing the immunostaining of the protein in transfected and nearby nontransfected cells, the level of overexpression is calculated and the concentration of endogenous protein can be determined. In brain structures with tightly packed cells like the hippocampus, this last procedure can only be used for large cellular compartments such as the cell body or large dendrites (Lee et al., 2009), which are clearly identifiable on immunostaining images. For smaller dendrites and spines, the quantification of the immunostaining signal is problematic because: 1) the edges of even relatively large dendrites are not clearly distinguishable; and 2) the size of thinner dendrites and spines is larger than the size of the point spread function of optical systems and, therefore, the signal measured from such small compartments becomes contaminated with the signal from tightly packed neighboring structures. To solve these problems, we expressed red fluorescent protein (RFP) as a cell volume marker. This allowed clear identification of fine cellular structures on immunostaining images and made possible the quantification of the immunostaining in dendrites that are larger than the point spread function of our optical system (~2 μm in diameter). To calculate endogenous concentration of the protein of interest in still smaller structures such as spines, we first measured spine/dendrite ratio of the overexpressed GFP-tagged protein and then used this ratio for calculating the endogenous protein concentration in spines. Additional considerations such as homogeneous immunostaining through the thickness of the tissue or the attenuation of the fluorescent signal with the depth of the dendrite should also be taken into account.
3.2. Determining the concentration of the overexpressed protein in cell body
First, we used electroporation (Pi et al., 2010) to transfect several CA1 pyramidal cells in a slice with both GFPCaMKII and RFP DNAs (see methods). In the same slice, several cells were also transfected with only RFP DNA. Care was taken that cells transfected with RFP DNAs were close to cells cotransfected with both GFPCaMKII and RFP DNAs. Fig. 1 shows an example of these transfections.
Figure 1.
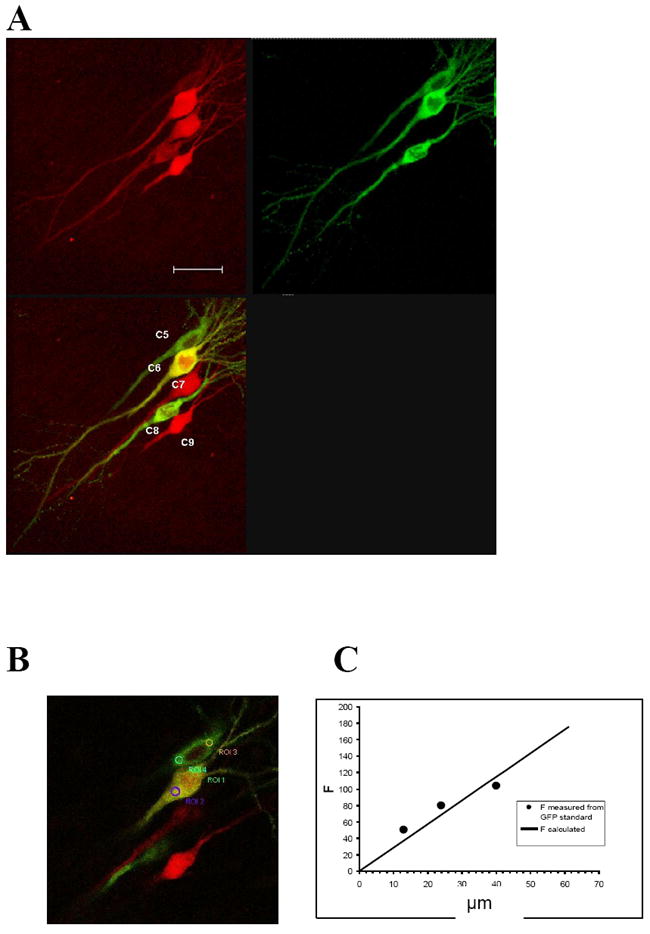
Calculating the concentration of the overexpressed protein. A, Images of five CA1 pyramidal cells overexpressing either GFPCaMKII/RFP or only RFP in hippocampal slice culture. Red and green channels (top) and their overlap (lower left). In the overlapped image, three cells expressing two proteins appear greenish-yellowish because GFPCaMKII expression was stronger then RFP in these cells; two cells expressing just RFP look pure red. Cells were numbered for individual analysis (cells 1–4 in the same slice are not shown). Scale: 35 μm; B, single-plane overlapped image from A. Circles indicate ROIs where fluorescence was measured in two of the cells. C, standard curve is a linear fit (black line) of data obtained from measuring fluorescence of the GFP standard concentrations (black symbols). By comparing fluorescence intensity of GFPCaMKII in living cells with that of GFP solutions with known GFP concentrations (GFP standard), the concentration of the overexpressed protein was calculated.
GFP fluorescence intensity was measured in living slices in cell bodies of all neurons overexpressing GFPCaMKII (Focb) (Fig. 1B). Using the same imaging parameters, the fluorescence of three different concentrations (13, 24, and 40 μM) of GFP standard solution were measured (see methods for details), and a standard curve was constructed with a linear fit of the experimental data (Fig. 1C). The average slope (GFPslope) was obtained from this fit.
By comparing GFP signal of each cell expressing GFPCaMKII with GFP standard curve, the concentration of the overexpressed protein in cell body, Cocb, was calculated as Cocb = Focb/GFPslope (Table 1).
Table 1.
Data for calculating concentration of CaMKII in cell body
| Fluorescence (AU) of GFPCaMKII measured in live cell bodies: Fo(cb) | Fluorescence (AU) of total CaMKIIα measured by IS in fixed cells: F(o+e)(cb)’ | Concentration (μM) of overexpressed GFPCaMKII: Co(cb) | Overexpression level relatively RFP expressing cells: Ocb(exp) | Concentration (μM) of the endogenous CaMKIIα in GFPCaMKII/RFP expressing cells: Ce(cb)exp | Concentration (μM) of the endogenous CaMKIIα in non expressing cells: Ce(cb) | |
|---|---|---|---|---|---|---|
| C1 | 155 | 160 | 54.01 | 2.54 | 35.08 | 47.33 |
| C3 | 200 | 170 | 69.69 | 4.86 | 18.07 | 55.23 |
| C5 | 121 | 212 | 42.16 | 1.93 | 45.47 | 42.99 |
| C6 | 200 | 250 | 69.69 | 2.27 | 54.75 | 51.77 |
| Ave | 169.00 | 198 | 58.89 | 2.90 | 38.34 | 49.33 |
| SE | 19.20 | 20.67 | 6.69 | 0.66 | 7.86 | 2.66 |
3.3. Determining the overexpression level in neuronal cell body
Using anti CaMKIIα antibody specific for both overexpressed and endogenous protein, the level of overexpression in the cell body, Ocb, was calculated. This was done by computing how much larger the immunostaining signal in GFPCaMKII-transfected cells was than that found in nearby cells. Note that the signal from overexpressing cells is a combination of signals from overexpressed and endogenous proteins, F’(o+e)cb. Therefore Ocb = F’(o+e)cb/Fe’cb. Immunostaining signal in nearby cells (Fe’cb) was measured by two ways: first, in nontransfected cells and second, in cell transfected with RFP alone. Fig. 3 shows how the measurements were done, and the results are shown in Table 2. Surprisingly, we found that CaMKIIα immunostaining signal in RFP-expressing cells (Fe’cb(rfp)) was smaller than that for nonexpressing control cells (Fe’cb(nexp)). On average, the difference was ~1.6 fold (Table 2). This observation suggests that expressed exogenous protein may compete with expression of endogenous CaMKII. This is consistent with another observation: when RFP was coexpressed with GFPCaMKII, RFP expression was normally lower than when it was expressed alone, also indicating that exogenously overexpressed proteins may compete with each other for synthesis resources (Fig. 3B). This competition was taken into account when the endogenous concentration of CaMKII was calculated (see below).
Figure 3.
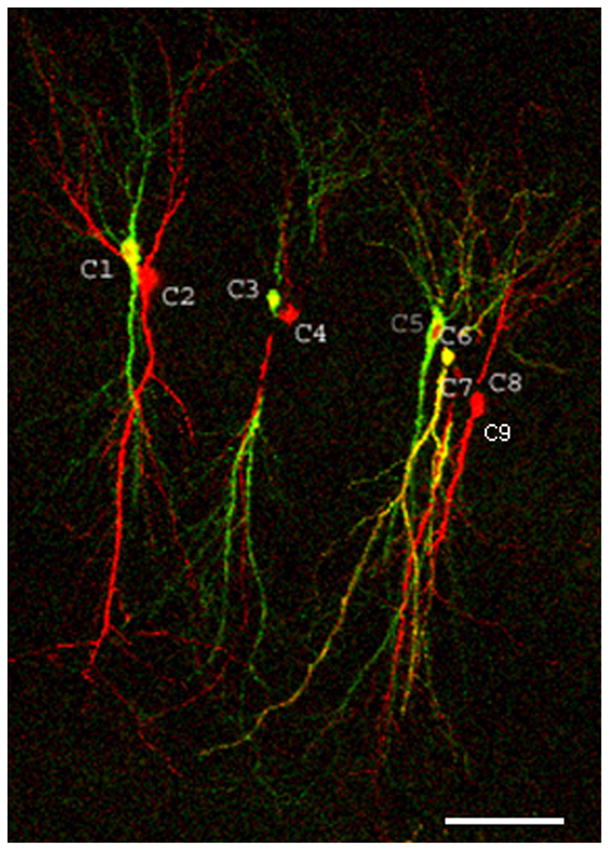
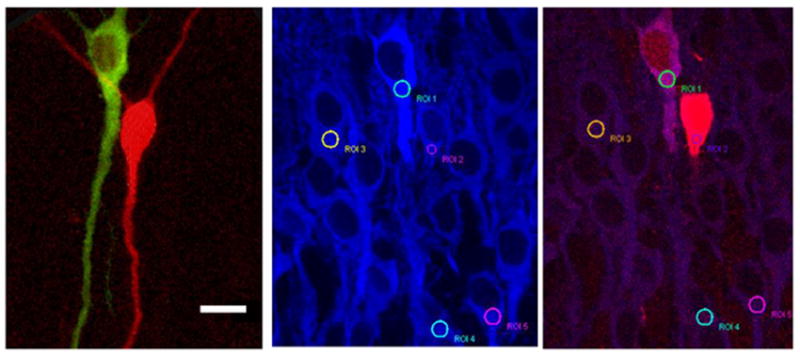
Measuring CaMKIIα immunostaining signal from thin slice sections. A, Low-magnification image of all nine cells expressing GFPCaMKII/RFP (yellowish) and RFP (red) in a single 30 μm thick section obtained from a fixed slice. The image is a maximal projection of Z stack green/red merged images; note that significant parts of cells 4, 7, and 8 were cut out of this section; Scale, 75 μm. B, Higher-magnification image of cells 1 and 2 (as numbered in A), Left panel – green/red overlapped image obtained from the live slice. Middle and right panels – same cell in fixed condition after labeling by anti-CaMKIIα/Alexa 405 antibodies (immunostaining -IS). Middle panel - CaMKIIα/Alexa 405 IS (blue); right panel - overlap of blue (IS) and red (mCherry) channels. Circles indicate ROIs for measuring IS signal in cell bodies. Note that the RFP expression was weaker in the cell that also expressed GFPCaMKII in comparison to the cell expressing only RFP.
Table 2.
Data for CaMKII immunostaining in cells expressing and nonexpressing RFP (cell body measurements)
| Cell # (RFP) | Cell # (GFPCaM KII/RFP) | CaMKIIα IS for RFP expressing cells: Fe(rfp) | CaMKIIα IS for non expressing cells: Fe(nexp) | R=Fe(nexp)/Fe(rfp) |
|---|---|---|---|---|
| C2 | C1 | 63 | 85* | 1.35 |
| C4 | C3 | 35 | 107* | 3.06 |
| C9 | C5 | 110 | 104* | 0.95 |
| C9 | C6 | 110 | 104* | 0.95 |
| Ave | 79.50 | 100.00 | 1.57 | |
| SE | 18.51 | 5.05 | 0.50 |
Left two columns show which RFP expressing cell served as a control pair for corresponding GFPCaMKII/RFP expressing cell. Numbering are the same as in Fig. 1. Note that C9 was used as a control for both C5 and C6 because cell 7 was cut out of this slice section.
indicates that each value is the average of immunostaining signal measured from somas of 5–10 cells near cells indicated in the left two columns.
3.4. Calculating endogenous protein concentration in the cell body
After determining the level of the overexpression (Ocb) and the concentration of the overexpressed protein (Cocb), the concentration of endogenous protein in the cell body, Cecb, was calculated as following: Cecb(rfp) = Cocb /(Ocb-1). Table 1 shows the measurements for four pairs of cells overexpressing GFPCaMKII/RFP and RFP only. Since we found that immunostaining signal in RFP-overexpressing cells was lower than that in nonoverexpressing cells by R fold (Table 2), the concentration of endogenous CaMKII in control cells was calculated as Cecb(nexp) =Cecb(rfp) *R. Although, on average, R ~1.6, since the correction was done for each cell pair individually, the difference this correction produced in calculated endogenous CaMKII concentration in cell bodies was only ~30% (49 versus 38 μM, Table 1). Therefore, our analysis showed that the average endogenous concentration of CaMKIIα in neuronal cell bodies in hippocampal slice cultures was 49 μM.
3.5. Determining the concentration of the endogenous CaMKII in spines
Since application of the above method for calculation of the endogenous concentration of CaMKII in spines is not possible (see section # 3.1), we designed two different approaches to accomplish this goal. In the first approach, we measured the spine/dendrite ratio of the overexpressed protein (GFPCaMKII) fluorescence. Care was taken to make sure that the dendrite diameter was larger than the PSF of the optical system (2 μM, see Methods). The spine/dendrite ratio of GFPCaMKII was normalized to that of RFP to adjust for spine volume differences: s/dnorm = (s /d)green / (s /d)red. Then, the dendritic endogenous concentration of the kinase, Ced, was measured using the method described above for the cell body. Finally, the spine concentration was calculated using these values: Ces = Ced * Ro(s/d)norm. This approach, though seemingly simple, is complicated in practice because it requires making measurements from the same dendritic segments in live and fixed preparations for both GFPCaMKII/RFP and only RFP-expressing dendrites. Identification of a small dendritic segment in fixed section is a very tedious process, especially if cell body of the parent cell is missing from the section. Therefore, in our second approach, most of the measurements were done in fixed slice sections on the dendritic segments that were present in these sections. In this approach, however, direct measurement of the dendritic concentration of the overexpressed protein by comparing fluorescence of the GFPCaMKII with that of GFP standard is not possible. Therefore, an additional step is introduced, in which cell body-to-dendrite fluorescence ratio of GFPCaMKII was measured first. After this, the dendritic concentration of the overexpressed protein was simply determined using data for somatic concentration from Table 1. Figs. 4 and 5 illustrate how these measurements and calculations were performed.
Figure 4.
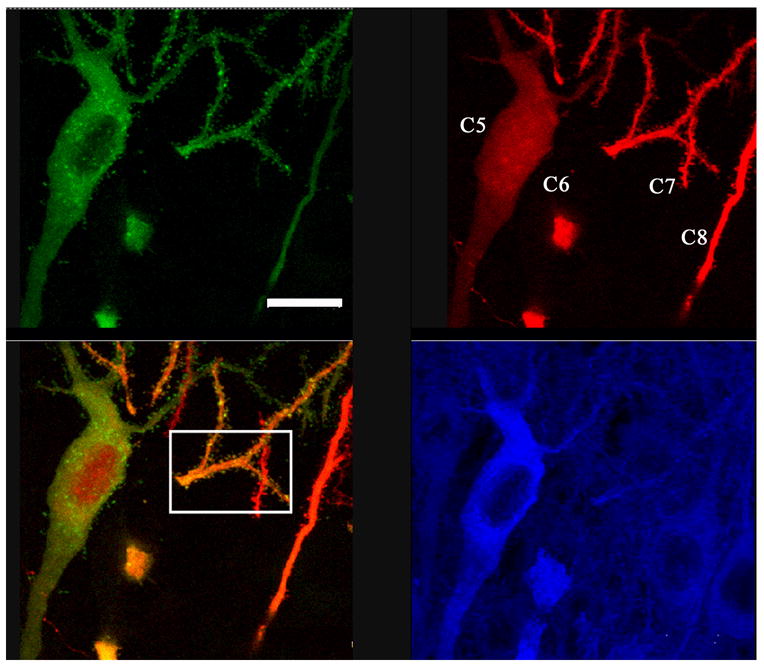
Images of GFPCaMKII (top left), RFP (top right), and CaMKIIα/Alexa405 immunostaining (bottom right) obtained from a 25 μm section of a fixed slice. Bottom left image is overlap of green and red channels. White square indicates region used to analyze spines (see Figs. 5). These are cells 5–8 (C5–C8), as shown in Figure 1. Note that most of C6 cell body was cut off from this slice section. From C7 and C8, only one dendritic segment was present in this section. Green and red images are maximal projections. Blue is a single focal plane image. Scale, 12 μm.
Figure 5.
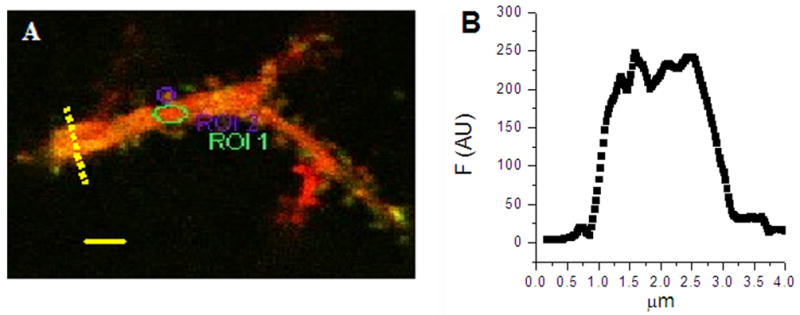
Measuring spine/dendrite ratio of the overexpressed GFPCaMKII. A, The image (green/red overlap) was obtained from the region marked in Fig. 4. Ellipses indicate ROIs for measuring fluorescence signal in spine and dendrite. Scale, 2 μm. B, Graph showing profile of red channel fluorescence along the dashed line indicated in A. It shows that the diameter of the dendrite is 2 μm.
3.5.1 Determining the spine/dendrite ratio of the overexpressed GFPCaMKII
The spine/dendrite ratio of GFPCaMKII was normalized to that of RFP to adjust for spine volume differences: Ro(s/d)norm = (Fos / Fod)green / (Fos / Fo d)red, where Fos and Fod are spine and dendritic fluorescence for green and red channels (Table 5).
Table 5.
Measurements of spine/dendrite and cell body/dendrite ratios of the GFPCaMKII for cell #6 in fixed slices
| Sp# | Fo(s)green | Fo(d)green | Fo(cb)green Cell 6 | Fo(s/d) norm | Fo(cb/d) | Fo(s)red | Fo(d)red |
|---|---|---|---|---|---|---|---|
| Sp1 | 45.00 | 70.00 | 220.00 | 1.50 | 3.14 | 90.00 | 210.00 |
| Sp2 | 43.00 | 60.00 | 220.00 | 3.15 | 3.67 | 50.00 | 220.00 |
| Sp3 | 49.00 | 85.00 | 220.00 | 1.68 | 2.59 | 75.00 | 218.00 |
| Sp4 | 80.00 | 75.00 | 220.00 | 2.84 | 2.93 | 90.00 | 240.00 |
| Sp5 | 23.00 | 73.00 | 220.00 | 1.65 | 3.01 | 33.00 | 173.00 |
| Sp6 | 70.00 | 68.00 | 220.00 | 2.06 | 3.24 | 90.00 | 180.00 |
| Ave | 51.67 | 71.83 | 220.00 | 2.15 | 3.10 | 71.33 | 206.83 |
| SE | 8.34 | 3.38 | 0.00 | 0.28 | 0.15 | 9.97 | 10.44 |
3.5.2 Determining the cell body / dendrite ratio of the overexpressed GFPCaMKII and the total (overexpressed plus endogenous) CaMKIIα
These measurements were performed from the images shown in Fig. 4. Although most of soma for cell #6 was missing from this section, the region that is present was sufficient to obtain the needed measurements. The dendrite/cell body ratio of the overexpressed protein, Rocb/d, was calculated as: Rocb/d= Focb/ Fod, wherein Focb and Fod are fluorescence intensity from somatic and dendritic ROI, respectively. The cell body / dendrite ratio, R(o+e)cb/d, of the total (overexpressed plus endogenous CaMKIIα) was calculated as: R(o+e)cb/d= F(o+e)cb / F(o+e)d, wherein F(o+e)cb and F(o+e)d are immunostaining fluorescence signals from somatic and dendritic ROI, respectively, in CaMKIIα/Alexa405 images. Overlapping red signal (RFP) and blue signal (immunostaining) images (not shown) were used to perform these measurements. Since the chosen dendritic shaft had a diameter larger than 2 μm (Fig. 5B), this ensured that the entire immunostaining signal in the dendritic ROI was from the dendrite of interest. Also, since both dendrite and cell body dimensions were larger than 2 μm, the normalization to the red signal was not needed.
3.5.3 Calculating the overexpressed and endogenous concentration of CaMKIIα in dendrites of the overexpressing cells
After determining the concentration of the overexpressed CaMKII in the cell body (Cocb, section #3.3) and the dendrite/cell body ratio of the overexpressed CaMKIIα (Rocb/d, section #3.5.2, Table 3), the overexpressed concentration of GFPCaMKII in the dendrite (Cod) was calculated as: Cod =Cocb/ Rocb/d.
Table 3.
Calculations of endogenous concentration of CaMKIIα in dendrites and spines of overexpressing cells
| Sp# | Ro(s/d) norm | Fo(d) | Ro(cb/d) | Co(d) | F(o+e)(d) | R(o+e)(cb/d) = F(o+e)(cb)/F(o+e)(d) | Ce(d)exp | Ce(s)exp |
|---|---|---|---|---|---|---|---|---|
| Sp1 | 1.50 | 70.00 | 3.14 | 22.27 | 93.00 | 2.69 | 24.02 | 36.03 |
| Sp2 | 3.15 | 60.00 | 3.67 | 16.36 | 112.00 | 2.23 | 39.39 | 124.20 |
| Sp3 | 1.68 | 85.00 | 2.59 | 32.84 | 115.00 | 2.17 | 24.40 | 40.89 |
| Sp4 | 2.84 | 75.00 | 2.93 | 25.57 | 140.00 | 1.79 | 44.12 | 125.50 |
| Sp5 | 1.65 | 73.00 | 3.01 | 24.22 | 113.00 | 2.21 | 32.03 | 52.90 |
| Sp6 | 2.06 | 68.00 | 3.24 | 21.02 | 120.00 | 2.08 | 38.71 | 79.71 |
| Ave | 2.15 | 71.83 | 3.10 | 23.71 | 115.50 | 2.20 | 33.78 | 76.54 |
| SE | 0.28 | 3.38 | 0.15 | 2.24 | 6.18 | 0.12 | 3.41 | 16.48 |
After that, the endogenous concentration of CaMKIIα in the dendrite was calculated as Ced =(Cocb+Cecb(rfp)) / R(o+e)cb/d - Cod, wherein (Cocb+Cecb(rfp)) is the sum of overexpressed and endogenous concentrations in the cell body from the Table 1, R(o+e)cb/d is the cell body / dendrite ratio of the total CaMKIIα in GFPCaMKII/RFP-expressing cell (from section #3.5.2, Table 3) and Cod is the concentration of the overexpressed CaMKIIα in the dendrite from above in this section.
3.5.4 Calculating the concentration of the endogenous CaMKIIα in spines (Ces)
This calculation was first done for cells overexpressing GFPCaMKII/RFP (Ces) since measuring immunostaining signal in dendrites of control (nontransfected) cell was not possible (see section 3.1). Therefore, Ces(rfp) = Ced * Ro(s/d)norm, wherein Ced and Ro(s/d)norm are from sections # 3.5.3 and # 3.5.1 (Table 3), respectively. To calculate the endogenous concentration of CaMKIIα in spines of control (nonexpressing) cells, we multiplied the above value by factor R (see section #3.3). For cell #6, which was chosen for the spines analysis, this factor was 0.95 (Table 2). Therefore, Ces(nexp) = Ces * R (Table 4).
Table 4.
Calculations for endogenous concentration of CaMKIIα in dendrites and spines of nonexpressing cells
| Sp# | Ce(s) | Ce(d) |
|---|---|---|
| Sp1 | 34.06 | 22.71 |
| Sp2 | 117.42 | 37.24 |
| Sp3 | 38.66 | 23.07 |
| Sp4 | 118.65 | 41.71 |
| Sp5 | 50.01 | 30.28 |
| Sp6 | 75.36 | 36.60 |
| Ave | 72.36 | 31.94 |
| SE | 15.58 | 3.22 |
Therefore, our measurements show that the average concentrations of endogenous CaMKIIα subunits in spines and dendrites are ~72 and 32 μM, respectively.
We found that concentrations of both overexpressed and endogenous CaMKII decrease in dendrites in comparison to cell body. Interestingly, this decrease was smaller for endogenous CaMKIIα, 1.6 fold, in comparison to the overexpressed GFPCaMKIIα, 3.1 fold, consistent with the fact that endogenous CaMKII can be synthesized not only in cell bodies, but also in dendrites, while overexpressed GFPCaMKIIα is mostly synthesized in the soma.
3.6. An adjustment added to calculations
In the above calculations, we assumed that all GFP fused to CaMKII is fully matured and produces fluorescence upon excitation. Previous work, however, showed that, although maturation of GFP synthesized in bacteria is very high (>90%), GFP in fusion proteins expressed in slices may mature only by 65-80% (Lee et al., 2009; Sugiyama et al., 2005). Since both of these publications showed a similar fraction of maturation, we adjusted our calculations using a maturation fraction of 70%. In this case, the calculated endogenous concentrations of CaMKIIα subunits in the cell body, a proximal dendrite, and spines on this dendrite are 71, 46, and 103 μM.
4. Discussion
Here, we described a relatively simple method for measuring the endogenous concentration of molecules even in small cellular compartments such as dendritic spines. To our knowledge, there have been no previous publications of a method with similar capabilities. Two previous published methods allowed either estimation of a cellular protein only in larger compartments such as neuronal cell body (Lee et al, 2009) or measurement of the number of molecules without calculating their concentrations (Sugiyama et al., 2005). This last method also required complicated procedures, including the measurement of single-molecule fluorescence. Our method has the advantage of relative simplicity. It also allows calculation of concentrations in compartments below the resolution of the light microscope such as dendritic spines. The method is based on several assumptions that are discussed below.
4.1. Method assumptions and possibility for further improvements
One assumption is that the efficiency of the antibody that we used to label CaMKII by immunostaining is equal for the endogenous and overexpressed protein. In the study of (Sugiyama et al., 2005), the antibody efficiency comparison was tested for several postsynaptic proteins and found to be similar for endogenous and overexpressed proteins.
Another assumption is that cells of the same type (pyramidal cells in our case) that are in the close proximity to each other contain, on average, a similar amount of the protein of interest and that the distribution of this protein among different cellular compartments is, on average, also similar. Our immunostaining images and quantifications are consistent with these assumptions. This assumption, however, needs to be tested for each protein, specifically, if the expression and/or cellular distribution of the studied protein are activity dependent. One limitation of the method is that the protein of interest has to be distributed homogeneously, at least in some cell regions, and the pattern of distribution should be similar within cells of the same type.
One more assumption was that the immunostaining signal had a linear relationship with the concentration of the endogenous protein. One approach to test this could be to perform immunostaining on preparations with known concentrations of the protein of interest, for example, by infusing different concentrations of the protein into cells that do not express the protein. As mentioned above, this approach has its own limitations. A simpler but not so direct approach could be to measure the relationship between the immunostaining signal and the GFP signal of the overexpressed GFP-fused protein of interest in cells that natively do not express this protein. This approach was used in (Harvey et al., 2008). That study demonstrated that the immunostaining signal of an overexpressed GFP-fused protein was linearly proportional with the concentration of the overexpressed protein, as judged by the GFP fluorescence intensity. Notably, the linearity maintained over a 20 fold range of the overexpression.
Another assumption was that the spine-to-dendrite ratio of CaMKII is similar for the endogenous and overexpressed protein. We think that this is a reasonable assumption considering that there is a soluble CaMKII pool in dendrites for both of these proteins, and the diffusion between spine and dendrite is not restricted (Lee et al., 2009; Otmakhov et al., 2007; Shen and Meyer, 1998). However, the endogenous CaMKII can be synthesized in the dendrite and possibly in the spine itself since its mRNA contains an untranslatable region that controls dendritic delivery and translation (Mayford et al., 1996). Because this region was absent in the CaMKII cDNA used in our study, the overexpressed protein should be mostly translated in soma. Therefore, it is possible that the distribution of the endogenous and the overexpressed proteins between spine and dendrite is not completely identical. This possibility could be tested using a superresolution optical method, such as PALM, STORM, or STED (Patterson et al., 2010).
An additional assumption was that the ratios of α and β subunits are similar in the cell body, dendrite, and spines. If this is not the case due to preferential synthesis of α subunit in dendrites and spines, then our calculations would have to be corrected. Perhaps, this could be roughly estimated using double-antibody staining against α and β subunits and calculating their ratio in different cellular compartments.
In this study, we analyzed a dendritic branch that was very close to the cell body, and they both were located very close (within 10–15 μm) to the slice surface. In the case in which these structures are located deeper in the slice, additional adjustments need to be applied for the decline of fluorescence with depth in the slice. The rate of this decline can be measured by imaging a fluorescent bead (glued in the tip of a glass pipette) at different slice depths.
When measuring the slope of the GFP standard, we used two assumptions. The first is that the relationship between the GFP concentration and its fluorescence is linear at all concentration ranges used in the study. The maximal concentration of the GFP standard sample that we could obtain was 40 μM, which produced fluorescence equal 100 AU. Most of our cells, however, with the same imaging parameters, showed fluorescence of the overexpressed protein between 160 and 250 AU. Additionally, the GFP standard was prepared in PBS. There are some reports that the slope of GFP standard fluorescence may depend on the fluorophore environment (Richards et al., 2003). Although it would be very difficult to reproduce the intracellular environment for measuring GFP standard fluorescence, two approaches could be tried: to infuse different concentrations of GFP into the cell body or to perform these measurements in tissue homogenate. Both of these approaches have their limitations. The concern of linear relationship would be eliminated if a lower level of overexpression was used.
Using a lower level of the overexpression could also be advantageous for other reasons. First, as we found, the overexpressed protein may affect expression of endogenous proteins. Second, a high level of the overexpression may also affect the spatial distribution of protein in the cell, for example, the spine to dendrite ratio. Therefore, using the minimal possible level of overexpression should improve the method.
During analysis, we discovered an interesting finding. Our calculations suggested that overexpressing exogenous protein may result in a decrease of expression of endogenous proteins, perhaps due to competition for cellular resources. Specifically, we found that CaMKIIα immunostaining signal was smaller in RFP-expressing cells than in nonexpressing cells. This finding, however, needs further conformation since the sample size was not large.
4.2. Method application
We applied this method to the estimation of the concentration of CaMKIIα in the CA1 region in hippocampal pyramidal cells. Our calculations showed that the concentrations of CaMKIIα subunits in cell body, a proximal dendrite, and spines on this dendrite are 71, 46, and 103 μM, respectively. Considering the 3:1 ratio of α to β subunits in the hippocampus, the concentrations of the total (α + β) CaMKII subunits in the same compartments are 94, 61, and 138 μM. Correspondingly, the concentrations of 12 subunit holoenzymes in the cell body are ~8 μM; in the proximal dendrite, ~5 μM; and in spines on the proximal dendrite, ~12 μM. The value for the somatic concentration of CaMKIIα subunits, which we obtained, using our method (71 μM), was within the broad range reported in a previous publication (~10–100 μM) (Lee et al., 2009). To our knowledge, there were no previous publications regarding the endogenous concentrations of CaMKII in spines and dendrites. In another study, which addressed this issue (Feng, Lisman in press), values for endogenous holoenzyme concentration of CaMKII in dendrites and spines were obtained using a completely different approach. Their values for dendrites and spines (6 and 12 μM, respectively) are remarkably similar to our estimates (5 and 12 μM, respectively). In their approach, the CaMKII concentrations were calculated from published values of the total hippocampal concentration of CaMKII, relative volumes of different cellular compartments, and the spine-dendrite ratio of CaMKII. In comparison to this approach, which allows estimation of averaged protein concentrations in cell compartments, our methodology provides a capability of measuring concentrations of molecules in a specific dendritic region. For example, we found that CaMKII concentration is smaller in dendrites in comparison to that in cell body. Interestingly, the decrease of CaMKII concentration in dendrites was ~1.6 fold for the endogenous protein but more than 3 fold for the overexpressed protein. This finding is consistent with the fact that knowledge that endogenous CaMKIIα can be synthesized in both dendrites and spines, whereas overexpressed protein is mostly synthesized in the cell body (see Discussion above). Notably, if this trend is confirmed for more distal dendrites, this would indicate that endogenous concentration of CaMKII in dendrites decreases with the distance from cell body.
Although we applied our method to measuring an abundant protein, we expect that the method should work for less-abundant proteins as well. For example, Harvey and coauthors estimated the level of overexpression of Ras protein in hippocampal slices. Since Ras is not only much less abundant but also primarily membrane bound (Harvey et al., 2008), these data suggest that the general methodology described here has significant potential for further expansion. Therefore, we hope that our method will be a helpful tool in obtaining precision data that can be used in neuro-computational modeling.
We developed a method for measuring the endogenous concentration of a protein in small cellular compartments in brain tissue.> The method involves overexpression of the protein of interest which is fused with a fluorescent protein such as GFP.> Overexpression of a soluble fluorescent protein with shifted emission (RFP) is also needed for demarcating the cell volume.> It also requires immunostaining and high - resolution fluorescence confocal or two-photon imaging.> The method was applied for measuring the endogenous concentration of CaMKII in cell soma, dendrites, and dendritic spines.>
Acknowledgments
The study was supported by the NIH grants R01NS27337 and R01DA027807.
Abbreviations
- CaMKII
Ca/Calmodulin kinase II
- IS
immunostaining
Footnotes
Appendices Excel file with all data and equations can be provided upon request.
Publisher's Disclaimer: This is a PDF file of an unedited manuscript that has been accepted for publication. As a service to our customers we are providing this early version of the manuscript. The manuscript will undergo copyediting, typesetting, and review of the resulting proof before it is published in its final citable form. Please note that during the production process errors may be discovered which could affect the content, and all legal disclaimers that apply to the journal pertain.
Contributor Information
Nikolai Otmakhov, Email: otmakhov@brandeis.edu.
John Lisman, Email: Lisman@brandeis.edu.
Literature
- Byrne MJ, Waxham MN, Kubota Y. The impacts of geometry and binding on CaMKII diffusion and retention in dendritic spines. J Comput Neurosci. 2010 doi: 10.1007/s10827-010-0293-9. [DOI] [PMC free article] [PubMed] [Google Scholar]
- Haas K, Sin W, Javaherian A, Li Z, Cline HT. Single-cell electroporation for gene transfer in vivo. Neuron. 2001;29:583–91. doi: 10.1016/s0896-6273(01)00235-5. [DOI] [PubMed] [Google Scholar]
- Harris KM, Stevens JK. Dendritic spines of CA 1 pyramidal cells in the rat hippocampus: serial electron microscopy with reference to their biophysical characteristics. J Neurosci. 1989;9:2982–97. doi: 10.1523/JNEUROSCI.09-08-02982.1989. [DOI] [PMC free article] [PubMed] [Google Scholar]
- Harvey CD, Yasuda R, Zhong H, Svoboda K. The spread of Ras activity triggered by activation of a single dendritic spine. Science. 2008;321:136–140. doi: 10.1126/science.1159675. [DOI] [PMC free article] [PubMed] [Google Scholar]
- Kasai H, Fukuda M, Watanabe S, Hayashi-Takagi A, Noguchi J. Structural dynamics of dendritic spines in memory and cognition. Trends Neurosci. 2010;33:121–9. doi: 10.1016/j.tins.2010.01.001. [DOI] [PubMed] [Google Scholar]
- Lee SJ, Escobedo-Lozoya Y, Szatmari EM, Yasuda R. Activation of CaMKII in single dendritic spines during long-term potentiation. Nature. 2009;458:299–304. doi: 10.1038/nature07842. [DOI] [PMC free article] [PubMed] [Google Scholar]
- Mayford M, Baranes D, Podsypanina K, Kandel ER. The 3’-untranslated region of CaMKII alpha is a cis-acting signal for the localization and translation of mRNA in dendrites. Proc Natl Acad Sci U S A. 1996;93:13250–5. doi: 10.1073/pnas.93.23.13250. [DOI] [PMC free article] [PubMed] [Google Scholar]
- Neves SR, Tsokas P, Sarkar A, Grace EA, Rangamani P, Taubenfeld SM, Alberini CM, Schaff JC, Blitzer RD, Moraru II, Iyengar R. Cell shape and negative links in regulatory motifs together control spatial information flow in signaling networks. Cell. 2008;133:666–80. doi: 10.1016/j.cell.2008.04.025. [DOI] [PMC free article] [PubMed] [Google Scholar]
- Otmakhov N, Asrican B, Lisman J. Society for Neurosci. Vol. 788. Society for Neuroscience online; San Diego: 2007. Measuring dynamic exchange of bound CaMKIIa in spines and dendrites; p. 8. [Google Scholar]
- Otmakhov N, Tao-Cheng JH, Carpenter S, Asrican B, Dosemeci A, Reese TS, Lisman J. Persistent accumulation of calcium/calmodulin-dependent protein kinase II in dendritic spines after induction of NMDA receptor-dependent chemical long-term potentiation. J Neurosci. 2004;24:9324–31. doi: 10.1523/JNEUROSCI.2350-04.2004. [DOI] [PMC free article] [PubMed] [Google Scholar]
- Patterson G, Davidson M, Manley S, Lippincott-Schwartz J. Superresolution imaging using single-molecule localization. Annu Rev Phys Chem. 2010;61:345–67. doi: 10.1146/annurev.physchem.012809.103444. [DOI] [PMC free article] [PubMed] [Google Scholar]
- Pi HJ, Otmakhov N, Lemelin D, De Koninck P, Lisman J. Autonomous CaMKII can promote either long-term potentiation or long-term depression, depending on the state of T305/T306 phosphorylation. J Neurosci. 2010;30:8704–9. doi: 10.1523/JNEUROSCI.0133-10.2010. [DOI] [PMC free article] [PubMed] [Google Scholar]
- Richards HA, Halfhill MD, Millwood RJ, Stewart CN. Genetic Transformation and Hybridization Quantitative GFP fluorescence as an indicator of recombinant protein synthesis in transgenic plants. Plant Cell Reports. 2003;22:117–21. doi: 10.1007/s00299-003-0638-1. [DOI] [PubMed] [Google Scholar]
- Shen K, Meyer T. In vivo and in vitro characterization of the sequence requirement for oligomer formation of Ca2+/calmodulin-dependent protein kinase IIalpha. J Neurochem. 1998;70:96–104. doi: 10.1046/j.1471-4159.1998.70010096.x. [DOI] [PubMed] [Google Scholar]
- Sugiyama Y, Kawabata I, Sobue K, Okabe S. Determination of absolute protein numbers in single synapses by a GFP-based calibration technique. Nat Methods. 2005:677–84. doi: 10.1038/nmeth783. [DOI] [PubMed] [Google Scholar]
- Zhabotinsky AM, Camp RN, Epstein IR, Lisman JE. Role of the neurogranin concentrated in spines in the induction of long-term potentiation. J Neurosci. 2006;26:7337–47. doi: 10.1523/JNEUROSCI.0729-06.2006. [DOI] [PMC free article] [PubMed] [Google Scholar]