Abstract
In vivo video microscopy has been used to study blood flow regulation as a function of varying oxygen concentration in microcirculatory networks. However, previous studies have measured the collective response of stimulating large areas of the microvascular network at the tissue surface.
Objective
We aim to limit the area being stimulated by controlling oxygen availability to highly localized regions of the microvascular bed within intact muscle.
Design and Method
Gas of varying O2 levels was delivered to specific locations on the surface of the Extensor Digitorum Longus muscle of rat through a set of micro-outlets (100 μm diameter) patterned in ultrathin glass using state-of-the-art microfabrication techniques. O2 levels were oscillated and digitized video sequences were processed for changes in capillary hemodynamics and erythrocyte O2 saturation.
Results and Conclusions
Oxygen saturations in capillaries positioned directly above the micro-outlets were closely associated with the controlled local O2 oscillations. Radial diffusion from the micro-outlet is limited to ~75 μm from the center as predicted by computational modelling and as measured in vivo. These results delineate a key step in the design of a novel micro-delivery device for controlled oxygen delivery to the microvasculature to understand fundamental mechanisms of microvascular regulation of O2 supply.
Keywords: In vivo video-microscopy, microcirculation, microfabrication, oxygen delivery, micro-delivery, hemodynamic parameters
Introduction
Several medical conditions which are characterized by microvascular dysfunction lead to more critical problems such as tissue hypoxia and organ failure [5]. The understanding of the pathophysiology underlying these conditions depends on the understanding of oxygen (O2) transport and its regulation under physiological conditions. Previous studies have demonstrated that red blood cells (RBCs) have an oxygen-dependent release of adenosine triphosphate (ATP), which is directly correlated to the oxygen saturation level of haemoglobin [9,10,17]. Under hypoxic conditions, a signal transduction pathway is modulated in RBCs which results in increased ATP release and purinergic receptor activation on the vascular endothelium [9]. In arterioles this leads to the production of signalling molecules such as nitric oxide (NO) in the endothelium that cause local vascular smooth muscle dilation. In addition, activation of P2Y2 receptors initiates conducted signalling along the vascular endothelium in both arterioles and capillaries resulting in upstream vascular dilation to increase the supply of more oxygen carrying red blood cells [9]. Type II diabetes is a medical condition associated with peripheral vascular dysfunction and impaired tissue oxygenation. Interestingly, it has been recently shown that RBCs from type II diabetes patients suffer defects in the release of ATP [21] and that RBCs from humans and animal models of prediabetes have attenuated release of ATP in response to a decrease in oxygen levels [13, 4].
In vivo video-microscopy (IVVM) techniques, which allow for monitoring and recording real-time changes in blood flow properties within the microcirculation [2,4,24], have been used to study the blood flow characteristics as a function of local oxygen concentration in capillary microcirculatory networks. The classical setup involves altering O2 partial pressure (PO2) levels in the superfusion solution equilibrating the surface of a tissue or a vessel [3,16]. However, the use of a superfusion solution may alter the physiological environment by continuously washing away substances from the surface of the tissue and can potentially affect the microvascular response by depleting the tissue of molecules involved in microvascular signalling. Another limitation of using superfusion solution as a medium for oxygen delivery is the relatively low solubility of O2 in saline solution.
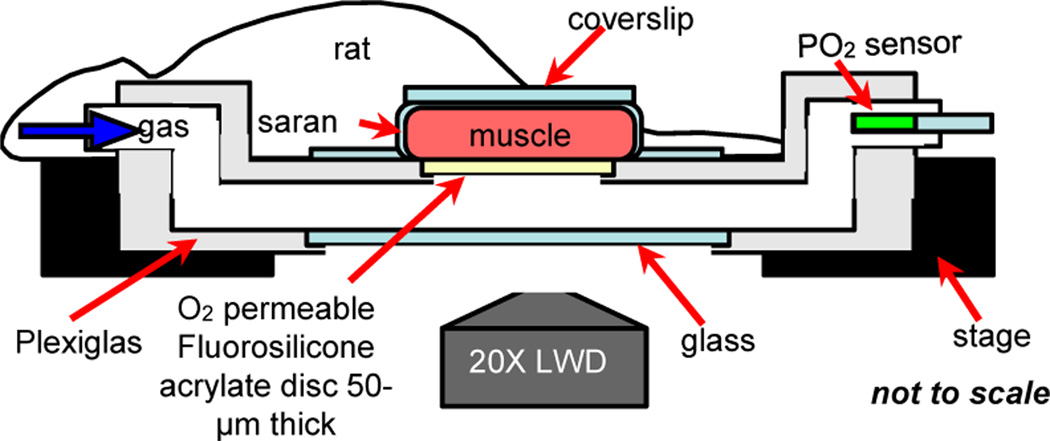
The IVVM setup currently used in our lab involves varying the levels of O2 transported to the surface of the rat Extensor Digitorum Longus (EDL) muscle using a gas exchange chamber positioned on the viewing platform of an inverted microscope (see Figure 1). More specifically, oxygen is delivered through a 4 mm × 10 mm window covered with fluorosilicone acrylate oxygen permeable membrane 50 μm in thickness. The tissue is trans-illuminated and real-time videos of blood flow changes in the microcirculation are recorded while simultaneously controlling local oxygen levels in the chamber using computer-controlled flow meters. Direct O2 delivery through a highly O2 permeable membrane such as fluorosilicone acrylate (O2 permeability coefficient = 100 Barrers, where 1 Barrer = 10−11 cm3 (STP) .cm/ cm2 .sec .mmHg [1]) has a greater effect on tissue PO2 levels than when using liquid media. Also, this setup offers minimal disturbance to the tissue’s physiological environment. However, the dimensions of the oxygen delivery window are proportional to the in situ dimensions of the EDL muscle. Hence, the current IVVM setup measures the collective response of stimulating a very large area of the microvascular network at the muscle surface (Figure 1). Riemann et al. [20] have recently tried to limit the area affected by O2 using micropipettes infusing liquids with low O2 but without measurement of the impact on tissue O2 levels or RBC saturation. The ability to measure RBC O2 saturation is critical to establish that a signal is induced [16].
Figure 1.
IVVM classical experimental setup. Extensor Digitorum Longus (EDL) muscle of the rat is surgically exposed and is positioned surface down on the viewing platform of an inverted light microscope. Oxygen is delivered to the muscle using a gas exchange chamber connected to computer-controlled flow meters. Oxygen levels in the chamber are measured and monitored using a fibre optic oxygen sensor probe. The tissue is trans-illuminated and blood flow responses are recorded and analyzed as oxygen levels are simultaneously oscillated.
In this study, we aim to develop a micro-delivery approach for investigating localized microvascular signalling and response to varying tissue PO2 levels. We have limited the stimulated region at the microvascular bed within live muscle tissue (rat EDL) by 40 fold relative to the original gas exchange chamber setup. Gas with varying levels of O2 was directly transported to the surface of the EDL muscle through a set of micro-outlets (~100 μm in diameter) patterned in ultrathin glass sheet using state-of-the-art microfabrication techniques. RBC O2 saturation changes due to oxygen level oscillations were measured and recorded while simultaneously controlling local oxygen levels. This novel approach shall provide greater insight into the underlying mechanisms of microvascular control.
Materials and Methods
Mathematical modeling of the PO2 distribution profile
The oxygen partial pressure (PO2) distribution profile through an oxygen delivery micro-outlet interfaced directly with live tissue was modeled using an O2 transport code written in MATLAB (Mathworks, Natick, MA). The model simulates oxygen diffusing through varying sized outlets (20 μm, 50 μm, 100 μm, and 200 μm in diameter) patterned in a zero thickness material into tissue that consumes O2 and also has a continuous distribution of capillary O2 sources. We have shown previously that O2 transport through tissue of this type differs from O2 transport through a purely diffusive medium [12]. In the present case, a finite-difference method is used to solve the axisymmetric 3-D problem of axial and radial diffusion, for instance, from a 100 μm outlet (x=0, r≤50 μm) into the overlying tissue (0<x≤500 μm, 0μm<r≤500 μm) with no-flux boundary conditions at r=500 μm, x=500 μm and x=0 for r>50 μm. The micro-outlet PO2 was set to be 205 mmHg (27% O2) and the far-field tissue PO2 (P∞) was set to be 42 mmHg (typical tissue PO2 under normal resting conditions). As described in [12], the other parameters needed for the O2 transport model were the tissue O2 diffusion coefficient D=2.41×10⁻⁵cm2/s, O2 solubility α=3.89×10⁻⁵ ml O2/ml/mmHg, and O2 consumption rate M0=1.5 10−4 ml O2/ml/s, and the mean capillary PO2 (P*=48 mmHg), Note that P∞ and P* represent, respectively, average tissue and capillary values far from the outlet, and hence should not be affected by the outlet PO2.
Microfabrication
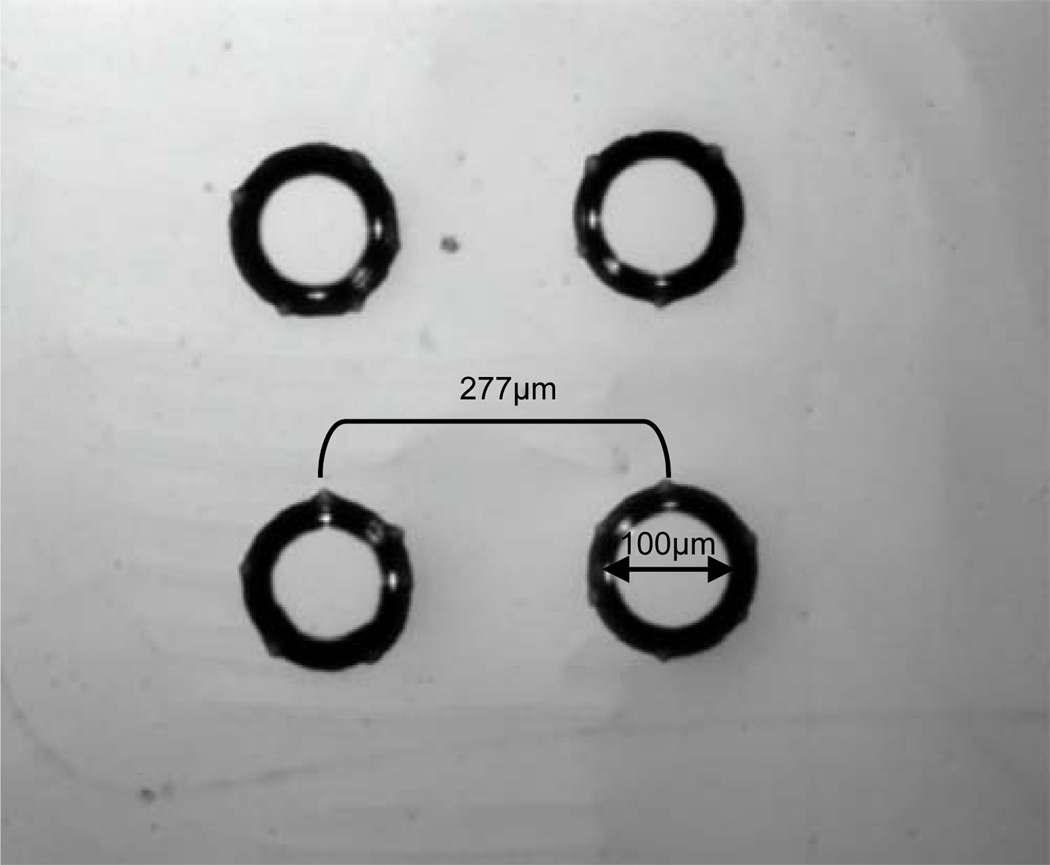
Oxygen delivery micro-outlets with a diameter of ~ 100 μm and a pitch of ~ 277 μm (center-to-center) were patterned in 30 μm thick D263C borosilicate glass substrate (SCHOTT North America) by photolithography and subsequent wet etching in hydrogen fluoride. The photolithography and wet etching steps were carried out similar to previously described procedures [15,22]. Since the etching is isotropic, there is a certain degree of undercutting beneath the masking layers [15]. This results in the pattern to be larger on the glass relative to the photomask. Also, due to the undercutting, the micro-outlet would be cone-shaped rather than cylindrically shaped, which means that the diameter is larger right beneath the masking layer. All pattern dimensions were optically measured at the top glass surface (glass surface directly beneath the masking layers) using QCapture Pro™ 6.0 software. The patterned ultrathin glass substrate replaced the oxygen permeable fluorosilicone acrylate in the original IVVM setup (Figure 1).
In vivo video microscopy
RBC O2 saturation levels in response to oxygen delivery through the micro-outlets were measured using in vivo video microscopy (IVVM) techniques. These measurements were used to assess the tissue response time for oxygen delivery from the micro-outlets as well as to validate the model results.
Animal preparation
All procedures described are approved from the University of Western Ontario’s Animal Care and Use Committee. Male Sprague-Dawley rats (Charles River Laboratories, Wilmington, MA) (150–200 g) were anesthetized with pentobarbital sodium (6.5 mg/100 g body wt IP) and were subjected to a preparatory surgery as described [4,6]. The animals were mechanically ventilated at 30% Oxygen (70% Nitrogen), and the inspired oxygen level (Oxychek) and blood pressure (MicroMed) were constantly monitored and recorded [4]. The Extensor Digitorum Longus (EDL) muscle of the hind limb was identified and prepared for in vivo video microscopy as described by Tyml and Budreau [23]. The muscle was extended along the viewing platform of a Nikon inverted microscope equipped with long-working distance 10X and 20X objectives and a beam splitter for dual video cameras (DAGE-MTI CCD cameras). A suture attached to the edge of the muscle was taped to the platform. The muscle was covered with Saran Wrap (Dow Corning) and a cover slip to isolate it from room air and to preserve moisture. The tissue was trans-illuminated with a 100-W xenon lamp and viewed using the dual video camera system as described [4].
Dual video camera intravital microscopy system
Real-time video recordings (640 × 480, 30 frames/second) of RBC flow through capillaries were simultaneously obtained at two wavelengths, 431 nm, an oxygen sensitive wavelength for hemoglobin, and 420 nm, an isosbestic or oxygen insensitive wavelength [11] using the dual video camera intravital microscopy system [4]. Live video sequences were digitized and stored as uncompressed AVI movie files using custom acquisition software from Neovision [4] for post-processing. Geometric, spatiotemporal, and photometric off-line analyses of the AVI files (420 nm and 431 nm wavelengths) were conducted as described by Ellis et al. [7–8] and Japee et al. [18–19] using algorithms written in MATLAB (Mathworks, Natick, MA) to quantify changes in capillary hemodynamic parameters and erythrocyte oxygen saturation (SO2). Parameters measured include average RBC velocity, supply rate, lineal density, and RBC O2 saturation [7–8, 18–19].
Results
Mathematical modeling of the PO2 distribution profile
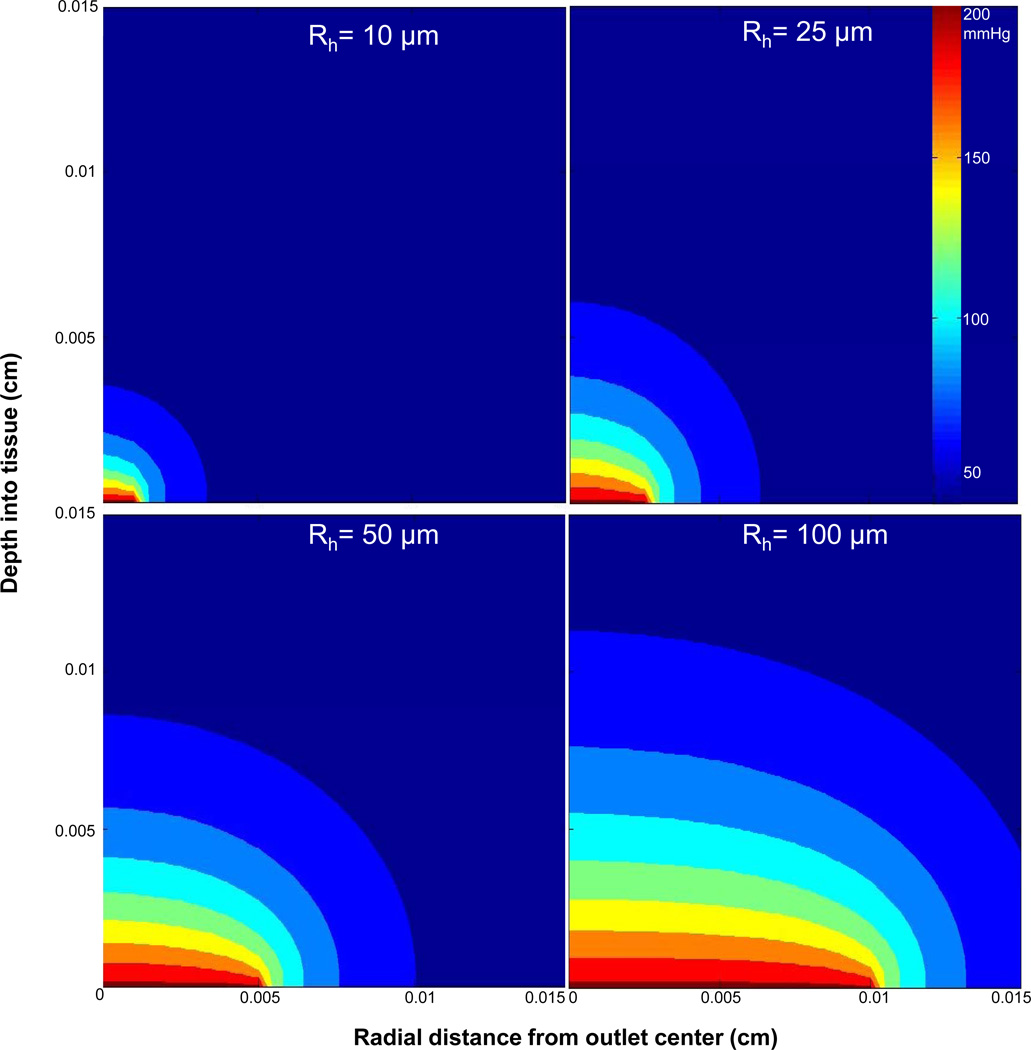
In this project, microvascular responses to variations of local tissue PO2 levels were examined by delivering or removing oxygen at specific locations on the surface of the rat EDL muscle through a set of micro-outlets patterned in ultrathin glass. Prior to the microfabrication step (see Experimental), the desired micro-outlet diameter was estimated by computational modeling in MATLAB (Mathworks, Natick, MA). The criteria guiding the modeling and final selection of micro-outlet geometry were determined by the maximum depth a capillary can be into the tissue for accurate analysis with our current microscopy techniques (50–60 μm) and the average dimensions of a microvascular unit (150 μm ×400 μm). Also, the separation between adjacent micro-outlets must be great enough for the PO2 stimuli from each to be independent. Thus, in the simulation, the micro-outlet diameter was selected based on the depth of O2 penetration into the tissue and the degree of radial diffusion away from the center of the outlet. Optimal micro-outlet dimensions would allow for limiting the amount of radial diffusion of oxygen away from the center of an outlet, which maximizes the amplitude of oxygen diffusion into the tissue. The PO2 distribution model for micro-outlets 20 μm, 50 μm, 100 μm, and 200 μm in diameter (see Experimental) showed an increase in the depth of penetration with increasing micro-outlet diameter; however, the degree of radial diffusion was unaffected by the size of the micro-outlet (Figure 2). The simulation suggested a limited amount of radial diffusion extending to about 25% of the micro-outlet diameter. The model indicated that below a 100 μm outlet diameter the depth of PO2 transport into the tissue is too small to ensure that capillary oxygenation will be affected. Above 100 μm, the depth of PO2 transport increases; yet accompanied by a concurrent increase in the area of the tissue influenced by local PO2 changes. For a 100 μm outlet, we could affect an area ~ 150 μm in diameter with a depth of penetration of ~55 μm per outlet (Figure 2). Thus, a 100 μm micro-outlet was chosen as the minimum desired size since it would allow for altering the O2 level of a specific region within a microvascular unit to the depth of our ability to analyze. The original oxygen delivery system was modeled as 1D diffusion resulting in the depth of penetration of ~100 μm [12]. With the micro-outlets the diffusion is physically 3D (mathematically 2D due to axisymmetry) and as expected the depth of penetration is less.
Figure 2.
Calculated PO2 distribution for oxygen delivery into live metabolic tissue through micro-outlets of various sizes (20 μm, 50 μm, 100 μm, and 200 μm in diameter). Using Pnorm(r,x) = (P(r,x)−P∞)/ (Poutlet − P∞) and a cut-off of Pnorm=0.25, the radius of lateral oxygen diffusion from the center of the micro-outlet is constant at ~150% of the radius while the depth of penetration increases with increasing outlet radius. The width of the tissue in this model (Rt) was set to 500 μm, however, the maximum value on the x-axis in the PO2 distribution plots was set to 150 μm. Computational modelling was conducted using algorithms written in MATLAB (Mathworks, Natick, MA).
Microfabrication
Oxygen delivery micro-outlets were patterned in ultrathin D263T borosilicate glass substrate (SCHOTT North America) based on the mathematical PO2 distribution model described before. To test microvascular responses at different areas on the surface of the EDL muscle, multiple micro-outlets were patterned in ultrathin glass with a diameter of ~ 100 μm separated by ~ 277 μm center-to-center distance (Figure 3). The area simultaneously examined could be within a single microvascular network unit (~ 150 μm × 400 μm) or could be located at adjacent units.
Figure 3.
Oxygen delivery micro-outlets ~100 μm in diameter separated by ~277 μm distance (center-to center) patterned in D263T borosilicate ultrathin glass substrate (SCHOTT North America) as they appear under an upright light microscope at 10x objective. The micro-outlets were microfabricated using photolithography and subsequent wet etching in hydrogen fluoride.
Micro-delivery system in vivo validation
Prior to in vivo analysis, oxygen delivery through the designed micro-outlets was verified in vitro using the NeoFox® Phase Measurement System (O2 sensing cover slip, FOXY sensor formulation, Ocean Optics, Inc.). Parameters examined included the PO2 level changes associated with the micro-outlets and the response time. Following the in vitro validation, the effects of oxygen delivery through the micro-outlets were tested on live tissue (rat EDL muscle) using IVVM (see Experimental).
Sine wave oscillations
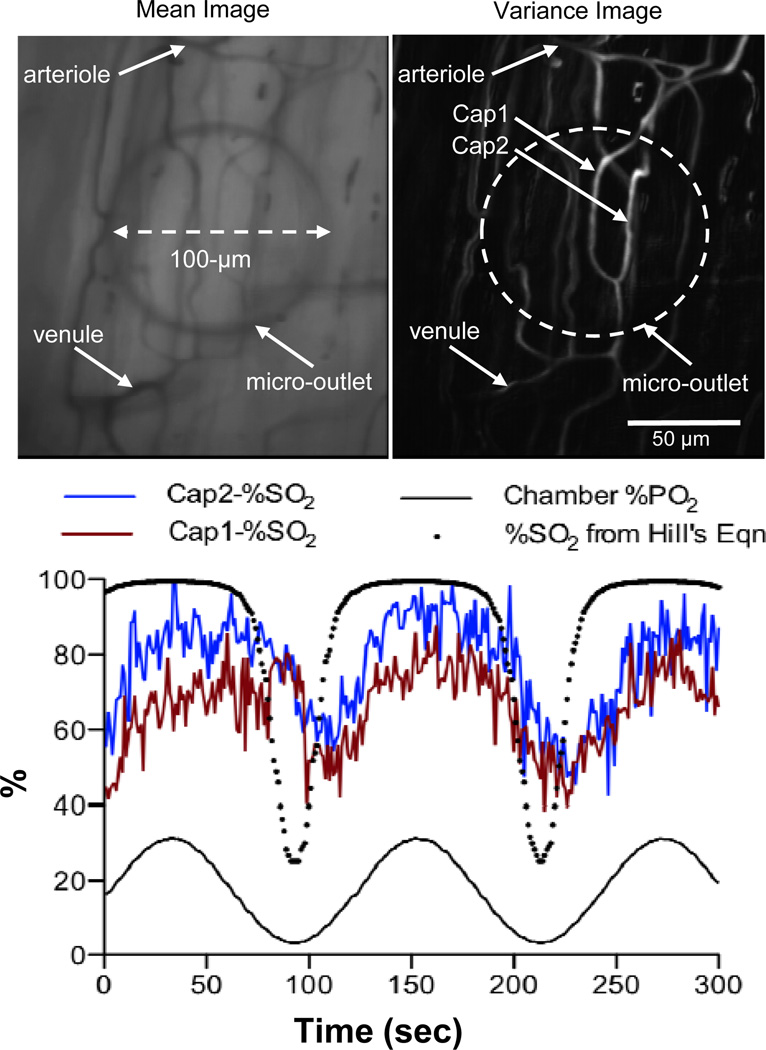
With the aid of an inverted microscope, selected capillaries, designated as Cap1 and Cap2, on the surface of the EDL muscle were positioned on top of an oxygen delivery micro-outlet (Figure 4). The edge of the micro-outlet could be clearly viewed when focussing away from the tissue at 20X objective (Figure 4). The PO2 level in the chamber was oscillated in a sine wave patteren (period 120 seconds) and a six minute video sequence was captured to examine red blood cell (RBC) saturation (SO2) changes within the selected capillaries. Analysis of the postprocessed video sequence shows a close association between the oscillated chamber PO2 levels and the RBC SO2 changes in both Cap1 and Cap2 with a lag time of approximately 10 seconds (Figure 4). The shape of the SO2 time series is flattened at high O2 saturations and steeper at low O2 saturations which is consistent with the sigmoidal shape of the hemoglobin O2 saturation curve [14]. This was further confirmed by comparing the measured RBC SO2 time series to the SO2 curve calculated using Hill’s equation and the measured chamber PO2 values (Figure 4) [14]. As expected, the range of SO2 values are greater in the calculated SO2 curve and the lag time is absent when compared to the measured SO2 data (Figure 4). Analysis of hemodynamic data indicated that the mean supply rate in Cap1 was higher (~13.2 ± 5.2 cells/sec, N=360) than in Cap2 (~4.3 ± 3.2 cells/sec, N=360).
Figure 4.
Muscle preparation with transparent micro-outlets positioned under the muscle. Edge of the micro-outlet is clearly visible in 20X Mean Image showing the outlet positioned under the capillary network between arteriole and venule. In focus capillaries for analysis are visible in the Variance Image of same field of view. Selected capillaries Cap1 and Cap2 were analyzed for red blood cell (RBC) oxygen saturation changes as oxygen levels delivered through the micro-outlet were oscillated in a sine wave (120 second period). Videos of the selected region were simultaneously recorded at two 431 nm and 420 nm using the dual video camera intravital microscopy system. The video sequences were digitized and postprocessed off-line using algorithms written in MATLAB (Mathworks, Natick, MA) to quantify changes in RBC saturation. The RBC saturation (SO2 %) profiles of both capillaries are closely associated with the local oxygen oscillations. The shape of the SO2 profiles for the selected capillaries also follows that of the SO2 curve calculated using the Hill’s equations and the measured chamber PO2 values. The difference in the measured baseline SO2 values between Cap 1 and Cap2 is likely due to the difference in their mean supply rates with Cap1 having higher supply rate (~13.2 ± 5.2 cells/sec, N=360) than Cap2 (~4.3 ± 3.2 cells/sec, N=360).
Square wave oscillations
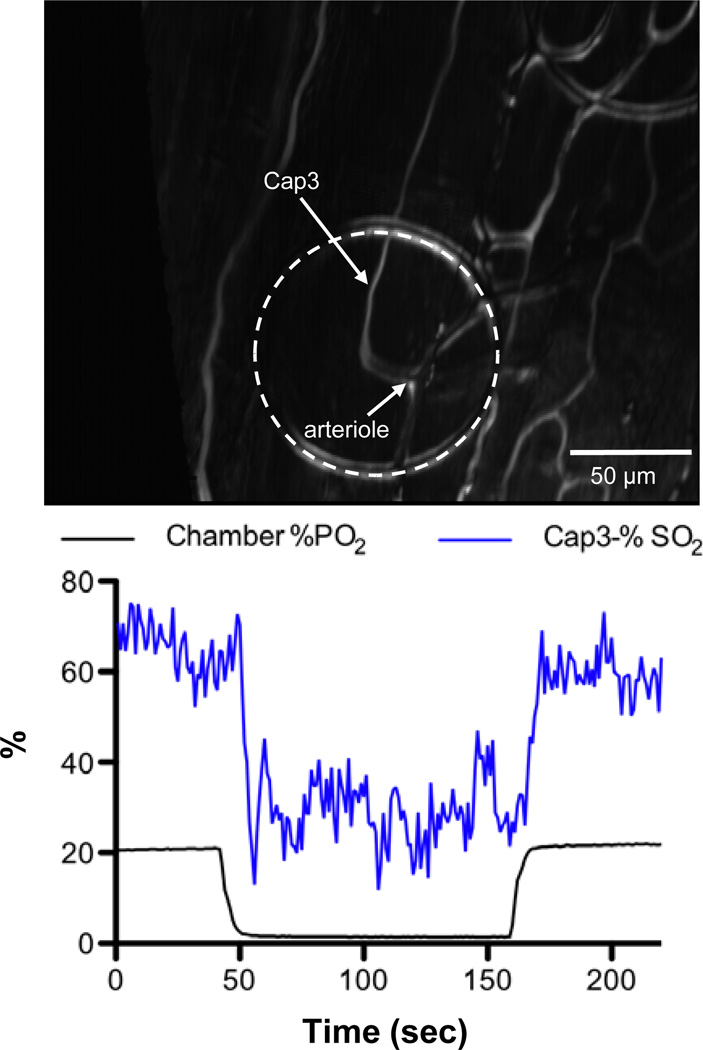
A selected capillary, designated as Cap3, on the surface of the EDL muscle was positioned on top of a micro-outlet (Figure 5). The PO2 level in the chamber was decreased from 22% (~167 mmHg) to 1.4% (~10.6 mmHg) for a 120 second hypoxic challenge and back to 22%. A video sequence was recorded over a six minute period beginning 2 minutes before the hypoxic challenge. The video was postprocessed for changes in capillary hemodynamic parameters and erythrocyte O2 saturation (SO2). Similar to our observations with induced sine oscillations of tissue PO2 levels (Figure 4), RBC SO2 changes were closely associated with the chamber PO2 level with a lag time of approximately 7 seconds (Figure 5). The mean supply rate for Cap3 was measured to be ~9.4±3.4 cells/sec, N=220.
Figure 5.
Selected capillary Cap3 was analyzed for RBC saturation changes as oxygen levels delivered through the micro-outlet were oscillated in a square wave. The PO2 level in the chamber was decreased from 22% (~167 mmHg) to 1.4% (~10.6 mmHg) for a 120 second hypoxic challenge and back to 22%. A six minute video sequence was captured beginning 2 minutes before the hypoxic challenge. The RBC SO2 profile is closely associated with the chamber PO2 level. The mean supply rate for Cap3 was measured to be ~9.4±3.4 cells/sec, N=220.
In vivo examination of radial diffusion
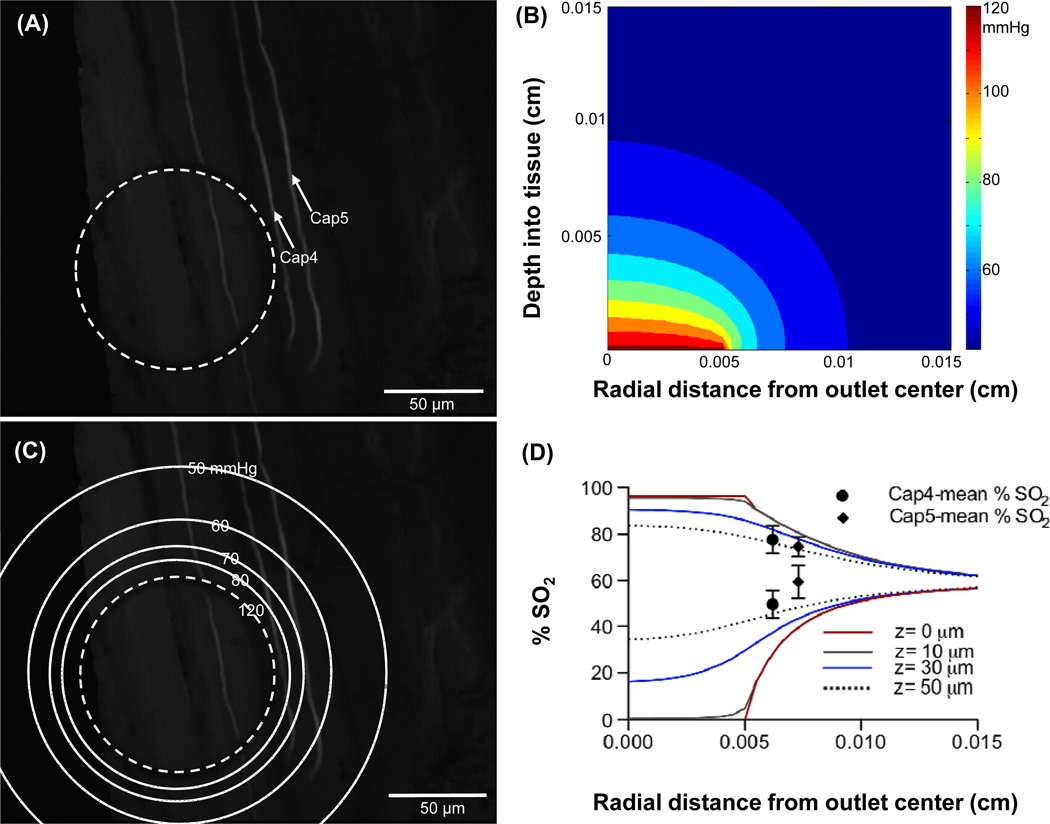
Following in vivo validation of oxygen delivery through the micro-outlets, the extent of radial diffusion from the center of the micro-outlet was examined in vivo. Selected capillaries, designated as Cap4 and Cap5, were positioned adjcent to a micro-outlet with the aid of the inverted microscope (Figure 6, panel A). The average distance of the selected capillaries from the center of the micro-outlet were calculated to be 62.2 μm and 73.2 μm, respectively. The PO2 level in the chamber was decreased from 16.2% (~123 mmHg) to 0.2% (~1.5 mmHg) for a 120 second hypoxic challenge and back to 16.2%. A video sequence was recorded over a six minute period beginning 2 minutes before the hypoxic challenge. The video was postprocessed for changes in hemodynamic parameters and capillary erythrocyte O2 saturation (SO2). The mean SO2 was calculated over a 40 second period prior to inducing local hypoxia (50–90 seconds) and over a 40 second period during the hypoxic challenge (160–200 seconds) for both Cap4 and Cap5. The difference in the means was calculated to be 28.0% for Cap4 and 15.1% for Cap5. The tissue PO2 distribution profile was modelled (Figure 6, panel B) and the surface (depth=0 cm) PO2 contour lines were superimposed on top of the image showing the micro-outlet and the selected capillaries (Figure 6, panel C). The RBC O2 saturation at various depths into the tissue (z=0 μm, 10 μm, 30 μm, and 50 μm) were calculated from the PO2 values predicted by the model using Hill’s equation [14]. The calculated SO2 values were then plotted against the radial distance from the center of the micro-outlet (Figure 6, panel D). The saturation plots calculated based on the PO2 distribution model into the tissue at baseline (SO2 decreasing with radial position) or during hypoxia (SO2 increasing with radial position) all converge to a value of 60% which corresponds to the tissue PO2 level set in the model (~42 mmHg). Experimentally measured SO2 mean values for Cap4 and Cap5 at baseline and during hypoxia were plotted and compared with the predicted SO2 against the capillaries’ measured distance from the center of the micro-outlet (Figure 6, panel D). The maximum mean SO2 values for both Cap 4 and Cap5 fall between the model predicted SO2 plots for 30 μm and 50 μm depth into the tissue. However, the minimum mean SO2 values for both Cap 4 and Cap5 lay above the SO2 values predicted for 50 μm depth into the tissue.
Figure 6.
Selected capillaries Cap4 and Cap5 shown in panel A were analyzed for RBC saturation changes as oxygen levels delivered through the micro-outlet were oscillated in a square wave. The PO2 level in the chamber was decreased from 16.2% (~123 mmHg) to 0.2% (~1.5 mmHg) for a 120 second hypoxic challenge and back to 16.2%. A six minute video sequence was captured beginning 2 minutes before the hypoxic challenge. The PO2 distribution profile into the tissue was modelled. Panel B shows 2D contour plot for a micro-outlet PO2 value of 123 mmHg. Panel C shows the surface (depth=0 cm) PO2 contour lines superimposed on top of the image showing the micro-outlet and the selected capillaries. The radial change in RBC O2 saturations at various depths into the tissue (z=0 μm, 10 μm, 30 μm, and 50 μm) were calculated from the modelled PO2 values using Hill’s equation then plotted against the radial distance from the center of the micro-outlet for a micro-outlet PO2 values of 123 mmHg (upper set of lines, panel D) and 1.5 mmHg (lower set of lines, panel D). Experimentally calculated SO2 mean values for Cap4 and Cap5 prior to and during hypoxia were plotted vs. capillary location (upper and lower pair of symbols respectively, panel D).
Discussion
The aim of this study was to develop a micro-delivery approach for investigating localized microvascular signalling and response in live tissue to varying PO2 levels. This was accomplished by designing oxygen delivery micro-outlets in ultrathin glass using microfabrication techniques. The proposed dimensions of the patterned micro-outlets were estimated by mathematically modelling the PO2 distribution profile for micro-outlets of varying sizes in live tissue using a numerical simulation code written in MATLAB (Figure 2) (Mathworks, Natick, MA). Oxygen delivered to the microcirculation alters the saturation levels of RBCs but is also partly consumed by the surrounding metabolic tissue. The microcirculation system constantly fine tunes the local hemodynamic and geometrical properties in response to changes in the RBC saturation levels [5,9]. This is the mechanism by which the microvasculature matches oxygen supply into the tissue with the metabolic demand. Just like any stimulus-response mechanism, the system is sensitive to a specific threshold of applied stimulus. Hence, an optimal outlet diameter should deliver enough oxygen into the tissue to stimulate a microvascular response. Yet, this should not compromise the accurate localization of the stimulus. In other words, radial diffusion away from the center of the micro-outlet must be limited to create enough contrast between the area stimulated and nearby regions of the microvascular bed. Also, when choosing the dimensions of the oxygen delivery micro-outlet, the microvascular geometry, specifically the dimensions of a single microvascular unit must be considered. The size of a microvascular unit within the rat skeletal muscle is approximately 150 μm × 400 μm. To better understand the microvascular response mechanism, the size of the micro-outlet must allow us to examine specific locations within a single microvascular unit. For instance, it would be insightful to investigate the effects of inducing local hypoxia at the venular end as opposed to the arteriolar end, or to examine the effects of stimulating a single or multiple capillaries. Hence, a proposed micro-outlet diameter of ~100 μm was selected based on the computational model and the above considerations. Note that the computational model assumes a continuous distribution of capillaries throughout the tissue region of interest. Since this is an approximation whose accuracy will depend on local properties (e.g., capillary spacing and whether or not the micro-outlet directly overlays surface capillaries), the predictions of the model need to be validated by experimental observations.
The oxygen permeable fluorosilicone acrylate membrane in the original IVVM setup was replaced by the ultrathin glass substrate patterned with the oxygen delivery micro-outlets (Figure 1). Oxygen levels transported through the outlets could be oscillated using computer controlled flow meters connected to the gas exchange chamber. Therefore, it was essential to validate the relationship between the chamber PO2 oscillations and those delivered through the micro-outlets. This was done in vivo by testing the response to oxygen delivery through the micro-outlets to interfaced live tissue (rat EDL muscle) using IVVM. The RBC saturation levels altered in response to oscillating the tissue PO2 levels using the micro-outlets for oxygen delivery. The RBC SO2 changes were closely associated with the oscillated chamber PO2 levels during both sine wave and square wave oscillations, however, with a certain time lag in both cases (Figure 4 and Figure 5). It is critical to note the absence of such a response delay between sensed and chamber PO2 levels when testing for oxygen delivery through the micro-outlets in vitro (data not shown). Hence, the time lag observed between the measured RBC saturations (essentially sensed PO2) and the chamber PO2 oscillations in vivo cannot be attributed to a systematic error. Rather, the delay in tissue response is probably due to oxygen diffusion through the tissue to the RBCs.
For the sine wave oscillation data, similar to the measured RBC SO2 profile, the saturation curve estimated from the measured chamber PO2 data using Hill’s equation [14] shows a rapid change at lower PO2 levels and plateaus as the PO2 reaches peak levels (Figure 4). This typical relationship between PO2 and RBC saturation is due to the cooperative binding of hemoglobin to oxygen [14]. The difference observed between the estimated and measured SO2 minima indicates that the RBCs in the selected capillaries were experiencing a narrower range of PO2 oscillations than what was measured in the chamber. The decrease in the amplitude of PO2 oscillations experienced by the selected capillaries is proportional to the depth within the tissue [12]. The lower saturation values at the peak of the oscillation measured for Cap1 relative to Cap2 can be attributed to the relatively higher mean supply rate for Cap1. The higher the supply rate, the less time the RBCs have to pick up oxygen as they flow across the micro-outlet, which results in lower mean SO2 values.
Following validation of oxygen delivery through the micro-outlets against controlled chamber PO2 oscillations, the degree of radial oxygen diffusion from the center of the micro-outlet was estimated in vivo. This was done by measuring the RBC O2 saturation in selected capillaries (Cap4 and Cap5, Figure 6, panel A) at measured distances from the edge of the micro-outlet and comparing the results to the model calculations. Figure 6 (panel D) shows the model’s predicted steady state oxygen saturations for the same high and low micro-oultlet PO2 levels used during the in vivo measurements. The model shows that the magnitude of the SO2 perturbation decreases rapidly with radial distance from the edge of the outlet and with depth into the tissue. The diminished effect of the outlet is reflected in the measured SO2 values for the two capillaries. Although the precise depth of the capillaries were not measured in vivo, the approximate depth of 40–50 μm suggested by comparing the measured values to the simulation for 123 mmHg PO2 in the outlet is close to the expected depth. The paired measurements with 1.5 mmHg in the micro-outlet are higher than predicted by the model for this depth into the tissue but the result is not unexpected. With high PO2 in the tissue the RBC SO2 under steady state conditions should equilibrate with the surrounding tissue, i.e. the simulation and experiment should match. With low PO2 in the tissue the RBCs should be offloading O2 to the tissue and hence the RBC SO2 should correspond to a higher PO2 than the PO2 in surrounding tissue. These results highlight that the impact of changing O2 levels in the micro-outlet are limited to the immediate vicinity of the outlet thus meeting our objective of designing a device to investigate local regulation of O2 supply in vivo.
The in vivo data presented verify that the 100 μm diameter micro-outlets were indeed able to alter O2 saturation levels of RBCs in capillaries flowing either directly over or even in close proximity to the outlet. Experimentally measured RBC O2 saturation levels fit with our computational model of the PO2 distribution into the tissue from an interfaced oxygen delivery micro-outlet. These results delineate an important step towards designing a novel microfluidic device for oxygen delivery to microvascular networks to further investigate regulation of O2 supply in vivo. This device would also allow us to examine the physiological level of O2 supply set by the microvasculature in the same tissue preparation by recording images at un-stimulated regions distal from the micro-outlets; a goal not feasible with current techniques.
Acknowledgements
N. Ghonaim was supported with an Alexander Graham Bell Canada Graduate Scholarship from the Natural Sciences and Engineering Research Council of Canada and a Western Graduate Research Scholarship from the University of Western Ontario. This research was funded by National Heart, Lung, and Blood Institute Grants R33 HL-089125 (C.G. Ellis and D. Goldman) and by Natural Sciences and Engineering Research Council of Canada Grant to J. Yang.
The authors also thank the members of Dr. Yang’s laboratory, Dr. Ellis’ laboratory (especially Stephanie Milkovich), Surface Science Western, and the Nanofabrication Laboratory at the University of Western Ontario for the training and support.
References
- 1.Comyn J. Polymer Permeability. New York: Chapman and Hall Inc.; 1985. pp. 21–23. [Google Scholar]
- 2.Dewhirst MW, Klitzman B, Braun RD, Brizel DM, Haroon ZA, Secomb TW. Review of methods to study oxygen transport at the microcirculatory level. Int J Cancer. 2000;90:237–255. [PubMed] [Google Scholar]
- 3.Duling BR. Oxygen sensitivity of vascular smooth muscle. II. In vivo studies. Am J Physiol. 1974;227:42–49. doi: 10.1152/ajplegacy.1974.227.1.42. [DOI] [PubMed] [Google Scholar]
- 4.Ellis CG, Goldman D, Hanson M, Stephenson AH, Milkovich S, Benlamri A, Ellsworth ML, Sprague RS. Defects in oxygen supply to skeletal muscle of prediabetic ZDF rats. Am J Physiol Heart Circ Physiol. 2010;298:1661–1670. doi: 10.1152/ajpheart.01239.2009. [DOI] [PMC free article] [PubMed] [Google Scholar]
- 5.Ellis CG, Jagger J, Sharpe M. The microcirculation as a functional system. Critical Care. 2005;9:S3–S8. doi: 10.1186/cc3751. [DOI] [PMC free article] [PubMed] [Google Scholar]
- 6.Ellis CG, Bateman RM, Sharpe MD, Sibbald WJ, Gill R. Effect of a maldistribution of microvascular blood flow on capillary O2 extraction in sepsis. Am J Physiol Heart Circ Physiol. 2002;282:156–164. doi: 10.1152/ajpheart.2002.282.1.H156. [DOI] [PubMed] [Google Scholar]
- 7.Ellis CG, Ellsworth ML, Pittman RN, Burgess WL. Application of image analysis for evaluation of red blood cell dynamics in capillaries. Microvasc Res. 1992;44:214–225. doi: 10.1016/0026-2862(92)90081-y. [DOI] [PubMed] [Google Scholar]
- 8.Ellis CG, Ellsworth ML, Pittman RN. Determination of red blood cell oxygenation in vivo by dual video densitometric image analysis. Am J Physiol Heart Circ Physiol. 1990;258:H1216–H1223. doi: 10.1152/ajpheart.1990.258.4.H1216. [DOI] [PubMed] [Google Scholar]
- 9.Ellsworth ML, Ellis CG, Goldman D, Stephenson AH, Dietrich HH, Sprague RS. Erythrocytes: Oxygen Sensors and Modulators of Vascular Tone. Physiology. 2009;24:107–116. doi: 10.1152/physiol.00038.2008. [DOI] [PMC free article] [PubMed] [Google Scholar]
- 10.Ellsworth ML, Forrester T, Ellis CG, Dietrich HH. The erythrocyte as a regulator of vascular tone. Am J Physiol. 1995;269:H2155–H2161. doi: 10.1152/ajpheart.1995.269.6.H2155. [DOI] [PubMed] [Google Scholar]
- 11.Ellsworth ML, Pittman RN, Ellis CG. Measurement of hemoglobin oxygen saturation in capillaries. Am J Physiol. 1987;252:H1031–H1040. doi: 10.1152/ajpheart.1987.252.5.H1031. [DOI] [PubMed] [Google Scholar]
- 12.Goldman D. A Mathematical Model of Oxygen Transport in Intact Muscle with Imposed Surface Oscillations. Math Biosci. 2008;213(1):18–28. doi: 10.1016/j.mbs.2008.01.010. [DOI] [PMC free article] [PubMed] [Google Scholar]
- 13.Hanson MS, Ellsworth ML, Achilleus D, Stephenson AH, Bowles EA, Sridharan M, Adderley S, Sprague RS. Insulin inhibits low oxygen induced ATP release from human erythrocytes: implication for vascular control. Microcirculation. 2009;16:424–433. doi: 10.1080/10739680902855218. [DOI] [PMC free article] [PubMed] [Google Scholar]
- 14.Hill AV. The possible effects of the aggregation of the molecules of hemoglobin on its dissociation curve. J Physiol (London) 1910;iv:41. [Google Scholar]
- 15.Ilie M, Foglietti V, Cianci E, Minotti A. Optimized deep wet etching of borosilicate glass through Cr-Au-resist mask. SPIE. 2003;5227:318–322. [Google Scholar]
- 16.Jackson WF, Duling BR. The oxygen sensitivity of hamster cheek pouch arterioles. In vitro and in situ studies. Circ Res. 1983;53:515–525. doi: 10.1161/01.res.53.4.515. [DOI] [PubMed] [Google Scholar]
- 17.Jagger JE, Bateman RM, Ellsworth ML, Ellis CG. Role of erythrocyte in regulating local O2 delivery mediated by haemoglobin oxygenation. Am J Physiol Heart Circ Physiol. 2001;280:H2833–H2839. doi: 10.1152/ajpheart.2001.280.6.H2833. [DOI] [PubMed] [Google Scholar]
- 18.Japee SA, Pittman RN, Ellis CG. A new video image analysis system to study red blood cell dynamics and oxygenation in capillary networks. Microcirculation. 2005;12:489–506. doi: 10.1080/10739680591003332. [DOI] [PubMed] [Google Scholar]
- 19.Japee SA, Ellis CG, Pittman RN. Flow visualization tools for image analysis of capillary networks. Microcirculation. 2004;11:39–54. doi: 10.1080/10739680490266171. [DOI] [PubMed] [Google Scholar]
- 20.Riemann M, Rai A, Ngo AT, Dziegiel MH, Holstein-Rathlou N-H, Torp-Pedersen C. Oxygen-dependant vasomotor responses are conducted upstream in the mouse cremaster microcirculation. J Vac Res. 2010;48:79–89. doi: 10.1159/000318777. [DOI] [PubMed] [Google Scholar]
- 21.Sprague RS, Stephenson AH, Bowles EA, Stumpf MS, Lonigro AJ. Reduced expression of Gi in erythrocytes of humans with Type 2 Diabetes is associated with impairment of both cAMP generation and ATP release. Diabetes. 2006;55:3588–3359. doi: 10.2337/db06-0555. [DOI] [PubMed] [Google Scholar]
- 22.Srivastava N, Davenport RD, Burns MA. Nanoliter viscometer for analyzing blood plasma and other liquid samples. Anal Chem. 2005;77:383–392. doi: 10.1021/ac0494681. [DOI] [PubMed] [Google Scholar]
- 23.Tyml K, Budreau CH. A new preparation of rat extensor digitorum longus muscle for intravital investigation of the microcirculation. Int J Microcirc Clin Exp. 1991;10:335–343. [PubMed] [Google Scholar]
- 24.Varghese HJ, MacKenzie LT, Groom AC, Ellis CG, Chambers AF, MacDonald IC. Mapping of the functional microcirculation in vital organs using contrast-enhanced in vivo video microscopy. Am J Physiol Heart Circ Physiol. 2005;288:185–193. doi: 10.1152/ajpheart.01022.2003. [DOI] [PubMed] [Google Scholar]


