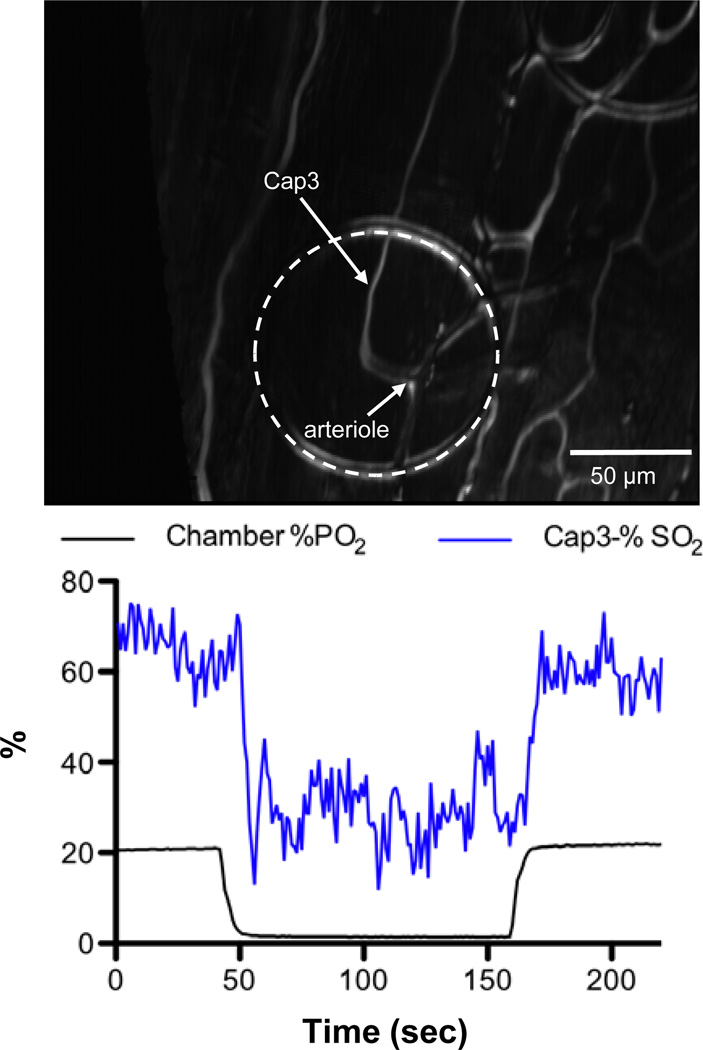
Figure 5.
Selected capillary Cap3 was analyzed for RBC saturation changes as oxygen levels delivered through the micro-outlet were oscillated in a square wave. The PO2 level in the chamber was decreased from 22% (~167 mmHg) to 1.4% (~10.6 mmHg) for a 120 second hypoxic challenge and back to 22%. A six minute video sequence was captured beginning 2 minutes before the hypoxic challenge. The RBC SO2 profile is closely associated with the chamber PO2 level. The mean supply rate for Cap3 was measured to be ~9.4±3.4 cells/sec, N=220.

