

Abstract
Class II major histocompatability molecules are the primary susceptibility locus for many autoimmune disorders including type 1 diabetes. Human DQ8 and I-Ag7, in the non-obese diabetic (NOD) mouse model of spontaneous autoimmune diabetes, confers diabetes risk by modulating presentation of specific islet peptides in the thymus and periphery. We utilized an in silico molecular docking program to screen a large “drug-like” chemical library to define small molecules capable of occupying specific structural pockets along the I-Ag7 binding groove with the objective of influencing presentation of the autoantigen insulin B:9–23 to T cells. In this study we demonstrate using both murine and human cells that small molecules can enhance or inhibit specific T cell receptor (TCR) signaling in the presence of cognate target peptides based upon the structural pocket targeted. The influence of compounds on the TCR response was pocket dependent with pocket 1 and 6 compounds inhibiting responses and molecules directed at pocket 9 enhancing response to peptide. At nanomolar concentrations, the inhibitory molecules block insulin B:9–23 peptide, endogenous insulin, and islet stimulated T cell responses. Glyphosine, a pocket 9 compound, enhances insulin peptide presentation to T cells at concentrations as low as 10 nM, upregulates IL-10 secretion, and prevents diabetes in NOD mice. These studies present a novel method for identifying small molecules capable of both stimulating and inhibiting T cell responses with potentially therapeutic applications.
Introduction
The incidence of type 1 diabetes, the immune mediated form of diabetes, has doubled in each of the last 2 decades (1). A large number of immune therapies are being studied to stop or slow the autoimmune destruction of insulin producing beta cells, although none has yet emerged as clinically beneficial. Biostructural data for the related “diabetogenic” alleles, HLA-DQ8 in humans and I-Ag7 in non-obese diabetic (NOD) mouse, are now available allowing structure guided studies of antigen presentation to T cells (2). Distinct structural pockets (p1, p4, p6, and p9) that accommodate peptide side chains exist along the peptide binding groove of these class II major histocompatability complex (MHC) molecules (3,4). An insulin B chain peptide, consisting of amino acids 9–23 (B:9–23), is a primary autoantigenic target in the NOD mouse (5,6), as mice with mutated insulin, B:9–23 (B:16Y to B:16A), do not develop diabetes. The autoantigen, insulin B:9–23, is presented to CD4+ T cells by the NOD MHC class II molecule I-Ag7 with the peptide reported to be bound in a low affinity register (7). CD4+ T cells with a conserved germline encoded TCR Vα sequence (TRAV5D-4) predominate in the recognition of the insulin B:9–23/I-Ag7 complex (8,9). This same peptide can also be presented by the DQ8 allele to human T cell receptors.
Determination of the structural basis for autoantigen recognition in the context of I-Ag7 and DQ8 are key advances in the complex etiology of autoimmune diabetes, but the question remains how to best modulate T cell receptor (TCR) interactions to prevent or delay disease (10,11). In this study, we pursued a rapid and economical small molecule drug discovery strategy to modify T cell responses to the autoantigenic B:9–23 peptide. Utilizing available crystal structures for the anti-insulin trimolecular complex (MHC-peptide-TCR) in the NOD mouse (3, 11), we used an in silico molecular docking algorithm to identify small molecules (molecular weight less than 500) capable of occupying the pockets along the I-Ag7 binding groove. We assessed the stimulatory and inhibitory properties of the top scoring small molecules on T cell responses of both murine and human cells.
Material and Methods
Molecular modeling and docking
We utilized crystal structures of I-Ag7 complexed to the GAD65 peptide, PDB code 1ES0, and HLA-DQ8 complexed to insulin B:9–23, PDB code 1JK8, as the basis for molecular docking (12). An atomic model of I-Ag7 complexed to insulin B:9–23 was generated by superimposing the antigen binding cleft of HLA-DQ8 on I-Ag7 and applying the same rotation and translation to coordinates for the B:9–23 peptide. To prepare the site for docking, all water molecules were removed and protonation of I-Ag7 residues was done with SYBYL (Tripos) (13). The molecular surface of the structure was explored using sets of spheres to describe potential binding pockets. The sites selected for molecular docking were defined using the SPHGEN program (generates a grid of points that reflect the shape of the selected site) and filtered through CLUSTER. The CLUSTER program groups the selected spheres to define the points that are used by DOCK v5.1.0 (14) to match potential ligand atoms with spheres. Intermolecular AMBER energy scoring (van der Waals + columbic), contact scoring, and bump filtering were implemented in the DOCK program algorithm. Atomic coordinates for approximately 140,000 small molecules in the National Cancer Institute Developmental Therapeutics Program (NCI/DTP repository) were positioned in the selected structural pocket in 1000 different orientations and scored based on predicted polar (H-bond) and nonpolar (van der Waals) interactions. The best orientation and scores (contact and electrostatic) were calculated. PYMOL was used to generate molecular graphic images.
Generation of insulin B:9–23 specific T cell hybridomas
Creation of BDC 12-4.1 and BDC 12-4.4 T cell hybridomas were previously reported (9). The BDC 8-1.1 alpha1 cell line was produced from splenocytes of a retrogenic mouse with a single 8-1.1 TCR following the same procedure. The 4–8 TCR sequence came from the pancreatic islets of an alpha chain only retrogenic mouse (using the alpha chain of BDC 12-4.1).
T cell receptor stimulation LacZ assay
Antigen-specific hybridoma stimulation was estimated by measuring LacZ activity. Small molecules for screening were dissolved in DMSO and diluted in PBS for a final concentration of 0.1% DMSO in each well. Each small molecule was screened at a concentration of 100 µM. After small molecule screening, glyphosine and derivatives were purchased from Sigma-Aldrich and dissolved in PBS with the pH adjusted to 7.4 for use in the stimulation and Elispot assays. Peptides (Genemed Synthesis Inc.) for stimulation were HPLC purified (>95%) and dissolved in sterile lipopolysaccharide free PBS at a neutral pH. Insulin B:9–23 (SHLVEALYLVCGERG) peptide was used at a concentration of 100 µg/ml and the BDC 2.5 mimotope (EKAHRPIWARMDAKK) at 20 µg/ml. Anti-I-Ag7 monoclonal antibodies (BD Biosciences, catalog no. 554926) were used at a concentration of 10 µg/ml.
Generation of hybridomas expressing a TCR
The 4–8 and human TCR constructs, α and β chains linked by the PTV1.2A sequence, were cloned into MSCV-based retroviral vectors carrying green fluorescent protein (GFP) (pMIGII) (15). Phoenix cells were co-transfected with the pMIGII plasmids and with the pCL-Eco packaging vector using Lipofectamine 2000 (Invitrogen) to produce replication-incompetent retroviruses encoding TCR sequences. The 5KCα-β- hybridoma line lacking TCR α and β chains was used to reconstitute TCRs (16). The transduced 5KC hybridomas were sorted by GFP expression and TCR expression was confirmed by staining with anti-mouse TCRβ antibody (clone H57–597, BD Biosciences).
IL-2 ELISA
TCR-expressing 5KC hybridomas (2 × 10⁵ cells) were incubated in the presence or absence of 200 µg/ml of antigens (insulin B:9–23 or tetanus toxin) along with spleen cells from NOD mice (2 × 10⁵ cells per well) or DQ8 humanized mice overnight. IL-2 secretion in supernatants was measured by an ELISA assay according to manufacturer's instructions (R&D Systems). Stimulation of the DO11.10 5KC hybridoma was performed in a similar fashion with 105 cells in the presence of 1mg/ml of chicken ovalbumin (Sigma A5503) and 2 × 10⁵ Balb/c splenocytes.
Binding Analysis
Binding assays performed as previously described exempt using a biotin-streptavidin-europium detection method (3). 1.0 µg of purified I-Ag7/B:12–23 protein complex was incubated with 0.1 units of thrombin (Novagen) to cleave the peptide and linker and 10 uM biotinylated peptides (B:9–23, HEL11–25, and Eα52–68 from Genemed Synthesis Inc.) in binding buffer (20 mM HEPES and 150 mM NaCl, pH 7.4) to a total volume of 30 µl overnight at room temperature. Biotinylated peptide-I-Ag7 complexes were purified from free peptide using gel filtration Bio-Spin columns (Bio-Rad). A 96-well high binding plate was coated with 10 µg/ml of an I-Ag7 monoclonal antibody (BD 554926) in 100 mM Na2CO3, pH 9.6 overnight at 4°C. Plates were washed with PBST and PBS, then samples transferred to the antibody coated plate an incubated for 4h at room temperature. Plates were developed with streptavidin-europium and read on a fluorimeter.
Murine Enzyme-Linked Immunospot Assay
IL-10 and IFN-γ Elispot (enzyme-linked immunosorbent spot analysis) kits (BD Biosciences) were used for splenocyte analysis. Glyphosine was used at a final concentration of 500 nM for the in vitro culture with splenocytes (7×10⁵ cells per well) and peptide (100 µg/ml). Plates were developed using the AEC substrate system (BD Biosciences), and spots were enumerated using the ImmunoSpot® reader and software version 3.1 (Cellular Technology Ltd.).
Animals
Mice were bred and housed under specific pathogen-free conditions at the University of Colorado Denver Center for Comparative Medicine (CCM) with an approved protocol from the University of Colorado Denver Animal Care and Use Committee. Spleens for T cell receptor stimulation LacZ assays and Elispot assays were obtained from the Barbara Davis Center derived NOD mouse colony. DQ8 splenocytes were obtained from DQ8/human CD4/I-Ag7null/Rag KO NOD mice from Jackson Laboratories. Balb/c, C57BL/6, and C57BL/6 congenic for I-Ag7 mice were also obtained from the Jackson Laboratory for Elispot assays, as were NOD mice for the diabetes prevention study.
Assessment of Diabetes
Glucose was measured weekly with the Reli On blood glucose monitoring system (Solartek), and the mice were considered diabetic after two consecutive blood glucose values of more than 250 mg/dl.
Glyphosine administration
Glyphosine was purchased from Sigma-Aldrich (catalog no. 15149), dissolved in PBS, and injected into the peritoneal cavity. A dose of 80 mg/kg/day was administered in a final volume of 200 µl on 5 consecutive days. Control mice received 200µl PBS.
HLA genotyping
Informed consent was obtained after the nature and possible consequences were explained to individuals providing serum samples for HLA genotyping and cytokine Elispot assay with an approved protocol from the Colorado Institutional Review Board. DRB1 and DQB1 genotyping was performed on patient samples using linear arrays of immobilized sequence-specific oligonucleotides similar to previously described methodology (17).
Human Indirect Enzyme-Linked Immunospot Assay
Indirect Elispot analyses were conducted as previously described (18) using the human INF-γ and IL-10 Elispot kits (U-CyTech Biosciences, Utrecht, The Netherlands). Briefly, freshly isolated PBMCs (1×10⁶) were cultured in 250 µl RPMI containing 10% heat inactivated human AB serum (PAA Laboratories Inc., Dartmouth, MA) and 10 µM of peptide. The cells were fed with an additional 250 µl of medium after 24 h, and harvested 24 h later. After washing, the cells were resuspended in 300 µl medium and transferred as three 100 µl aliquots to 96-well clear polystyrene culture plates coated with the appropriate cytokine capture monoclonal antibody and subsequently treated with 1 × blocking solution (UCyTech). Seventeen hours later, the cells were removed by decanting, and the wells washed (2 × PBS, and 5 × PBS containing 0.05% Tween-20). Spots were then formed by sequential incubations with the biotinylated 2nd site anti-IFN-γ or anti-IL-10, gold-labeled goat anti-biotin, and a precipitating silver substrate. Spots were enumerated with a Bioreader 4000 Pro X (BIOSYS GmbH, Karben, Germany). No antigen wells contained DMSO, as peptides are dissolved in DMSO for the assays. Positive control samples from incubations with tetanus toxin were included in each assay.
Statistical Analysis
IL-2 concentrations for T cell stimulation assays, europium counts for protein binding, stimulation indices for glyphosine, and mean spot numbers from Elispot assays were analyzed with an unpaired Student’s t-test. Survival curves for the diabetes prevention study were analyzed with the log rank test. Wilcoxon matched pairs test compared means between groups in the human cytokine Elispot assays. Linear regression analysis was done to compare IL-10 Elispots with B:9–23 +/− glyphosine for type 1 diabetic individuals and controls. Statistical tests used GraphPad Prism 4.0 software.
Results
Molecular docking and virtual screening of a small molecule library
To identify candidate molecules predicted to bind specific structural pockets of the I-Ag7 antigen binding groove, we utilized a supercomputer to screen approximately 140,000 small molecules from the NCI/DTP repository of “drug-like” compounds. Existing crystal structures available for modeling include I-Ag7 with a bound GAD65 peptide (19) as well as B:9–23 bound to DQ8 (20). To model the binding of B:9–23 to I-Ag7, we superimposed the antigen binding clefts of DQ8 and I-Ag7, determined sites of critical contacts between peptide and MHC, and displayed the atomic coordinates of B:9–23 peptide from the solved crystal structure with coordinates of I-Ag7 for the solved crystal structure. The identified orientation and conformation of the insulin B:9–23 peptide was complementary with the antigen binding cleft for the crystal structure of I-Ag7 (supplementary Fig. S1). All NCI organic compounds were docked in 1000 orientations using the DOCK program algorithm (14) and scored based on the sum of attractive and repulsive polar and non-polar interactions to compute free energy (ΔG) on binding. Supplementary table 1 lists the top 40 scoring compounds for each pocket along with the corresponding NCI identifier.
In vitro screening of lead candidate small molecules
The top 40 scoring compounds for each pocket were screened for their ability to alter anti-B:9–23 T cell responses for different T cell hybridomas (BDC 8-1.1α1, BDC 12-4.1, and BDC 12-4.4) (supplementary Fig. S2). The in vitro T cell stimulation assays utilized hybridomas engineered to produce β-galactosidase following TCR antigen activation (nuclear factor of activated T cell (NFAT) promoter) (21). Upon stimulation, LacZ production correlates with IL-2 production. From the top scoring 40 compounds predicted to occupy each p1 and p6, a subset resulted in inhibition of B:9–23 TCR activation; 2/40 for p1 and 3/40 for p6 (Fig. 1A). In contrast, multiple compounds predicted to bind p9 (20/40) resulted in an enhancement of hybridoma responsiveness (p<0.001 p9 compounds vs. pocket 1 and 6 using a rank sum test). Pocket 4 small molecules did not dramatically alter T cell responses to the B:9–23 peptide.
Fig. 1.
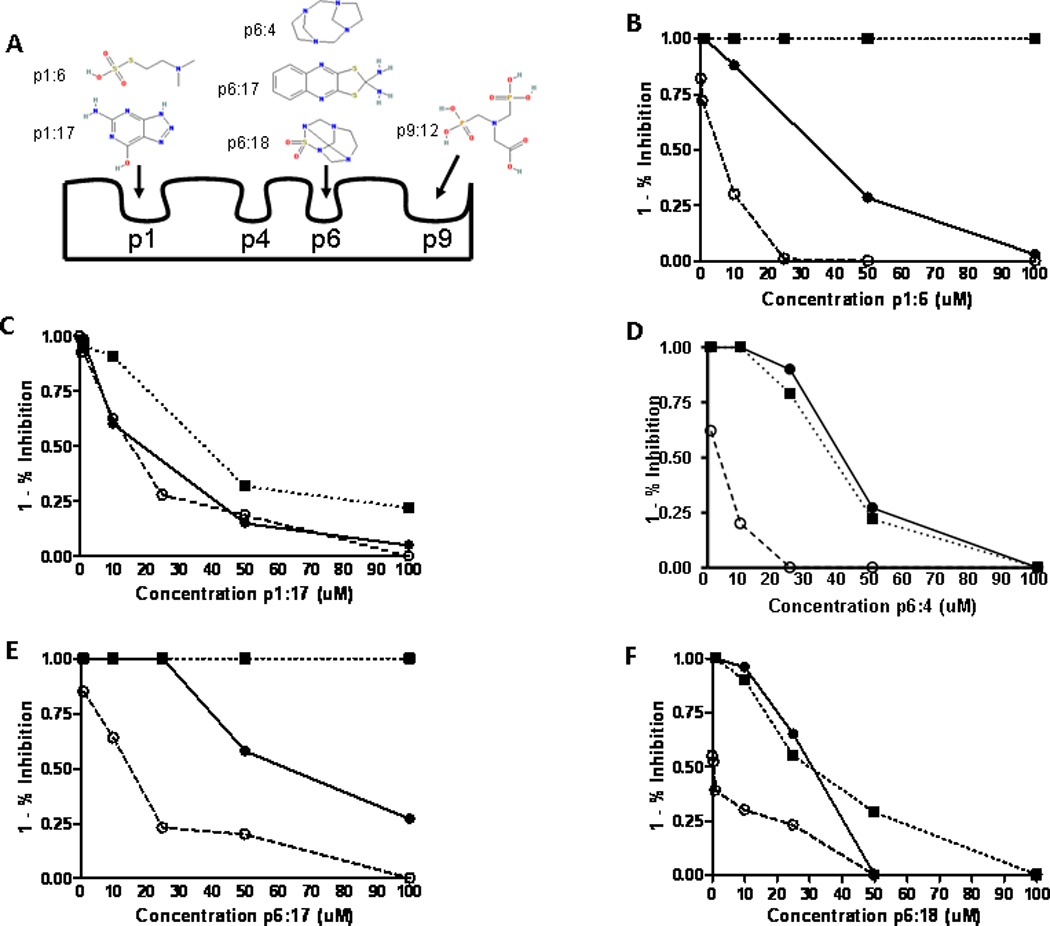
Small molecule inhibitors used in B:9–23 activation of T cells. (A) Diagram of the structural pockets along the I-Ag7 binding groove with the proposed binding sites for the compound structures based upon in silico molecular modeling. (B–F) Inhibition curves of compounds that block T cell responses to the B:9–23 peptide. Three TCRs are depicted; ● 8-1.1α1 and ○ BDC 12-4.1 recognize insulin B:9–23 peptide while ■ BDC 2.5 responds to a chromogranin mimotope. Percentage of inhibition was calculated from the stimulation of peptide alone for each TCR. Data points represent triplicate wells for each concentration of small molecule with peptide. Inhibition curves are representative of at least 3 independent experiments.
Small molecules inhibit insulin presentation
Five compounds (Fig. 1A and supplementary table S2) inhibited the response of multiple anti-B:9–23 TCRs to varying degrees, with IC50 values in the low micromolar range. The inhibition curves for the compounds from stimulation assays in the presence of B:9–23 peptide are shown in Fig. 1B–F. Next, we tested the ability of the small molecules to block endogenous insulin presentation. Incubation of whole insulin with I-Ag7 containing splenocytes activates 5KC cells (T cell hybridoma lacking endogenous TCRα and β chains) transduced with a 4–8 TCR. The small molecules examined were able to block T cell stimulation from endogenously processed insulin, with the small molecules p1:17 (pocket 1: compound 17), p6:4, and p6:18 having IC50 values in low nanomolar concentrations (Fig. 2, A and B). The p6:4 molecule, tetraazatricyclododecane, was studied in additional detail due to lower IC50 values and was able to inhibit TCR response to isolated whole islets from an adult non-diabetic NOD mouse (Fig. 2C), which have been shown to contain dendritic cells with insulin peptides notably B:9–23 (22). To document direct effects of these small molecules on inhibiting peptide binding to I-Ag7, we expressed an I-Ag7 protein construct in baculovirus with a linked peptide (23). The flexible linker contained a thrombin cleavage site, allowing for thrombin cleavage of the linker and release of the peptide. Performing a soluble binding assay, the p6:4 molecule was able to inhibit B:9–23 peptide binding to the empty I-Ag7 in a dose dependent manner (Fig. 2D). We further investigated the binding inhibition with higher affinity antigens for I-Ag7, HEL11–25 and Eα52–68. We found p6:4 was able to inhibit binding of these biotinylated peptides to a similar degree as the B:9–23 peptide (data not shown).
Fig. 2.
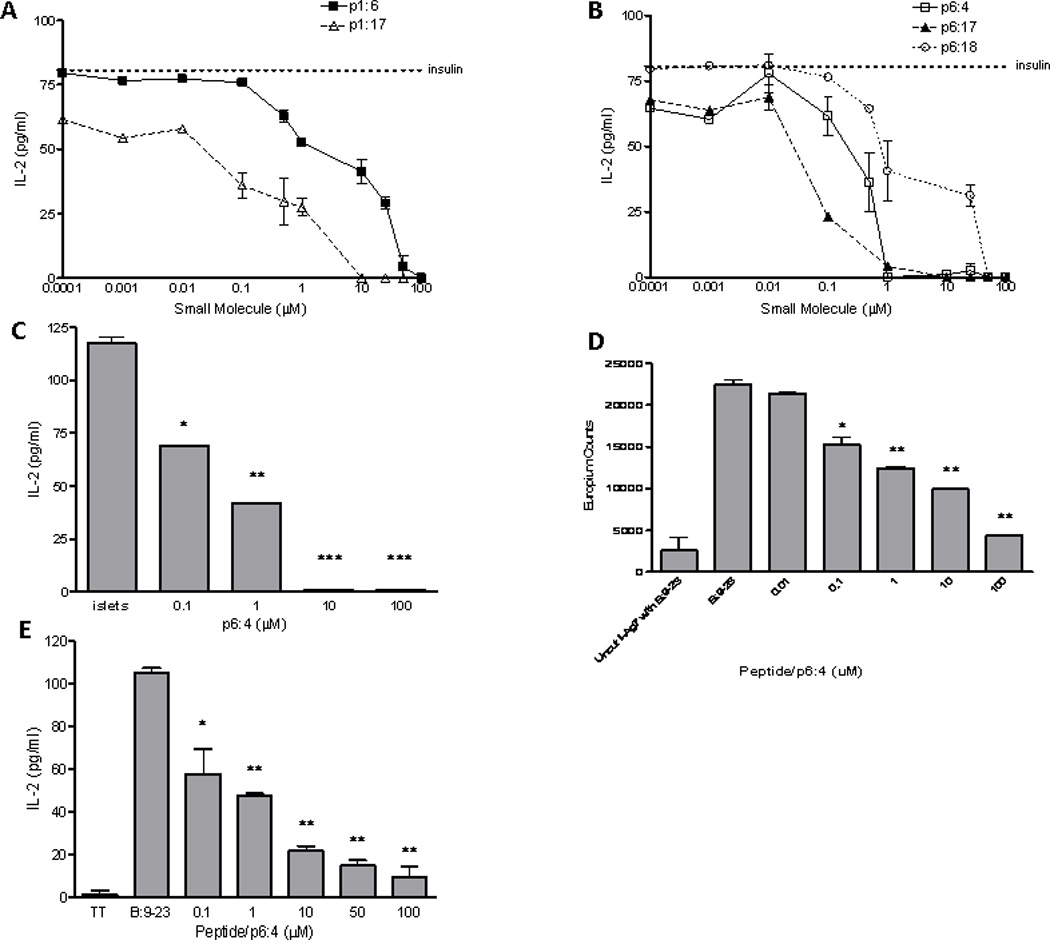
Small molecule inhibitors block presentation of endogenously processed insulin by NOD splenocytes. (A) Inhibition curves for p1 molecules and (B) p6 molecules. Dotted line represents IL-2 production by the 4–8 TCR to insulin in the absence of a small molecule. (C) IL-2 production from a T cell hybridoma cultured with whole islets used as antigen presenting cells. p6:4 molecule inhibits IL-2 production when islets isolated from an adult NOD mouse without diabetes are used for antigen presentation to the 4–8 TCR. *p=0.004, **p=0.002, ***p<0.001 (D) p6:4 inhibits B:9–23 peptide binding to I-Ag7, as determined using a soluble binding assay with purified I-Ag7 protein and biotinylated insulin B:9–23 peptide. Negative control is uncut I-Ag7 (thrombin was not used to cleave the flexible linker and linked peptide) with biotinylated B:9–23 peptide added to the assay. *p=0.023, **p<0.001. (E) p6:4 inhibits a human DQ8 restricted TCR to insulin B:9–23. TT = tetanus toxin (negative control peptide). *p=0.004, **p<0.001.
To test whether these inhibitory small molecules decrease TCR reactivity selectively to B:9–23 insulin peptides, we studied a chromogranin peptide mimotope presented by I-Ag7 to the BDC 2.5 T cell hybridoma (24). Two of the five compounds tested, p1:6 and p6:17, showed no inhibition of chromogranin presentation to the BDC 2.5 hybridoma (Fig. 1, B–F), while the other three compounds inhibited both B:9–23 and chromogranin presentation to their respective hybridomas. Other compounds predicted to bind pocket 1 and 6 blocked TCR responses, but not all of these molecules were specific for the B:9–23 peptide. Taken together, these data demonstrate that in vitro small molecules are able to inhibit endogenous insulin presentation, displace B:9–23 peptide binding to I-Ag7, and certain small molecules have specificity for inhibiting insulin presentation to T cells.
There is significant homology between the high risk class II allele DQ8 of humans (DQA1*0301-DQB1*0302) and I-Ag7 of mouse (25). Furthermore, the amino acid sequences of the murine insulin 2 B:9–23 is identical to human B:9–23. We performed in silico molecular docking using the compounds from the NCI/DTP repository for pockets along the binding groove of DQ8. Twenty out of the top 40 scoring compounds for both pocket 6 of I-Ag7 and DQ8 are identical, suggesting that small molecules targeted to I-Ag7 may similarly bind to DQ8 (for p1 0/40, p4 5/40, and p9 6/40 are identical). We evaluated the p6:4 molecule for the ability to block of B:9–23 peptide presentation by DQ8. Using a TCR sequence obtained from a T cell line generated from the peripheral blood of a diabetic individual with the DQ8 molecule, we identified a TCR that is DQ8 restricted and responds to the insulin B:9–23 peptide (26). Using this TCR along with DQ8 splenocytes from a humanized mouse, we show the p6:4 molecule inhibits TCR activation (Fig. 2E), suggesting that small molecules targeted to pocket 6 of I-Ag7 also bind in a similar manner to the human homologue DQ8.
Glyphosine, a pocket 9 compound, enhances T cell responses to insulin B:9–23
We hypothesized that small molecules binding to the I-Ag7 binding groove would inhibit antigen presentation and subsequent T cell stimulation; however compounds predicted to bind pocket 9 proved to be stimulatory. Twenty of the 40 top scoring compounds enhanced T cell stimulation of at least one of our three anti-B:9–23 hybridomas in the presence of insulin B:9–23 peptide. One compound, p9:12 (pocket 9: compound 12) glyphosine, enhanced TCR stimulation to B:9–23 when tested with all three of our anti-B:9–23 hybridomas, prompting further evaluation of this compound. To assess specificity of the hybridoma response to glyphosine, the same assays evaluating hybridoma response were performed using 40 “random” compounds from the NCI/DTP repository. Testing of these control compounds did not enhance stimulation above insulin B:9–23 peptide in any of the three hybridomas (p<0.001 for p9 compounds compared to control compounds using a rank sum test).
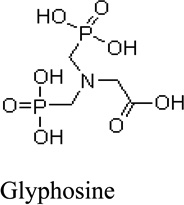
Glyphosine, depicted in Fig. 1A as p9:12, modulated TCR stimulation only when peptide was present (Fig. 3A). An effect was seen down to a 10 nM concentration along with an EC50 concentration of 70.6 nM. The maximal stimulatory effect was at a concentration of 500 nM, which produced an approximately 2.5 fold greater stimulation than peptide alone. The enhanced glyphosine response was completely blocked by a monoclonal antibody against I-Ag7 (Fig. 3B). To test whether glyphosine enhances TCR reactivity specifically to the B:9–23 peptide, we utilized the BDC 2.5 TCR hybridoma that recognizes a chromogranin peptide presented by I-Ag7. Glyphosine did not enhance peptide stimulation of this hybridoma (Fig. 3C). We also examined the specificity of glyphosine for I-Ag7 by using splenocytes from Balb/c mice, which express I-Ad, to stimulate the ovalbumin specific hybridoma DO11.10. I-Ad is structurally similar to I-Ag7 of the NOD, with both having identical I-A alpha chains but different beta chains (17 amino acid differences in the I-A beta chains) including β57Asp for I-Ad, which results in a structurally distinct pocket 9 compared to β57Ser in the NOD mouse. We found that glyphosine did not stimulate or inhibit the DO11.10 hybridoma (Fig. 3D).
Fig. 3.

Glyphosine specifically enhances the T cell response to insulin B:9–23 presented by I-Ag7. (A) Glyphosine enhanced stimulation of the T cell hybridoma 8-1.1α1 only when insulin B:9–23 peptide is present. Glyphosine concentrations are indicated and the reaction mixture contained B:9–23 peptide unless otherwise noted. The glyphosine concentration used in subsequent experiments was 500 nM. TT = tetanus toxin (negative control peptide). *p=0.011, **p=0.049 (unpaired Student’s t-test). (B) The glyphosine response in the presence of B:9–23 is blocked by a monoclonal antibody to I-Ag7 and unchanged with an isotype control antibody. *p<0.001. (C–D) Glyphosine does not alter TCR reactivity to a chromogranin peptide presented by I-Ag7 to the BDC 2.5 T cell hybridoma or to ovalbumin presented by I-Ad to the DO11.10 T cell hybridoma. Results are given as a stimulation index (SI) from triplicate cultures ± SEM. Data are representative of at least three independent experiments.
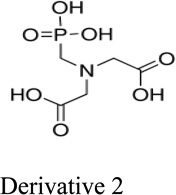
Next, we evaluated the structure activity relationship of glyphosine utilizing compounds we could commercially obtain (table 1). Derivative 1, with the removal of a CH2COOH moiety, did not stimulate or inhibit hybridoma peptide response. Of note, derivative 2, with the substitution of a carboxylic acid for a phosphate group, was able to stimulate both the anti-B:9–23 hybridomas, as well as the BDC 2.5 hybridoma targeting a chromogranin peptide, while glyphosine itself only stimulated B:9–23 responsive hybridomas.
Table 1.
Glyphosine and derivatives
| Small Molecule | EC50 for B:9–23 peptide | Generality |
|---|---|---|
 |
70.6 nM | Enhances stimulation of anti-B:9–23 hybridomas and not the anti-chromogranin BDC 2.5 hybridoma |
 |
No stimulation or inhibition | NA |
 |
194 nM | Enhances stimulation of both anti-B:9–23 hybridomas and BDC 2.5 hybridoma |
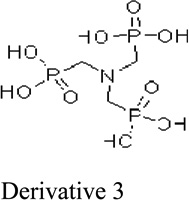 |
No stimulation or inhibition | NA |
 |
No stimulation or inhibition | NA |
Glyphosine stimulates IL-10 production from NOD splenocytes
We next evaluated the in vitro response of a polyclonal T cell population targeted to the B:9–23 peptide (rather than hybridomas). Figure 4A shows an enzyme-linked immunospot (Elispot) assay with NOD mouse splenocytes in culture with glyphosine. We found a three to four fold increase in IL-10 producing cells from NOD splenocytes stimulated with glyphosine plus B:9–23 peptide compared to B:9–23 peptide alone (Fig. 4D, left columns). To evaluate the in vivo IL-10 response to glyphosine treatment, adult female NOD mice received daily injections of glyphosine for five days. In vivo glyphosine treatment enhanced IL-10 Elispot response of ex vivo splenocytes cultured in the presence of B:9–23 peptide (Fig. 4B), but resulted in no change in IFN-γ spots (Fig. 4C).
Fig. 4.

Glyphosine stimulates IL-10 production from NOD splenocytes. (A) IL-10 Elispot with 500 nm glyphosine. Number of spots for each well is shown in the upper left hand corner. (B–C) Ex vivo IL-10 and IFN-γ Elispot assays from 10 week old female NOD mice treated with 80 mg/kg/day of glyphosine by intraperitoneal administration for 5 days. IL-10 is increased with glyphosine while IFN-γ spot number remains unchanged. *p=0.014. (D) IL-10 Elispot assays from mice with differing I-A molecules. *p=0.011, **p=0.008. Each bar represents the mean spot number of triplicates ± SEM. from at least four mice per group. (E) Glyphosine treatment prevents diabetes development. Survival curve of a diabetes prevention study in 4 week old NOD mice obtained from Jackson Laboratories. The glyphosine treated mice are statistically different (p<0.001) compared to controls receiving phosphate buffered saline.
To evaluate the strain specificity of glyphosine plus insulin B:9–23 stimulation, Elispot assays were performed using age and sex matched Balb/c and C57BL/6 mice which have different class II presenting molecules compared to NOD mice. Balb/c possess MHC class II I-Ad and I-Ed. In both Balb/c and C57BL/6 mice pocket 9 does not have a basic charge as is the case in NOD mice. Splenocytes from both strains failed to respond to glyphosine plus B:9–23 peptide (Fig. 4D, middle columns), which is not unexpected as these strains are not prone to develop anti-B:9–23 T cell responses. To test whether this lack of response maps to the MHC, splenocytes from C57BL/6 mice congenic for I-Ag7 were cultured with B:9–23 peptide and glyphosine (Fig. 4D, right columns). The I-Ag7 congenic splenocytes responded to glyphosine stimulation in the presence of B:9–23 peptide, genetically mapping the IL-10 response to the MHC region.
Glyphosine treatment delays diabetes onset in NOD mice
IL-10 has anti-inflammatory properties reported to down regulate T helper 1 (Th1) cytokines, such as IFN-γ (27), and is associated with Tr1 regulatory T cells (28,29). Glyphosine could be an immunomodulatory agent for the treatment and prevention of type 1 diabetes. We evaluated whether in vivo administration would delay the development of diabetes (Fig. 4E). NOD mice received glyphosine starting at 4 weeks of age and treatment concluded at 21 weeks of age. Prevention of diabetes occurred as long as therapy was administered (p<0.001); however, cessation of glyphosine treatment resulted in diabetes development at a rate similar to the control mice between 10 and 30 weeks of age.
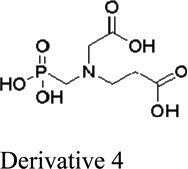
Glyphosine enhances IL-10 Elispot assays in HLA-DQ8 type 1 diabetic individuals
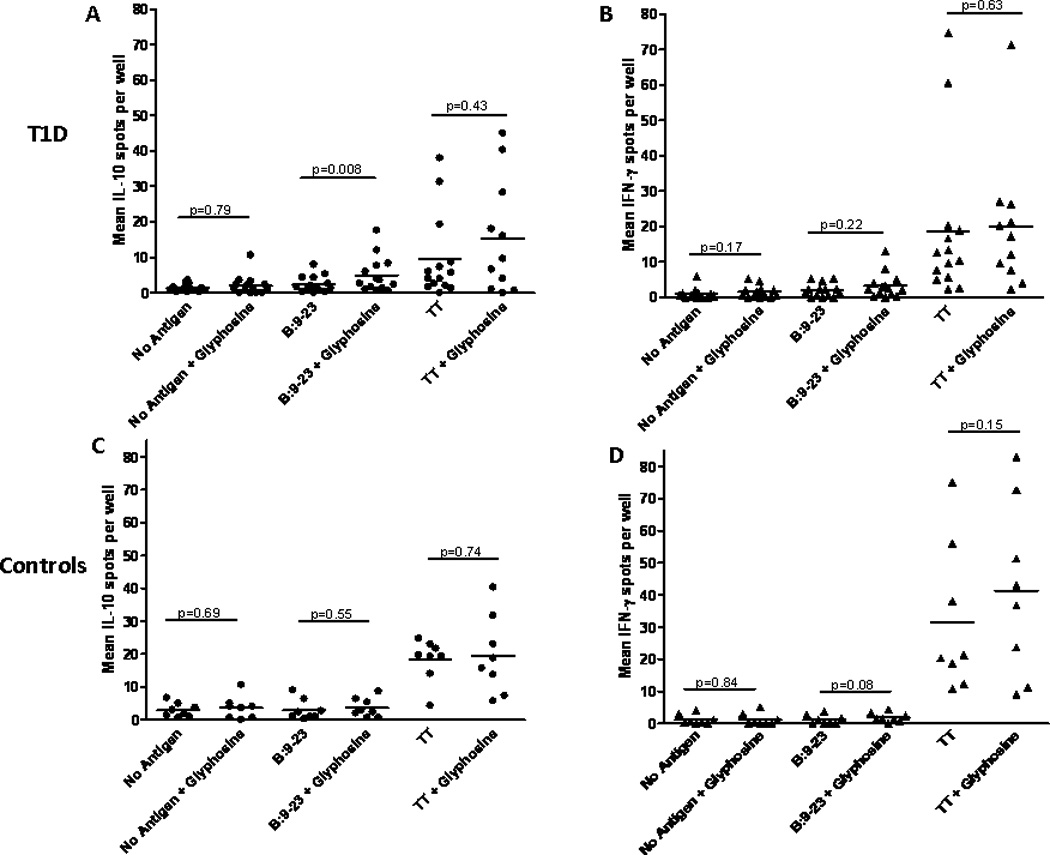
With the remarkable homology between murine I-Ag7 and human DQ8, we evaluated the glyphosine IL-10 response in human cells using an indirect Elispot assay (30) from DQ8 individuals with and without type 1 diabetes; clinical characteristics and DR genotyping are depicted in table 2. Peripheral blood mononuclear cells (PBMCs) were isolated from DQ8 individuals and cultured with peptides (including insulin B:9–23) and glyphosine. The PBMCs are washed, cultured with the individual’s lymphocytes, and IL-10 & IFN-γ spots are developed and enumerated. In type 1 diabetic individuals, IL-10 Elispots are increased with glyphosine and B:9–23 peptide compared to B:9–23 peptide alone or glyphosine alone (Fig. 5A). IFN-γ Elispots are unchanged with the addition of glyphosine and B:9–23 peptide (Fig. 5B). DQ8 controls without diabetes did not show any difference in Elispot number for IL-10 (Fig. 5C) and IFN-γ (Fig. 5D) with the addition of glyphosine. Glyphosine did not alter the IL-10 or IFN-γ response to tetanus toxin in type 1 diabetics or controls. In summary, there is a correlation between the number of IL-10 spots with B:9–23 peptide and glyphosine compared to B:9–23 peptide alone in the diabetic group (Fig. 6A); however, no correlation exists in the DQ8 controls without diabetes (Fig. 6B).
Table 2.
Clinical characteristics and HLA genotype in patients with type 1 diabetes and nondiabetic control subjects.
| Case No. Patients |
Age (years) |
Sex | T1D Duration (months) |
DR Genotype |
|---|---|---|---|---|
| 1 | 16 | F | 304 | x/4 |
| 2 | 28 | F | 145 | 4/8 |
| 3 | 19 | F | 2 | 4/6 |
| 4 | 39 | F | 373 | 4/5 |
| 5 | 9 | F | 30 | 3/4 |
| 6 | 14 | M | 30 | 1/4 |
| 7 | 23 | F | 40 | 3/4 |
| 8 | 15 | M | 30 | 4/4 |
| 9 | 20 | F | 9 | 3/4 |
| 10 | 9 | F | 6 | 4/4 |
| 11 | 10 | M | 11 | 3/4 |
| 12 | 16 | M | 18 | 3/4 |
| 13 | 20 | M | 42 | 4/7 |
| 14 | 17 | M | 0 | 1/4 |
| Control Subjects | ||||
| C1 | 37 | F | - | 4/5 |
| C2 | 20 | M | - | 1/4 |
| C3 | 17 | F | - | 4/7 |
| C4 | 36 | F | - | 4/4 |
| C5 | 20 | F | - | 1/4 |
| C6 | 18 | F | - | 1/4 |
| C7 | 32 | F | - | 4/4 |
| C8 | 25 | F | - | 4/4 |
T1D = type 1 diabetes; DQ8 is part of the DR4 haplotype; x = unable to obtain complete DR genotype.
Fig. 5.
IL-10 and IFN-γ Elispot assays from DQ8 type 1 diabetic individuals and controls. (A) IL-10 Elispot in type 1 diabetic subjects (n=14) showing an increase in IL-10 spots with glyphosine and B:9–23 peptide compared to B:9–23 peptide alone. (B) IFN-γ Elispot showing no change in number when glyphosine is added to culture with or without B:9–23 peptide. (C) IL-10 and (D) IFN-γ Elispots from nondiabetic DQ8 controls (n=8) showing no change in spot number with glyphosine. All patients produced IFN-γ in response to a tetanus toxin peptide (used as a positive control) which did not change in response to glyphosine. Each data point represents the mean spot number from triplicate wells for an individual. Wilcoxon matched pairs test was used to compare means between groups and p values are labeled on graphs for ease of comparison.
Fig. 6.
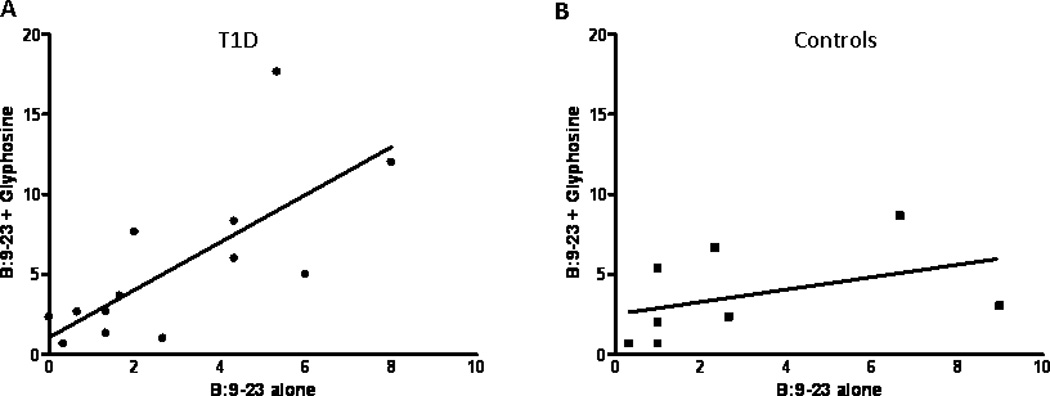
Correlation between IL-10 Elispots with and without glyphosine in the presence of B:9–23 peptide. Mean IL-10 Elispots from (A) DQ8 Individuals with type 1 diabetes (n=14) and (B) non-diabetic DQ8 controls (n=8). There is a statistically significant correlation between the insulin B:9–23 spot number and spots in the presence of peptide and glyphosine for individuals with type 1 diabetes (p=0.002, r2=0.56). There is no correlation with the DQ8 controls (p=0.30, r2=0.17). T1D = type 1 diabetes.
Discussion
Our studies indicate that small organic molecules identified by an in silico docking algorithm targeted to pockets in the binding groove of the NOD MHC class II molecule, I-Ag7, can alter presentation of the insulin peptide B:9–23. Furthermore, these molecules have similar effects with human components of the anti-insulin trimolecular complex. Pocket 9 compounds resulted in enhanced TCR response while compounds predicted to occupy p1 and p6 inhibited TCR activation.
Small molecules have been used in the context of MHC class II antigen presentation. Molecules exist that act as a catalyst and facilitate peptide loading onto human DR (31,32), and a recent study by Call and colleagues identified a small molecule with in vivo activity that accelerated the rate of peptide loading onto DR (33). Though small molecules have been studied in the context of MHC class II antigen presentation, our study is the first to identify small molecules using a molecular docking algorithm that are predicted to interact with the MHC class II peptide binding groove for the purpose of inhibiting or enhancing the T cell response to a specific target peptide.
Only two small molecules predicted to bind pocket 1 and 6 specifically blocked the T cell response to insulin B:9–23. The insulin B:9–23 peptide can bind to I-Ag7 in multiple different registers (34,35), and in particular the BDC 12-4.1 hybridoma and other TCRs recognize the B:12–23 peptide in a low affinity register, termed “register 3.” Given the very low affinity register for B:9–23, and the fact that peptide binding is recognized by multiple autoreactive TCRs, there is the potential that small molecules differentially inhibit TCR responses to specific peptides. This may explain why specific small molecules inhibit B:9–23 responses but not the anti-chromogranin mimotope BDC 2.5 responses which has a higher affinity for I-Ag7.
Unlike the pocket 1 and 6 small molecules, the pocket 9 molecule, glyphosine, enhanced the T cell response to the insulin B:9–23 peptide. The low affinity register of binding for the B:9–23 peptide presumably has the arginine residue of the peptide occupying pocket 9 along the I-Ag7 binding groove (7). A polymorphism in the gene encoding the β chain of I-Ag7 and DQ8 alters the electrostatic nature of pocket 9 due to the substitution of serine or alanine for aspartic acid at the β57 position (3,36). This substitution disrupts a salt bridge between β57 aspartic acid and α76 arginine, thus allowing the basic arginine residue to interact with the amino acid side chain of peptides bound in p9 of I-Ag7 and DQ8 (fig. S1). Glyphosine is capable of being negatively charged at a neutral pH and we postulate that glyphosine changes the register of peptide binding when occupying pocket 9. It has been shown that the peptide amino acid occupied in pocket 9 of I-Ag7, either neutral or negatively charged, can affect TCR/peptide-MHC affinity (4). The enhanced IL-10 response we observed in the presence of glyphosine may reflect this altered TCR interaction.
Glyphosine administration to NOD mice increased IL-10 production from splenocytes (Fig. 4B) without changing IFN-γ responses by Elispot. With glyphosine, the increased IL-10 spot numbers were more pronounced in the presence of insulin B:9–23 peptide but this increase was also observed in our no antigen and tetanus toxin controls (approximately 2 fold higher in the presence of glyphosine). We hypothesize the increased IL-10 response in the presence of glyphosine may be due to insulin peptide-MHC complexes that are already present in the spleens of adult NOD mice or effects on additional endogenous peptides.
In vivo, glyphosine prevention of diabetes was not sustained upon glyphosine withdrawal, and we hypothesize that enhanced IL-10 production following glyphosine treatment contributed to protection from diabetes. IL-10 has anti-inflammatory properties reported to down regulate T helper 1 (Th1) cytokines, and may upregulate regulatory T cell responses such as Tr1 regulatory T cells (27–29). Adeno-associated virus vector expression of IL-10 has successfully prevented diabetes when administered to 4 week old NOD mice along with increasing the CD4+CD25+ regulatory T cell population (37,38). This IL-10 hypothesis will require further testing with NOD IL-10 knockout mice or with the use of antibodies to IL-10 or the IL-10 receptor; alternatively the IL-10 response may correlate with other aspects of immunomodulation which affords protection from diabetes.
In conclusion, our findings demonstrate that a structure-based strategy can pinpoint structural features at the peptide/MHC interface and identify molecules that enhance or inhibit TCR signaling in response to specific peptide antigens. We believe the combination of structure guided virtual screening and the concept that small molecules targeted to specific MHC pockets can be immunomodulatory has broad relevance to adaptive immunity and autoimmunity.
Supplementary Material
Acknowledgements
We would like to thank the Drug Synthesis and Chemistry Branch, Developmental Therapeutics Program, Division of Cancer Treatment and Diagnosis, National Cancer Institute for providing the small molecules used in our study. We would also like to thank J. Kappler for generously providing us with the I-Ag7 protein construct, and P. Pratt for technical assistance in islet isolation.
This work was supported by grants from the National Institutes of Diabetes & Digestive & Kidney Diseases (R01 DK055969), the National Institutes of Health Diabetes & Endocrinology Research Core grant (P30 DK057516), the National Institute of Allergy & Infectious Diseases (U519 AI050864-08), the Juvenile Diabetes Foundation (4-2007-1056 and 17-2010-744), the Brehm Coalition, and the Children’s Diabetes Foundation.
Reference List
- 1.Harjutsalo V, Sjoberg L, Tuomilehto J. Time trends in the incidence of type 1 diabetes in Finnish children: a cohort study. Lancet. 2008;371:1777–1782. doi: 10.1016/S0140-6736(08)60765-5. [DOI] [PubMed] [Google Scholar]
- 2.Jones EY, Fugger L, Strominger JL, Siebold C. MHC class II proteins and disease: a structural perspective. Nature Reviews Immunology. 2006;6:271–282. doi: 10.1038/nri1805. [DOI] [PubMed] [Google Scholar]
- 3.Latek RR, Suri A, Petzold SJ, Nelson CA, Kanagawa O, Unanue ER, Fremont DH. Structural basis of peptide binding and presentation by the type I diabetes-associated MHC class II molecule of NOD mice. Immunity. 2000;12:699–710. doi: 10.1016/s1074-7613(00)80220-4. [DOI] [PubMed] [Google Scholar]
- 4.Yoshida K, Corper AL, Herro R, Jabri B, Wilson IA, Teyton L. The diabetogenic mouse MHC class II molecule I-Ag7 is endowed with a switch that modulates TCR affinity. J. Clin. Invest. 2010;120:1578–1590. doi: 10.1172/JCI41502. [DOI] [PMC free article] [PubMed] [Google Scholar]
- 5.Nakayama M, Beilke JN, Jasinski JM, Kobayashi M, Miao D, Li M, Coulombe MG, Liu E, Elliott JF, Gill RG, Eisenbarth GS. Priming and effector dependence on insulin B:9–23 peptide in NOD islet autoimmunity. J. Clin. Invest. 2007;117:1835–1843. doi: 10.1172/JCI31368. [DOI] [PMC free article] [PubMed] [Google Scholar]
- 6.Mohan JF, Levisetti MG, Calderon B, Herzog JW, Petzold SJ, Unanue ER. Unique autoreactive T cells recognize insulin peptides generated within the islets of Langerhans in autoimmune diabetes. Nat. Immunol. 2010 doi: 10.1038/ni.1850. [DOI] [PMC free article] [PubMed] [Google Scholar]
- 7.Stadinski BD, Zhang L, Crawford F, Marrack P, Eisenbarth GS, Kappler JW. Diabetogenic T cells recognize insulin bound to IAg7 in an unexpected, weakly binding register. Proc Natl. Acad. Sci. U. S. A. 2010;107:10978–10983. doi: 10.1073/pnas.1006545107. [DOI] [PMC free article] [PubMed] [Google Scholar]
- 8.Kobayashi M, Jasinski J, Liu E, Li M, Miao D, Zhang L, Yu L, Nakayama M, Eisenbarth GS. Conserved T cell receptor alpha-chain induces insulin autoantibodies. Proc. Natl. Acad. Sci. U. S. A. 2008;105:10090–10094. doi: 10.1073/pnas.0801648105. [DOI] [PMC free article] [PubMed] [Google Scholar]
- 9.Zhang L, Jasinski JM, Kobayashi M, Davenport B, Johnson K, Davidson H, Nakayama M, Haskins K, Eisenbarth GS. Analysis of T cell receptor beta chains that combine with dominant conserved TRAV5D-4*04 anti-insulin B:9–23 alpha chains. J. Autoimmun. 2009 doi: 10.1016/j.jaut.2009.02.003. [DOI] [PMC free article] [PubMed] [Google Scholar]
- 10.Herold KC, Hagopian W, Auger JA, Poumian-Ruiz E, Taylor L, Donaldson D, Gitelman SE, Harlan DM, Xu D, Zivin RA, Bluestone JA. Anti-CD3 monoclonal antibody in new-onset type 1 diabetes mellitus. N. Engl. J. Med. 2002;346:1692–1698. doi: 10.1056/NEJMoa012864. [DOI] [PubMed] [Google Scholar]
- 11.Keymeulen B, Vandemeulebroucke E, Ziegler AG, Mathieu C, Kaufman L, Hale G, Gorus F, Goldman M, Walter M, Candon S, Schandene L, Crenier L, De Block C, Seigneurin JM, De Pauw P, Pierard D, Weets I, Rebello P, Bird P, Berrie E, Frewin M, Waldmann H, Bach JF, Pipeleers D, Chatenoud L. Insulin needs after CD3-antibody therapy in new-onset type 1 diabetes. N. Engl. J. Med. 2005;352:2598–2608. doi: 10.1056/NEJMoa043980. [DOI] [PubMed] [Google Scholar]
- 12.Kitchen DB, Decornez H, Furr JR, Bajorath J. Docking and scoring in virtual screening for drug discovery: methods and applications. Nat. Rev. Drug Discov. 2004;3:935–949. doi: 10.1038/nrd1549. [DOI] [PubMed] [Google Scholar]
- 13.Ferrara P, Gohlke H, Price DJ, Klebe G, Brooks CL., III Assessing scoring functions for protein-ligand interactions. J. Med. Chem. 2004;47:3032–3047. doi: 10.1021/jm030489h. [DOI] [PubMed] [Google Scholar]
- 14.Ewing TJ, Makino S, Skillman AG, Kuntz ID. DOCK 4.0: search strategies for automated molecular docking of flexible molecule databases. J. Comput. Aided Mol. Des. 2001;15:411–428. doi: 10.1023/a:1011115820450. [DOI] [PubMed] [Google Scholar]
- 15.Holst J, Szymczak-Workman AL, Vignali KM, Burton AR, Workman CJ, Vignali DA. Generation of T-cell receptor retrogenic mice. Nat. Protoc. 2006;1:406–417. doi: 10.1038/nprot.2006.61. [DOI] [PubMed] [Google Scholar]
- 16.Scott-Browne JP, White J, Kappler JW, Gapin L, Marrack P. Germline-encoded amino acids in the alphabeta T-cell receptor control thymic selection. Nature. 2009;458:1043–1046. doi: 10.1038/nature07812. [DOI] [PMC free article] [PubMed] [Google Scholar]
- 17.Bugawan TL, Erlich HA. Rapid typing of HLA-DQB1 DNA polymorphism using nonradioactive oligonucleotide probes and amplified DNA. Immunogenetics. 1991;33:163–170. doi: 10.1007/BF01719235. [DOI] [PubMed] [Google Scholar]
- 18.Nagata M, Kotani R, Moriyama H, Yokono K, Roep BO, Peakman M. Detection of autoreactive T cells in type 1 diabetes using coded autoantigens and an immunoglobulin-free cytokine ELISPOT assay: report from the fourth immunology of diabetes society T cell workshop. Ann. N. Y. Acad. Sci. 2004;1037:10–15. 10–15. doi: 10.1196/annals.1337.002. [DOI] [PubMed] [Google Scholar]
- 19.Corper AL, Stratmann T, Apostolopoulos V, Scott CA, Garcia KC, Kang AS, Wilson IA, Teyton L. A structural framework for deciphering the link between I-Ag7 and autoimmune diabetes. Science. 2000;288:505–511. doi: 10.1126/science.288.5465.505. [DOI] [PubMed] [Google Scholar]
- 20.Lee KH, Wucherpfennig KW, Wiley DC. Structure of a human insulin peptide/HLA-DQ8 complex and susceptibility to type 1 diabetes. Nature Immunology. 2001;2:501–507. doi: 10.1038/88694. [DOI] [PubMed] [Google Scholar]
- 21.Karttunen J, Shastri N. Measurement of ligand-induced activation in single viable T cells using the lacZ reporter gene. Proc. Natl. Acad. Sci. U. S. A. 1991;88:3972–3976. doi: 10.1073/pnas.88.9.3972. [DOI] [PMC free article] [PubMed] [Google Scholar]
- 22.Mohan JF, Levisetti MG, Calderon B, Herzog JW, Petzold SJ, Unanue ER. Unique autoreactive T cells recognize insulin peptides generated within the islets of Langerhans in autoimmune diabetes. Nat. Immunol. 2010;11:350–354. doi: 10.1038/ni.1850. [DOI] [PMC free article] [PubMed] [Google Scholar]
- 23.Kozono H, White J, Clements J, Marrack P, Kappler J. Production of soluble MHC class II proteins with covalently bound single peptides. Nature. 1994;369:151–154. doi: 10.1038/369151a0. [DOI] [PubMed] [Google Scholar]
- 24.Stadinski BD, Delong T, Reisdorph N, Reisdorph R, Powell RL, Armstrong M, Piganelli JD, Barbour G, Bradley B, Crawford F, Marrack P, Mahata SK, Kappler JW, Haskins K. Chromogranin A is an autoantigen in type 1 diabetes. Nat. Immunol. 2010;11:225–231. doi: 10.1038/ni.1844. [DOI] [PMC free article] [PubMed] [Google Scholar]
- 25.Suri A, Walters JJ, Gross ML, Unanue ER. Natural peptides selected by diabetogenic DQ8 and murine I-A(g7) molecules show common sequence specificity. J. Clin. Invest. 2005;115:2268–2276. doi: 10.1172/JCI25350. [DOI] [PMC free article] [PubMed] [Google Scholar]
- 26.Eerligh P, van LM, Zaldumbide A, Moustakas AK, Duinkerken G, Bondinas G, Koeleman BP, Papadopoulos GK, Roep BO. Functional consequences of HLA-DQ8 homozygosity versus heterozygosity for islet autoimmunity in type 1 diabetes. Genes Immun. 2011 doi: 10.1038/gene.2011.24. [DOI] [PubMed] [Google Scholar]
- 27.Zhu H, Qiu W, Lei P, Zhou W, Wen X, He F, Li L, Dai H, Shen G, Gong F. IL-10 gene modified dendritic cells inhibit T helper type 1-mediated alloimmune responses and promote immunological tolerance in diabetes. Cell Mol. Immunol. 2008;5:41–46. doi: 10.1038/cmi.2008.5. [DOI] [PMC free article] [PubMed] [Google Scholar]
- 28.Battaglia M, Gregori S, Bacchetta R, Roncarolo MG. Tr1 cells: from discovery to their clinical application. Semin. Immunol. 2006;18:120–127. doi: 10.1016/j.smim.2006.01.007. [DOI] [PubMed] [Google Scholar]
- 29.Roncarolo MG, Gregori S, Battaglia M, Bacchetta R, Fleischhauer K, Levings MK. Interleukin-10-secreting type 1 regulatory T cells in rodents and humans. Immunol. Rev. 2006;212:28–50. doi: 10.1111/j.0105-2896.2006.00420.x. [DOI] [PubMed] [Google Scholar]
- 30.Arif S, Tree TI, Astill TP, Tremble JM, Bishop AJ, Dayan CM, Roep BO, Peakman M. Autoreactive T cell responses show proinflammatory polarization in diabetes but a regulatory phenotype in health. J. Clin. Invest. 2004;113:451–463. doi: 10.1172/JCI19585. [DOI] [PMC free article] [PubMed] [Google Scholar]
- 31.Hopner S, Dickhaut K, Hofstatter M, Kramer H, Ruckerl D, Soderhall JA, Gupta S, Marin-Esteban V, Kuhne R, Freund C, Jung G, Falk K, Rotzschke O. Small organic compounds enhance antigen loading of class II major histocompatibility complex proteins by targeting the polymorphic P1 pocket. J. Biol. Chem. 2006;281:38535–38542. doi: 10.1074/jbc.M606437200. [DOI] [PubMed] [Google Scholar]
- 32.Nicholson MJ, Moradi B, Seth NP, Xing X, Cuny GD, Stein RL, Wucherpfennig KW. Small molecules that enhance the catalytic efficiency of HLA-DM. J. Immunol. 2006;176:4208–4220. doi: 10.4049/jimmunol.176.7.4208. [DOI] [PMC free article] [PubMed] [Google Scholar]
- 33.Call MJ, Xing X, Cuny GD, Seth NP, Altmann DM, Fugger L, krogsgaard M, Stein RL, Wucherpfennig KW. In vivo enhancement of peptide display by MHC class II molecules with small molecule catalysts of peptide exchange. J. Immunol. 2009;182:6342–6352. doi: 10.4049/jimmunol.0803464. [DOI] [PMC free article] [PubMed] [Google Scholar]
- 34.Suri A, Vidavsky I, van der DK, Kanagawa O, Gross ML, Unanue ER. APCs, the autologous peptides selected by the diabetogenic I-Ag7 molecule are unique and determined by the amino acid changes in the P9 pocket. J. Immunol. 2002;168:1235–1243. doi: 10.4049/jimmunol.168.3.1235. [DOI] [PubMed] [Google Scholar]
- 35.Levisetti MG, Suri A, Petzold SJ, Unanue ER. The insulin-specific T cells of nonobese diabetic mice recognize a weak MHC-binding segment in more than one form. J Immunol. 2007;178:6051–6057. doi: 10.4049/jimmunol.178.10.6051. [DOI] [PubMed] [Google Scholar]
- 36.Todd JA, Bell JI, McDevitt HO. A molecular basis for genetic susceptibility to insulin dependent diabetes mellitus. TIG. 1988;4:129–134. doi: 10.1016/0168-9525(88)90135-7. [DOI] [PubMed] [Google Scholar]
- 37.Bettini M, Vignali DA. Regulatory T cells and inhibitory cytokines in autoimmunity. Curr. Opin. Immunol. 2009;21:612–618. doi: 10.1016/j.coi.2009.09.011. [DOI] [PMC free article] [PubMed] [Google Scholar]
- 38.Goudy KS, Burkhardt BR, Wasserfall C, Song S, Campbell-Thompson ML, Brusko T, Powers MA, Clare-Salzler MJ, Sobel ES, Ellis TM, Flotte TR, Atkinson MA. Systemic overexpression of IL-10 induces CD4+CD25+ cell populations in vivo and ameliorates type 1 diabetes in nonobese diabetic mice in a dose-dependent fashion. J. Immunol. 2003;171:2270–2278. doi: 10.4049/jimmunol.171.5.2270. [DOI] [PubMed] [Google Scholar]
Associated Data
This section collects any data citations, data availability statements, or supplementary materials included in this article.