Abstract
High-frequency ultrasound (HFU) shows promise for fine-resolution imaging. However, the depth of field (DOF) and penetration depth of HFU waves limit clinical significance. In a previous study using a 17-MHz annular array, we established that chirp coded excitation and synthetic focusing can improve penetration depth and DOF simultaneously. In this study, we evaluated the same approach using two five-element annular arrays with focal lengths of 12 mm, total apertures of 6 mm. The annular arrays had center frequencies of ≈35 MHz and were excited by a 4-μs chirp signal spanning the frequency range 15–65 MHz. Results demonstrated that DOF could be increased by a factor of about 3, SNR could be increased by more than 10 dB, and penetration depth into an attenuating phantom could be increased by 1.8 mm. The chirp imaging method was then evaluated on low-contrast phantoms and mouse embryos.
I. Introduction
High-frequency (i.e., f >15 MHz) ultrasound (HFU) is under considerable investigation because its wavelengths (e.g., 100 μm at 15 MHz) and small focal-zone beam diameters provide fine-resolution images. Studies have demonstrated the unique ability of HFU systems to image shallow or low-attenuation tissues for biomedical applications. For example, HFU already has been successful for small-animal [1], ocular [2], intravascular [3], and dermatological imaging [4]. However, the fine-resolution advantages offered by HFU are offset by limitations in penetration depth caused by frequency-dependent attenuation and limitations in depth-of-field (DOF) when low F-number transducers are employed to improve cross-range resolution.
In a previous study conducted using a 17-MHz, 5-element annular array, we proposed and validated an approach to mitigate both limitations of HFU imaging [5]. Our approach consisted of combining synthetic-focusing to increase DOF [6], and chirp coded excitations (i.e., engineered excitation pulses) to increase the effective penetration depth by improving signal-to-noise ratio (SNR) [7]. The results of our study demonstrated that we could successfully increase DOF and penetration depth while maintaining satisfactory resolution [5]. In the present study, we propose to use similar imaging methods with a 34-MHz, 5-element annular array.
II. Methods
A. Annular-array and Synthetic-focusing
Two annular arrays, termed AA1 and AA2, were utilized during the course of these studies. The transducers were fabricated with identical methods as described in [6]. The only significant difference between the two transducers was AA1 was fabricated with a PVDF membrane [6] and AA2 was fabricated with a P(VDF-TrFE) membrane. Each array was assembled from a 9-μm thick membrane (Ktech Corp., Albuquerque, NM) bonded to a single-sided, copper-clad polyimide (CCP) film (RFlex 1000L810, Rogers Corp., Chandler, AZ). An array pattern was etched onto the CCP using standard printed-circuit-board etching techniques. Both arrays had five, equal-area annuli, a radius of curvature of 12 mm, and a total aperture of 6 mm. Table I summarizes the performance characteristics of the two annular arrays.
TABLE I.
Summary of annular-array transducer performance
| Annular Array AA1 | |||||
|---|---|---|---|---|---|
| Ring | fc (MHz) | dB@fc | BW6dB (% ) | IL (dB) | fIL (MHz) |
| 1 | 35.0 | 0 | 36 | −28 | 38 |
| 2 | 36.0 | −5 | 31 | −33 | 38 |
| 3 | 36.0 | −6 | 33 | −35 | 40 |
| 4 | 36.0 | −8 | 35 | −38 | 42 |
| 5 | 37.0 | −8 | 39 | −36 | 41 |
|
| |||||
| Annular Array AA2 | |||||
|
| |||||
| 1 | 33.0 | 0 | 35 | −20 | 37 |
| 2 | 34.5 | −4 | 30 | −26 | 37 |
| 3 | 34.0 | −6 | 35 | −31 | 38 |
| 4 | 33.5 | −7 | 32 | −29 | 37 |
| 5 | 34.0 | −8 | 41 | −28 | 38 |
A synthetic-focusing algorithm was developed to permit the focus of the annular array to be axially shifted by post-processing the acquired data [5]. To focus the array to a depth d on transmit, the time delay tn required for ring n of the array is where R is the geometric focus (i.e., 12 mm) and an is the average radius of ring n [8]. The round trip delay is then the sum of the transmit and receive delays giving ttot = tT + tR. To focus at a depth d, ttot is calculated for all 25 transmit/receive pairs. The delays are then applied to the A-lines and the resulting signals are summed. In order to increase the DOF over a fixed axial span, d is shifted in intervals of Δd. Then, an overall image is formed by windowing the data at each focal depth and assembling the windowed data into a final composite image. In all of our experiments, Δd is chosen to be 0.2 mm. (If ttot = 0 is utilized for all of the delays, then the results simulate a single-element transducer with a total aperture of 6 mm and a geometric focus of 12 mm.)
B. Chirp Coded Excitation
Linear chirp-coded excitations were used in this study. Linear chirps are described by
| (1) |
After several iterations between, simulations and quartz-plate reflections, we decided on a set of optimal chirp parameters: f1 = 15 MHz, f2 = 65 MHz and T = 4 μs. Finally, w(t), the tapering window, was a 9%-Tukey window. In all of our experiments, the compression filter consisted of the time-reversed excitation chirp weighted by a Chebyshev window with a prescribed sidelobe level of −80 dB. (The same chirp and compression filters were used for AA1 and AA2.)
C. Data acquisition
Data acquisition is performed using the same equipment and the same method as in our 17-MHz studies [5]. Briefly, image data were acquired with the annular array by making five scan passes across the test object. On each pass, one of the array elements was excited and the receive echoes were digitized at 400 MHz on all five channels. In this way, we were able to acquire the full set of 25 transmit-to-receive combinations. After saving the data, each digitized signal was linearly filtered by the compression filter. The compressed data was then synthetically focused, envelope-detected, and log-compressed for B-mode display. We also acquired data using a mono-cycle pulser (Avtech AVB2-TA-C-CVA, Ottawa, Ontario, Canada) and/or using a Panametrics 5900 pulser/receiver unit (Olympus NDT, Waltham, MA) in order to make a comparison to the “gold standard”. The scanning method and image formation for the mono-cycle (i.e., Avtech or Panametrics) excitation were the same as for the chirp imaging method except that no compression was performed. For chirp-coded excitation imaging, the pulser-receiver unit was replaced by an arbitrary waveform generator (WW1281, Tabor Electronics, Haifa, Israel) followed by a linear broadband amplifier with a gain of 50 dB (ENI 350L, Rochester, NY).
III. Results
A. Resolutions and penetration depth
To validate the coded-excitation methods, two experimental studies were performed to quantify and compare image resolution and penetration depth between conventional and chirp imaging. The resolution studies compared the −6-dB axial and lateral resolutions using the Avtech pulser, the Panametrics pulser, and chirp-compression imaging. For each imaging method, we scanned across 12-μm diameter tungsten wires placed at depths ranging from 8 mm to 18 mm. The penetration depth study consisted in imaging a tissue-mimicking phantom (ATS Laboratories Bridgeport, CT) containing 10-μm diameter glass beads (8×10⁶ beads/cm3). The phantom was scanned using chirp and Avtech pulse excitation. The phantom had an attenuation of 0.5 dB/cm/MHz near 6 MHz. After imaging, the envelope-detected backscattered signals were used to estimate SNR and penetration depth for each imaging method.
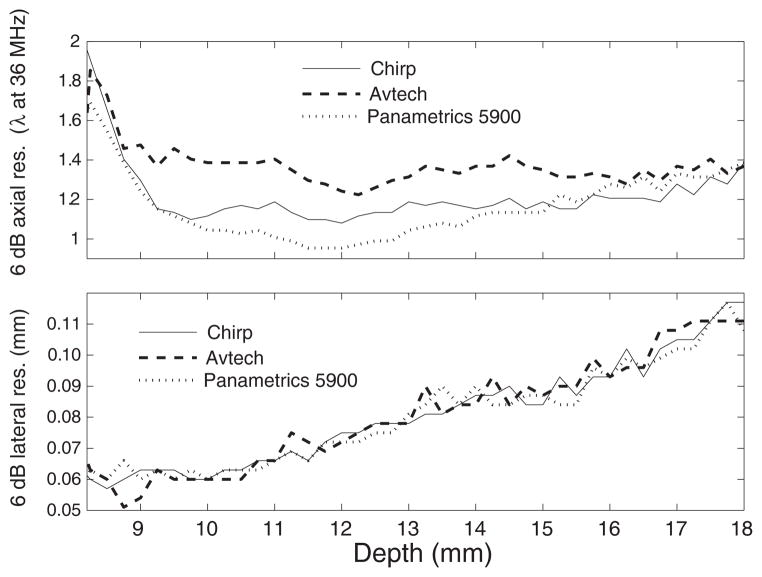
Figure 1 displays the 6-dB axial and lateral resolution measured using the three imaging methods. The axial-resolution results reveal that chirp imaging performs nearly as well as the Panametrics but better than the Avtech method. The Panametrics axial resolution was about 9% better than the chirp axial resolution at a depth near the geometric focus of the transducer (i.e., depth in the range 10.5 to 13.5 mm). However, the chirp method outperformed the Avtech method by 18% at depths in the range of 9 to 16 mm. As expected, the lateral resolution results were approximately the same for all three methods. The chirp processing was conducted individually for each A-line and therefore should not alter the lateral resolution. For the three imaging methods, the lateral resolution worsens with increasing depth because the synthetic-focusing algorithm simulates transducers with increasing F-numbers.
Fig. 1.
Axial (a) and lateral (b) −6 dB resolutions obtained as a function of depth using chirp, 1-cycle, and impulse (Panametrics) excitation.
Table II displays the SNRs and penetration depths for each of the four imaging methods. The penetration depth was estimated as the depth at which the absolute value of the gradient of the average backscatter signal dropped below a certain small threshold. The third column of Table II indicates that SNR increased with synthetic focusing and coded excitation. This was expected because synthetic focusing essentially increases signal strength and chirp compression decreases noise levels. The fourth column indicates the effective penetration depth. Note that in this experiment, the phantom was placed 10.5 mm away from the transducer (i.e., 1.5 mm before the natural focal depth of the transducer). The results demonstrate that synthetic focusing and chirp coding each contributed to increasing the effective penetration depth. The maximum effective penetration depth (i.e., 17.6 mm) and SNR (i.e., 73.0 dB) were obtained when both methods were combined. The chirp method (with synthetic focusing) allowed an increase of 1.8 mm in penetration depth (i.e., 25% increase within the phantom) and 12.7 dB in SNR when compared to the Avtech imaging method (with synthetic focusing).
TABLE II.
SNR and penetration depth. (The surface of the tissue-mimicking phantom was at a depth of 10.5 mm. SF stands for synthetic focusing)
| Method | SF | SNR (dB) | Penetration depth (mm) |
|---|---|---|---|
| Avtech | No | 46.5 | 14.1 |
| Avtech | Yes | 59.3 | 15.8 |
|
| |||
| Chirp | No | 58.3 | 15.2 |
| Chirp | Yes | 73.0 | 17.6 |
B. Biomedical applications
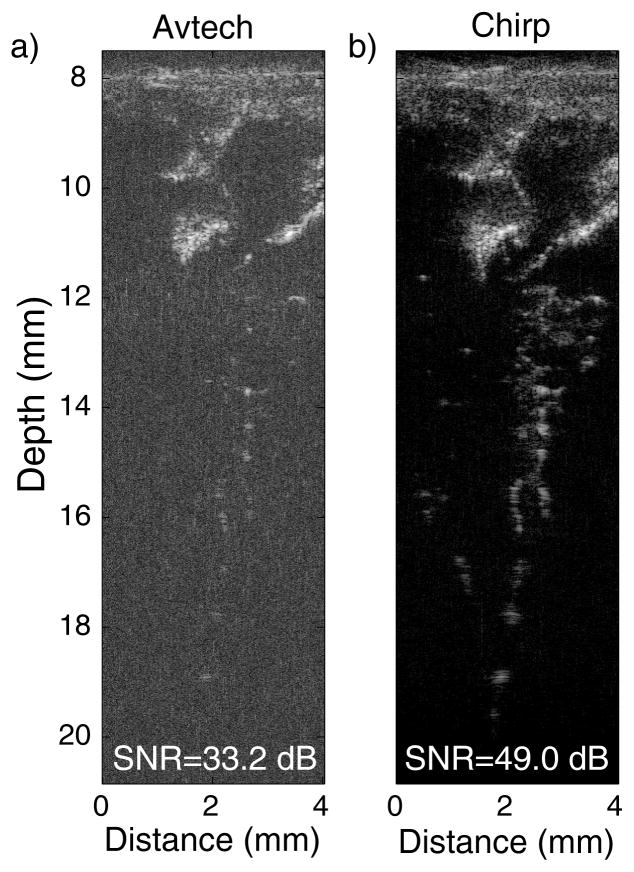
We fabricated a phantom in which fresh blood was suspended in agar to model vitreous hemorrhage. To make the phantom, 15 g of agar were diluted in 1 L of normal saline solution. After stirring, the solution was heated in a microwave oven until the agar was dissolved, which took approximately one minute. The agar phantom has very low attenuation and its acoustic properties similar to that of water or vitreous. The blood droplets provide a very-low-contrast target because the droplets are small and have acoustic impedance values similar to that of agar. Figures 2a and 2b display images of one of our blood phantoms using Avtech and chirp imaging, respectively. For comparison, both images were synthetically focused. The phantom front surface was placed 8 mm away from the transducer surface. The Avtech image (Fig. 2a) has a limited SNR (i.e., 33.2 dB) because the blood droplets are small and are weak reflectors of sound because their acoustic impedance is similar to that of the agar. At depths ranging from 10 to 12 mm, the blood is easily visible, but beyond 12 mm, it is more difficult to confidently visualize the blood droplets because of the noisy background and of the weak blood backscatter. The chirp image (Fig. 2a) has a greatly improved SNR (i.e., 49.0 dB). This SNR increase of 15.8 dB when compared to the Avtech image is comparable to the 12.7 dB SNR increase obtained in the penetration study (Table II). The improved SNR leads to an image with greater contrast. On Figure 2b, distinct blood droplets can be visualized significantly deeper (i.e., > 16 mm) into the phantom. This dramatic improvement could be critical in the diagnosis of vitreous hemorrhage because it would allow visualization of blood and other faintly reflective structures (cellular debris, vitreous membranes) with greater sensitivity than any currently available imaging techniques.
Fig. 2.
Synthetically focused images of a blood phantom obtained using the Avtech pulser (a) and the chirp imaging method (b). Dynamic range of both images is 45 dB.
In utero imaging of mouse embryos offers us the opportunity to evaluate the effectiveness (increased penetration depth and SNR) of the chirp coded-excitation over monocycle (e.g., Avtech or Panametrics pulsers) excitation. Mouse embryos were imaged at embryonic day (E) 12.5, where E0.5 was defined as noon of the day a vaginal plug was found after overnight mating. With the mouse placed in a supine position and its four limbs taped to an imaging stage, the stomach was shaved and a Petri dish with a circularly cut 25 mm imaging window was placed over the stomach and secured. The annular array transducer was lowered into the Petri dish full of saline solution, and the center array element was used for real time fixed-focus imaging at 3 frames per second. This imaging mode was used to quickly locate an embryo, position the image planes close to one of the standard slice orientations, and to configure the imaging parameters for a full array 3D study. With the geometric focus placed superficial to the embryo, a full 3D dataset was acquired for both standard mono-cycle and chirp-coded excitation, as described above. To image a complete embryo in 3D, we acquired 120 adjacent B-scans. The spacing between adjacent B-scans and adjacent A-lines in each B-scan was 50 μm. Each B-scan was about 7.5 mm wide (i.e., 151 A-lines) and about 9 mm deep (i.e., 5000 RF points per scan lines). With our current scanning system, acquiring and saving such a 3D dataset takes about 15 minutes.
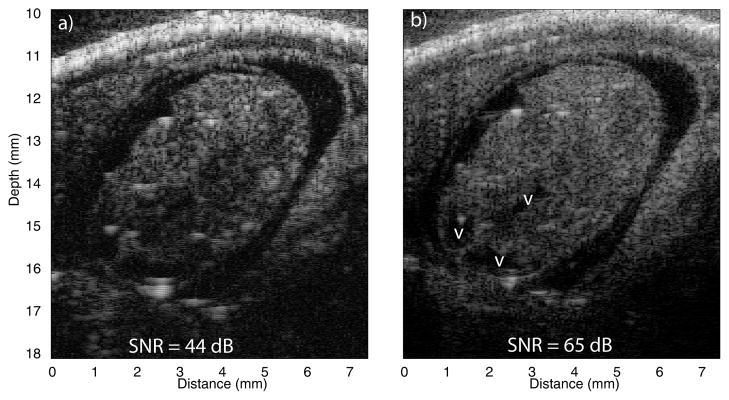
Figure 3 displays a section through the brain of a mouse embryo. Figure 3a was obtained using the Avtech pulse and Figure 3b using our chirp imaging method. The images are not perfectly spatially matched because the embryo is still alive during imaging. The chirp image had a much better SNR and allowed us to see details which were not visible on the Avtech image such as the brain ventricle (indicated by the letter V in Fig. 3b). Chirp imaging has potential for developmental studies in mouse embryos. Segmentation and 3D visualization of extended embryonic structures such as the brain ventricle system is very valuable and these images demonstrate that it might only be possible using the chirp images which provide much greater detail.
Fig. 3.
Synthetically focused images of the head of a mouse embryo obtained using the Avtech pulser (a), 45 dB dynamic range and the chirp imaging method (b), 65 dB dynamic range. Brain ventricles (v) are easily identified on the chirp image.
IV. Conclusions
The results of this study demonstrated that the methods developed with the 17-MHz annular array were also successful using the 35-MHz annular arrays. Furthermore, the chirp imaging method were evaluated on two biomedical imaging applications successfully. The images of weak scatterer embedded in agar demonstrated that chirps allow increased contrast and sensitivity and could potentially be used to image vitreous hemorrhage. Images of mouse embryos indicated that brain ventricles could be distinctively observed only on the chirp images. Therefore, chirp imaging might become a valuable tool for developmental biology studies.
Acknowledgments
This research was supported by NIH grant EB006509, the Riverside Research Institute Fund for Biomedical Engineering Research, and the Dyson Foundation. The authors would like to acknowledge the help of Harriet O. Lloyd in the design and implementation of the blood phantoms.
References
- 1.Turnbull DH. Ultrasound backscatter microscopy of mouse embryos. Methods Mol Biol. 2000;135:235–243. doi: 10.1385/1-59259-685-1:235. [DOI] [PubMed] [Google Scholar]
- 2.Silverman RH, Ketterling JA, Mamou J, Coleman DJ. Improved high-resolution ultrasonic imaging of the eye. Arch Ophthalmol. 2008;126:94–97. doi: 10.1001/archopht.126.1.94. [DOI] [PMC free article] [PubMed] [Google Scholar]
- 3.Saijo Y, Tanaka A, Owada N, Akino Y, Nitta S. Tissue velocity imaging of coronary artery by rotating-type intravascular ultrasound. Ultrasonics. 2004;42:753–757. doi: 10.1016/j.ultras.2003.11.022. [DOI] [PubMed] [Google Scholar]
- 4.Vogt M, Ermert H. In vivo ultrasound biomicroscopy of skin: spectral system characteristics and inverse filtering optimization. IEEE Trans Ulatrson Ferroelectr Freq Control. 2007;54:1551–1559. doi: 10.1109/tuffc.2007.425. [DOI] [PubMed] [Google Scholar]
- 5.Mamou J, Ketterling JA, Silverman RH. Chirp coded excitation imaging with a high-frequency ultrasound annular array. IEEE Trans Ultrason Ferroelect Freq Contr. 2008;58:508–513. doi: 10.1109/TUFFC.2008.670. [DOI] [PMC free article] [PubMed] [Google Scholar]
- 6.Ketterling JA, Aristizábal O, Turnbull DH, Lizzi FL. Design and fabrication of a 40-mhz annular array transducer. IEEE Trans Ultrason Ferroelecrt Freq Contr. 2005 doi: 10.1109/tuffc.2005.1428050. p. to appear. [DOI] [PMC free article] [PubMed] [Google Scholar]
- 7.Misaridis T, Jensen JA. Use of modulated excitation signals in medical ultrasound. part I: Basic concepts and expected benefits. IEEE Trans Ultrason Ferroelectr Freq Control. 2005;52:177–191. doi: 10.1109/tuffc.2005.1406545. [DOI] [PubMed] [Google Scholar]
- 8.Arditi M, Taylor WB, Foster FS, Hunt JW. An annular array system for high-resolution breast echography. Ultrasonic Imaging. 1982;4(1):1–31. doi: 10.1177/016173468200400101. [DOI] [PubMed] [Google Scholar]


