Abstract
Hybridization probes are often inefficient in the analysis of single-stranded DNA or RNA that are folded in stable secondary structures. An MB probe is a short DNA hairpin with a fluorophore and a quencher attached to the opposite sides of the oligonucleotide. The probe is widely used in real-time analysis of specific DNA and RNA sequences. This study demonstrates how conventional molecular beacon (MB) probe can be used for the analysis of nucleic acids that form very stable (Tm >80°C) hairpin structures. Here we demonstrate that MB probe is not efficient in direct analysis of secondary structure-folded analytes, while MB-based tricomponent probe is suitable for these purposes. Tricomponent probe takes advantage of two oligonucleotide adaptor strands f and m. Each adaptor strand contains a fragment complementary to the analyte and a fragment complementary to an MB probe. In the presence of a specific analyte the two adaptor strands hybridize to the analyte and the MB probe, thus forming a quadripartite complex. DNA strand f binds to the analyte with high affinity and unwinds its secondary structure. Strand m forms stable complex only with the fully complementary analyte. The MB probe fluorescently reports the formation of the quadripartite associate. It was demonstrated that DNA analytes folded in hairpin structures with stems containing 5, 6, 7, 8, 9, 11 or 13 base-pairs can be detected in real time with the limit of detection (LOD) lying in nanomolar range. The stability of the stem region in DNA analyte did not affect the LOD. Analytes containing single base substitutions in the stem or in the loop positions were discriminated from the fully complementary DNA at room temperature. The tricomponent probe promises to simplify nucleic acid analysis at ambient temperatures in such application as in vivo RNA monitoring, detection of pathogens and SNPs genotyping by DNA microarrays.
Keywords: multicomponent sensors, SNP analysis, molecular beacon probe, real-time assay, hybridization, DNA nanotechnology
Introduction
Hybridization of two complementary nucleic acids has been extensively explored in the analysis of specific DNA/RNA sequences in real-time PCR,[1] fluorescent in situ hybridization,[2] DNA microarrays,[3] and the techniques for RNA monitoring in living cells.[4] The design of the hybridization probes is based on A-T and G-C complementarity and may seem straightforward. However, single-stranded DNA and RNA analytes often form stable secondary structures under the assay conditions. The analysis of such folded analytes is complicated since a region of interest may be involved in intramolecular hybridization and become inaccessible for hybridization with a probe. For example, 16S rRNAs as well as their DNA amplicons can fail to hybridize to the complementary probes thus creating problems in application of oligonucleotide microarrays for the analysis of pathogenic bacteria.[5] The limitations might be very severe if a minor difference between two nucleic acids, such as single nucleotide polymorphisms (SNPs), is to be detected,[6a] or if a nucleic acid needs to be analyzed at ambient temperatures.[6b] Secondary structures in both target and probe molecules have been shown to unfavor probe-target duplex formation and slow the hybridization kinetic up to 160-fold,[7] thus raising concerns for the continued development of antisense agents and diagnostic probes.[7a]
For in vitro assays this problem can be addressed by using structure-free DNA with pseudo-complementary properties.[8] In this approach non-natural bases are introduced in DNA by DNA polymerases. The artificial bases form stable pairs with natural nucleotides, but fail to hybridize to each other, thus eliminating strong secondary structures. The requirement of synthetic non-natural bases may limit the spectrum of application of this technique. An alternative approach uses nucleic acid analogs that overcompete the base-paring of natural DNA and RNA and thus unwind the undesired secondary structures. Locked nucleic acid (LNA) and peptide nucleic acids (PNA) have been shown to enable the analysis of folded DNA and RNA at ambient temperatures.[9] However, tight binding of a probe to a target nucleic acid reduces the probe‘s selectivity and specificity.[10] Moreover, both LNA and PNA are relatively expensive commercial products.
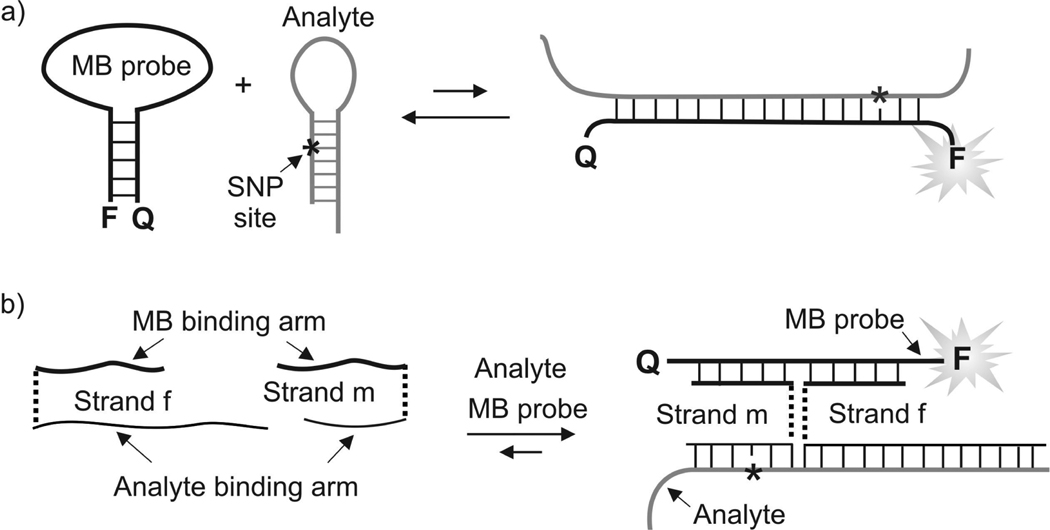
Recently, we suggested a DNA-based probe for the analysis of single nucleotide polymorphisms in folded nucleic acids.[11] The approach takes advantage of a molecular beacon (MB) probe, a state-of-the-art tool for nucleic acid analysis in real time.[12] MB probe is a DNA oligonucleotide that folds in a stem-loop structure (Figure 1a, left). In conventional MB probe, the loop usually consists of a 15–25 nucleotide single-stranded region complementary to the analyzed DNA or RNA, while the stem is made up of 4–6 base pairs. The oligonucleotide contains a fluorophore at its 5’ end and a quencher at its 3’ end. The quencher reduces the fluorophore’s fluorescence when MB probe is folded in the stem-loop conformation. Binding to a specific analyte separates the fluorophore from the quencher, thus enabling fluorescence increase. In its conventional design, MB probe is not always efficient in detecting stem-loop folded analytes, since the hybridization of two secondary structure-folded nucleic acids can be thermodynamically unfavorable (Figure 1a).
Figure 1.
Real-time detection of a single base substitution in stem-loop folded nucleic acids using an MB probe. a) Direct hybridization of an MB probe to the stem-loop folded analyte is inefficient, since two hairpin-folded oligonucleotides are in lower energy state than the duplex. b) A tricomponent probe for SNP analysis in folded nucleic acids. The quaternary complex is thermodynamically stabilized by the formation of a long duplex between strand f and the analyte. Triethylene glycol (TEG) linkers are shown as dashed lines. Asterisks represent SNP sites.
However, if used as a part of a tricomponent probe (Figure 1b), MB probe can efficiently report the presence of folded nucleic acids.[11] The tricomponent probe makes use of two synthetic dye-free adaptor oligonucleotide strands, strand f and strand m in Figure 1b. Each strand contains a fragment complementary to the MB probe (MB-binding arm) and a fragment complementary to the analyzed nucleic acid (analyte-binding arm). MB-binding arms of the adaptor strands can be designed relatively short in order to prevent their hybridization to the MB probe in the absence of a specific nucleic acid analyte at a given temperature. With 8 or 9 nucleotide arms strands f and m do not efficiently interact with MB probe at room temperature, thus generating low background fluorescence.[13] The analyte-binding arm of strand f can be designed long enough to enable formation of a stable complex with the analyzed sequence. The hybridization of strand f unwinds the analyte secondary structure and opens the access of allele-specific strand m to the SNP site. Strand m possesses a relatively short analyte-binding arm, which forms stable complex only with a perfectly matched analyte. This feature enables excellent recognition specificity making this probe an efficient tool for SNP analysis. The two MB-binding arms, when brought together, cooperatively bind to the MB-probe and increase its fluorescence. Not only this approach results in the extraordinary selectivity of SNP detection, but it also reduces the cost of a multiplex assay, since only one expensive MB probe is needed for the analysis of almost any nucleic acid sequence.
We have recently demonstrated that tricomponent probe can be used for the analysis of practically important mutations in a stem-loop folded DNA fragment that encodes Tau protein.[11] The target contained a 6-nucleotide stem with one additional G-T wobble base pair. It was not clear however what the limitations of the tricomponent probe are. Is it possible to analyze even more stable secondary structures than 6-nucleotide stem by this technique? Does the location of the SNP site affect the probe performance? In the present study we have conducted a systematic investigation of the effect of the stem-loop stability on the probe performance. We demonstrate that a single nucleotide substitutions (SNSs) located in either stem or loop regions can be efficently analyzed by our approach.
Results
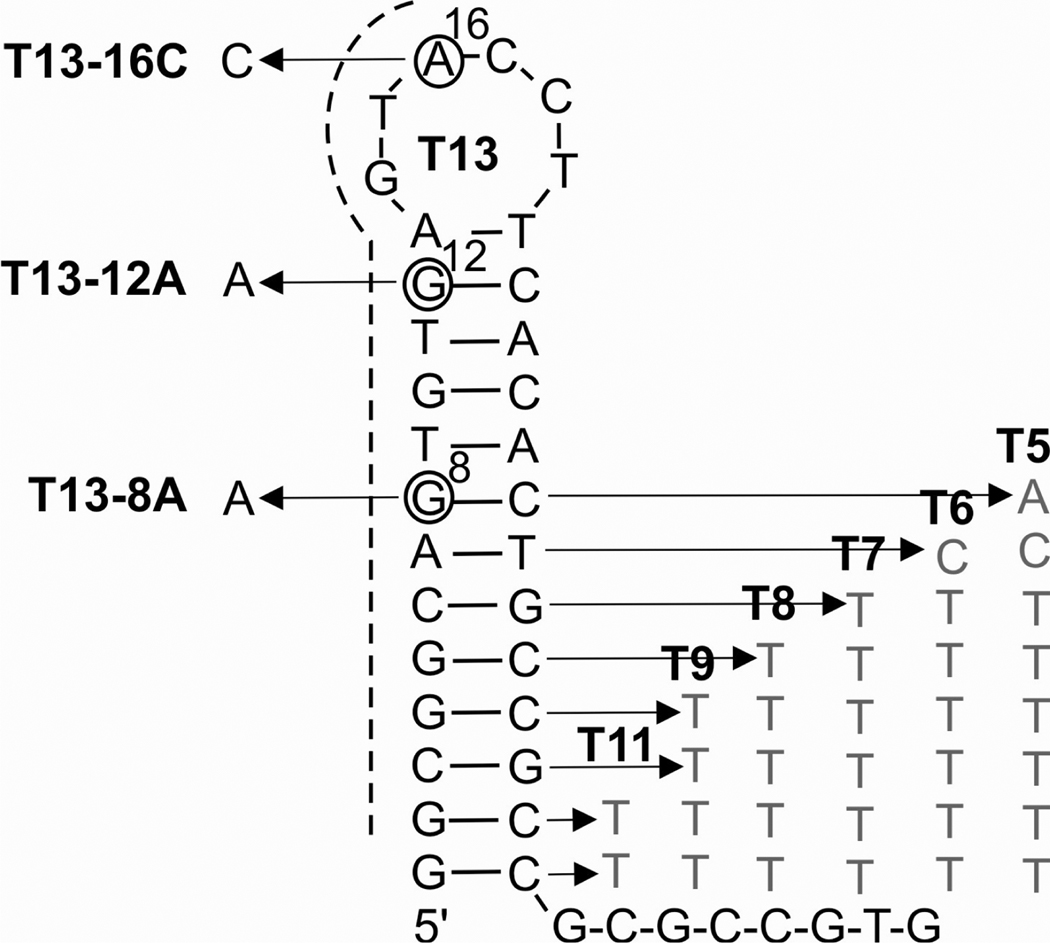
In order to demonstrate the ability of the tricomponent probe to analyze stem-loop folded nucleic acids, a model DNA analyte containing a stable 13-nucleotide G/C-rich stem was designed (Figure 2). The melting temperature of this stem was ~ 88.3°C under the experimental conditions. A series of analytes containing shorter stem regions, T11, T9, T8, T7, T6 and T5, were derived from T13 analyte by introducing appropriate number of nucleotide substitutions at the 3’ portion of the stem, as it is shown in Figure 2 (full sequences of the analytes are listed in Supporting Information, Table S1). To demonstrate the ability of tricomponent probe to analyze SNS at different positions of the hairpin-shaped structure, three single base substituted oligonucleotides, T13-8A, T13-12A and T13-16C, were designed (Figure 2). The oligonucleotides contained substitutions at 8th, 12th or 16th positions of the analyte, which are located in the internal position of the stem, on the edge of the stem or in the loop, respectively.
Figure 2.
The primary and secondary structures of stem-loop folded analytes used in this study. The structure of T13 analyte is shown in black. The three T13 mutants, T13-8A, T13-12A and T13-16C, had single base substitutions at positions 8, 12 and 16 from the 5’ end, respectively. The dashed line indicates nucleotides complementary to MB1 probe (Figure 3a). Grey letters on the right indicate substitutions that shortened the stem in the series of analytes T5–T9, and T11.
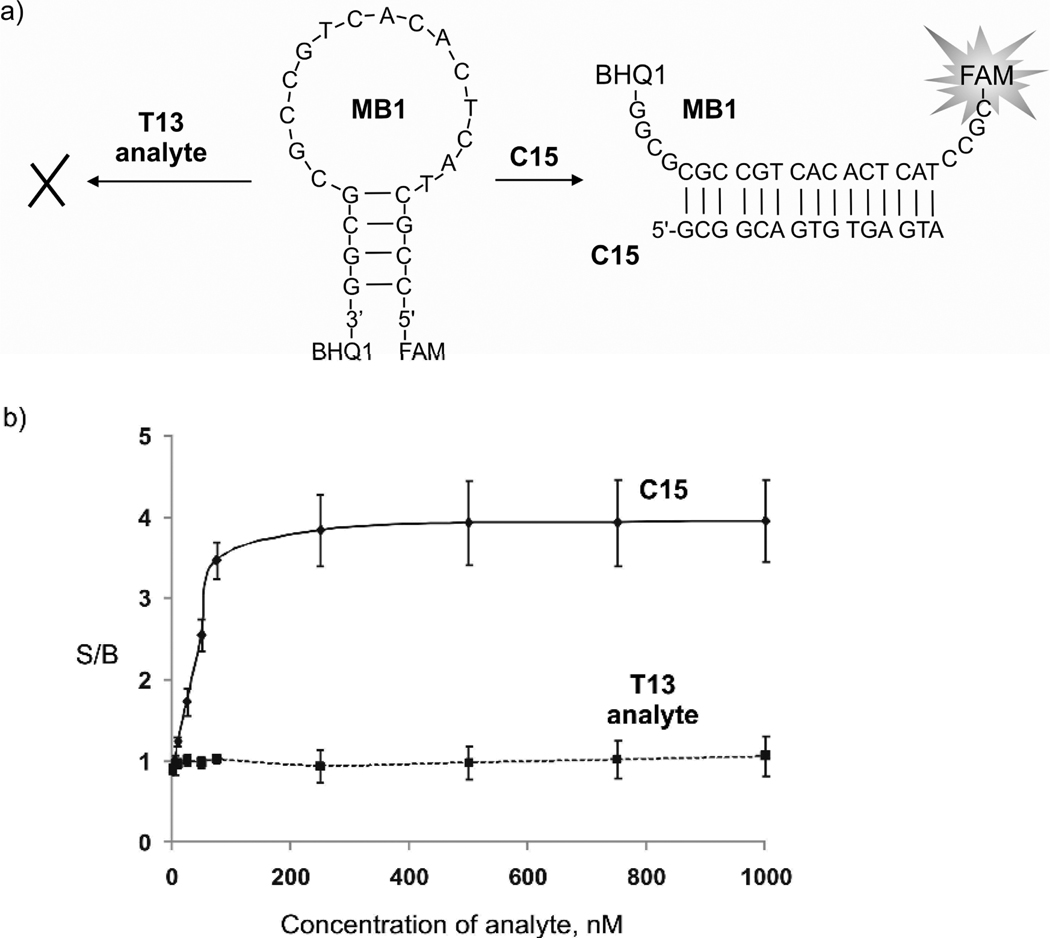
First, we demonstrated that MB probe in its traditional design is inefficient in the analysis of a stem-loop folded DNA. MB1 probe (Figure 3a) was designed to directly hybridize to nucleotides indicated by the dashed line in Figure 2. However, the fluorescence of MB1 remained at the background level even in the presence of 1000 nM T13 (Figure 3b, dashed line). At the same time, concentration-dependent increase in fluorescence of MB1 probe was observed in the presence of linear complementary target C15 (Figure 3b, solid line). These data experimentally prove that, while working well for linear analytes, MB1 probe fails in hybridization to a secondary structure-folded analyte.
Figure 3.
MB probe does not fluorescently report the presence of secondary structure-folded T13 analyte. a) MB1 probe hybridizes directly to a linear complementary target C15, but does not hybridize to the structured analyte T13. b) The signal-to-background ratio (S/B) for the MB1 probe in the presence of different concentrations of C15 and T13 analytes. The data are average values of three independent measurements. Standard deviation bars are shown.
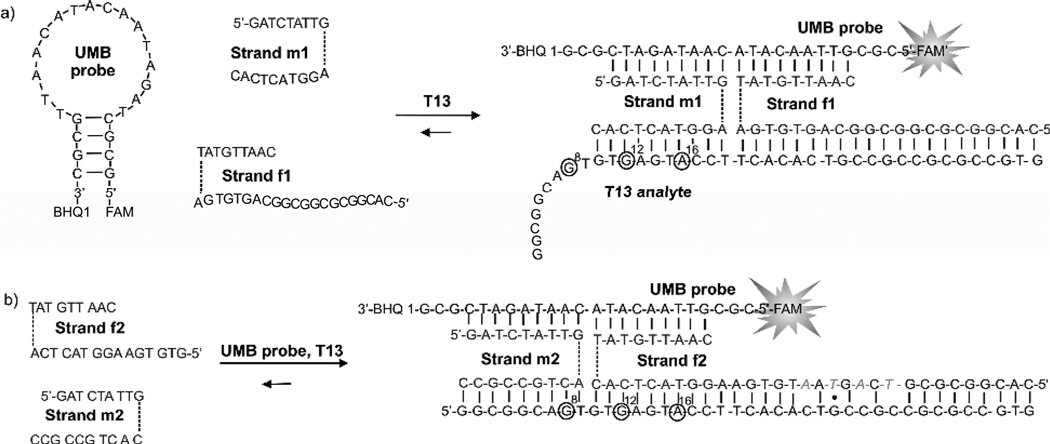
To enable analysis of T13 analyte in real-time, we suggested MB-based tricomponent probe. The approach uses a universal molecular beacon (UMB) probe and a pair of strands m and f (Figure 4a). UMB probe contains A/T-rich loop, which minimizes its interaction with MB-binding arms of strands f and m. A short but stable stem region ensures fast hybridization kinetics along with the efficient quenching in the closed conformation.
Figure 4.
The structure of two tricomponent probes used in this study and their hybridization to T13 analyte. a) Hybridization of the tricomponent probe that is designed to analyze single nucleotide substitutions at 12th and 16th positions. b) Hybridization of the tricomponent probe for the analysis of mutation at position 8. Mismatched nucleotides in strand f2 are in grey italic. Triethylene glycol (TEG) linkers are shown as dashed lines.
In the adaptor strands, the analyte-binding arms were tethered to the MB-binding arms by triethylene glycol (TEG) linkers. The introduction of TEG linkers was essential to obtain the highest fluorescent increase upon formation of the quadripartite complex. When no linkers were used, the analyte-dependent change in fluorescence was significantly lower (data not shown). This observation can be explained by the fact that DNA four-way junctions exist as a mixture of two right-handed antiparallel crosses.[14] In the case of tricomponent probe, only one of these conformers contains an MB probe in elongated form, which allows a substantial fluorescence increase. In general, the ratio between the two conformers depends on the nucleotide composition at the point of strands exchange, which in the case of nucleic acid analysis depends on the analyte sequence. In practice, however, it is important that the MB probe acquires an elongated conformation in the quadripartite associate independently of the analyte sequence. The TEG inserts make strands m and f be bent at the point of the insertions, which allows the MB probe to acquire the desired elongated conformations.
To demonstrate the ability of tricomponent probe to detect hairpin-forming analytes with different stem length, we designed a series of tricomponent probes (Figure 4 and Table S1). Strand m1 was used for the analysis of all seven DNA analytes. However, three different strands f were designed to enable efficient hybridization of the probe with the variable 3’ portion of the DNA analytes. Strand f1 (Figure 4a) was used for the analysis of T13. It had a 21-nucleotide analyte-binding arm fully complementary to the 3’ portion of T13. The long analyte-binding arm of strand f1 hybridized to the 13 base pair stem at room temperature, as was shown by the polyacrylamide gel electrophoresis (Figure S1). Strand f-T5 (Table S1) was used for the analysis of T5, T6 and T7, while strand f-T8 (Table S1) was used in case of T8 and T9. All pairs of adaptor strands had the same sequences for the MB-binding arms.
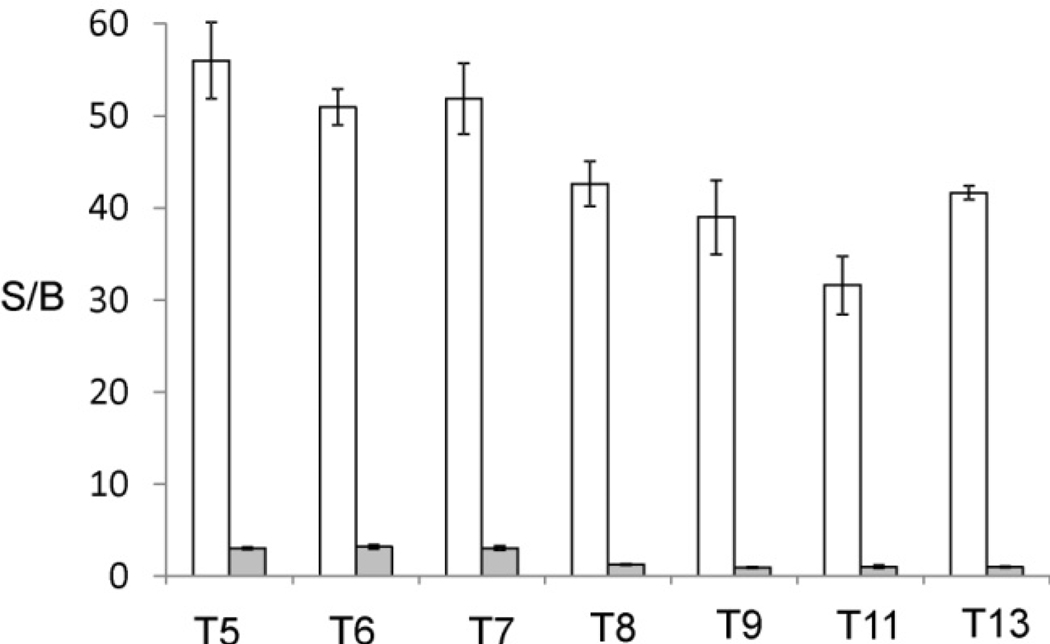
The series of the stem-loop DNAs (T5, T6, T7, T8, T9, T11, and T13) were analysed by the conventional MB approach (MB1 probe) and by the tricomponent probes. The conventional MB1 probe was able to detect only the analytes with relatively short stems (T5, T6, and T7) (Figure 5). Even for these analytes the S/B below 3 was observed, which reflects ineficent formation of the complexes between the analytes and the MB probe. For the analytes with the stems longer than 7 base pairs fluorescent intensities did not exceed the background level (Figure 5, grey bars). Temperature change or increased incubation time did not result in higher fluorescence (data not shown). On the contrary, the tricomponent probes could efficiently detect the presence of all seven analytes with the S/B in the range of 35–55 (Figure 5, white bars). The detection limit of the probe was found to be 0.5–3 nM, depending on the analyte (Figure S2). These values for the detection limit are in the range of that reported for conventional MB approach with linear analytes.[12,13]
Figure 5.
Tricomponent probe is more efficient in the analysis of hairpin-folded nucleic acids than conventional MB probe. Grey bars represent the fluorescent intensities at 517 nm of MB1 probe in the presence of hairpin-folded analytes containing stem region of 5, 6, 7, 8, 9, 11 or 13 base pairs. White bars represent fluorescence intensities at 517 nm for the correspondent tricomponent probe. Fluorescent assay condition: MB1 probe (100 nM) was incubated with DNA analytes T5, T6, T7, T8, T9, T11 or T13 (100 nM each) in the buffer containing Tris-HCl (50 mM), pH 7.4, MgCl2 (2 mM) for 15 minutes at 22°C; UMB probe (50 nM), strand m1 (100 nM), and specific strand f (100 nM) were incubated with DNA analytes T5, T6, T7, T8, T9, T11 or T13 (100 nM) in the buffer containing Tris-HCl (50 mM), pH 7.4, MgCl2 (20 mM) for 15 minutes at 22°C. Strand f-T5 was used to analyze targets T5, T6, and T7. Strand f-T8 was used to analyze targets T8 and T9. Strand f-T11 was used to analyze target T11. Strand f1 was used to analyze target T13.
Next, the ability of the tricomponent probe to discriminate single base substituted targets T-8A, T-12A, T-16C (Figure 2) from the true analyte T13 was investigated. Two tricomponent probes that utilize the same UMB probe but two distinct pairs of adaptor strands were used (Figure 4). Strands m1 and f1 were designed to enable the analysis of mutations at positions 12 and 16 (Figure 4a), while strands m2 and f2 (Figure 4b) were tailored to analyze mutation at position 8. Strand f2 formed a series of base pair mismatches when hybridized to T13 (Figure 4b). The mismatched nucleotides were introduced to eliminate a stretch of nucleotides complementary to the analyte-binding arm of strand m2. It was required to avoid high background fluorescence, which resulted from hybridization of the two adaptor strands to each other and to UMB in the absence of the analyte.
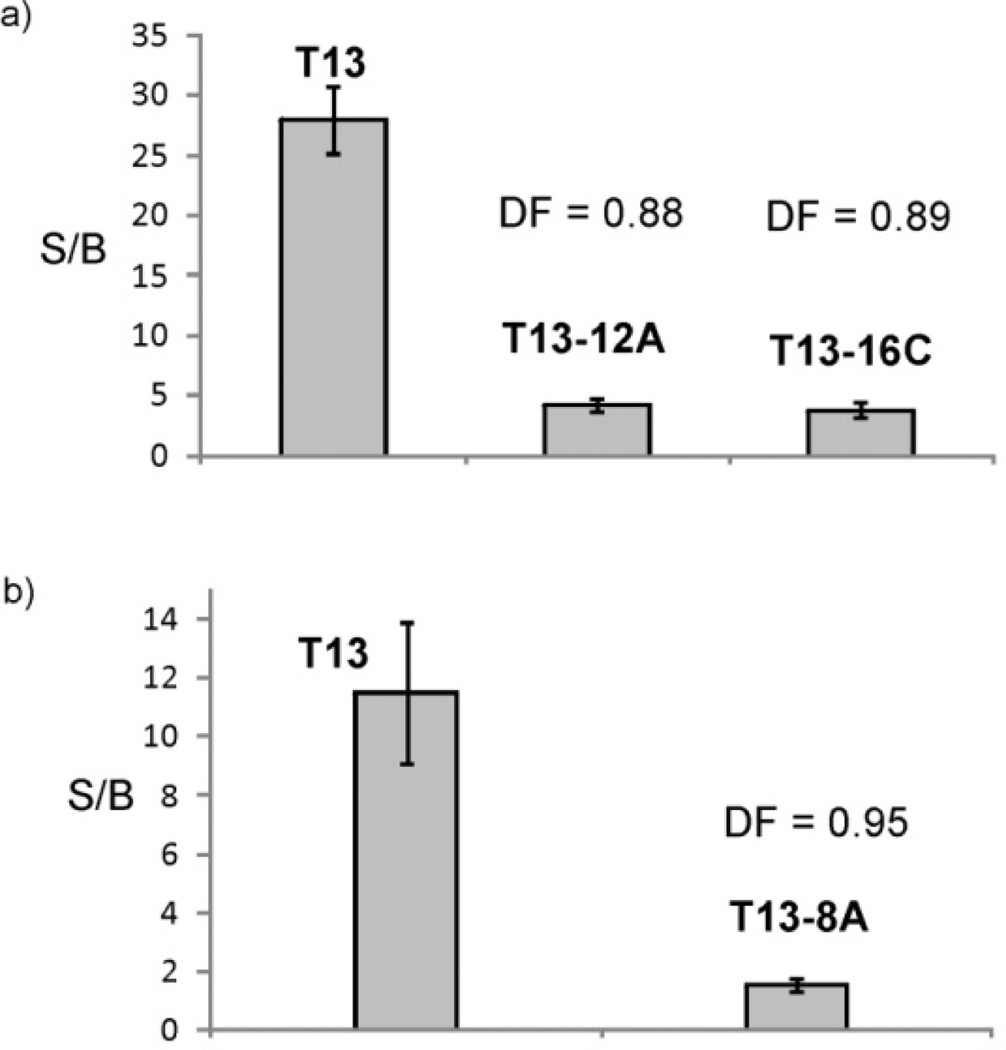
All three single base substitutions were discriminated from the true analyte using the two tricomponent probes. The fluorescent signals for the probe in the presence of T-12A, T-16C and T13-8A analytes were significantly lower than that in the presence of fully complementary T13 (Figure 6). The discrimination factors (DF) are represented in the scale from 0 to 1, where 1 reflects the highest discrimination and 0 indicated no discrimination (see Experimental Section for the formula). The DF were found to be 0.88, 0.89 and 0.95 for T-12A and T-16C, and T13-8A, respectively. This excellent discrimination at room temperature, up to the best of our knowledge, cannot be achieved by other hybridization probes. The ability of the probe to from the quadripartite associate only in the presence of the fully matched analyte was confirmed by polyacrylamide gel electrophoresis (Figure S1). Indeed, the high-molecular weight complex corresponding to the quadripartite associate was observed only in case of the sample containing the fully matched T13. These data demonstrate that the presence of a stem-loop in the analyte does not eliminate the excellent selectivity of the MB-based tricomponent probe, which was demonstrated by us earlier for linear targets.[13]
Figure 6.
Tricomponent probe can detect single base substitutions in folded analytes. a) Signal-to-background ratio for the probe f1/m1 in the presence of the true target T13, and the two mismatched targets T13-12A and T13-16C. b) Signal-to-background ratio for the probe f2/m2 in the presence of the true target and the mismatched T13-8A. The data are average values of three independent measurements. Error bars represent standard deviations from the average.
Discussion
It is of practical interest to detect nucleic acids that are folded in stable secondary structures.[5–9] For example, cellular RNAs are typically folded in stem-loop containing structures with a limited amount of single stranded stretches accessible by a typical hybridization probe.
MB probes are considered as one of the most convenient tools applicable for RNA monitoring in live cells.[15] However, the probe has to be targeted to RNA domains that are available for hybridization, which creates a significant challenge in RNA imaging.[15b] Indeed, in this study we observed the inefficiency of the conventional MB probe in the analysis of stem-loop folded targets. The duplexes between the MB1 probe and the DNA analytes were formed with the efficiency not high enough to detect the presence of the analytes with stems of 8 base pairs and longer since opening of the long stem of the DNA analytes was thermodynamically unfavourable.
In general, the design of MB probe is not as simple in practice as it seems. The hairpin structure should be designed to avoid the stem invasion, in which the stem arm is complementary to a portion of the loop and thus results in the partial opening of the MB probe.[16] As a result, incomplete quenching of the fluorophore leads to high background. Moreover, stem nucleotides of MB probe may be partially complementary to the analyte sequence, which affect the hybridization properties and makes the affinity of the probe to the target less predictable. Therefore, optimization of MB is an important step in the design of a probe for each new analyte, which increases the overall cost of the conventional MB approach. We have demonstrated that a single optimized MB probe can be used for the analysis of multiple targets that form very stable secondary structures.[13b] The design of the UMB probe used in this study is independent of the DNA targets, so only one pre-optimized MB probe is sufficient to analyze many different analytes.
The hairpin structures of the DNA analytes used in this study are very stable under the experimental conditions (22°C) – the melting temperatures of the stems in analytes varied from 52.7°C to 88.3°C. However, the tricomponent probes were able to detect all the analytes with the high S/B ratio. No probe-analyte annealing was required.
The tricomponent probe is able to discriminate single nucleotide substitutions located both in the loop and in the stem positions of a model analyte with high discrimination factors. Excellent discrimination ability of the probes that use a split design (binary probes) has been documented in a number of earlier reports.[17] The challenge of the present study was to demonstrate that single nucleotide substitutions in targets with very stable stem-loop structures can be interrogated. We did encounter an unexpected challenge in probe design. When fully complementary strand f for interrogation of the mutation at 8th position (Figure 4b) was designed, it had a 9 nucleotide stretch complementary to strand m2. The tricomponent probe with complementary adaptor strands generated high fluorescent background due to the association of adaptor strands and MB reporter in a tripartite fluorescent complex even in the absence of the analyte. This challenge was overcome by introducing four base substitutions in the analyte binding arm of strand f (strand f2 lacks extended region that is complementary to strand m2). This design demonstrates the flexibility of tricomponent probe: the introduction of mismatches in strand f does not jeopardize the probe’s performance, since the analyte-binding arm of strand f can be designed long enough to form stable hybrid with the analyte even in the presence of a number of mismatches.
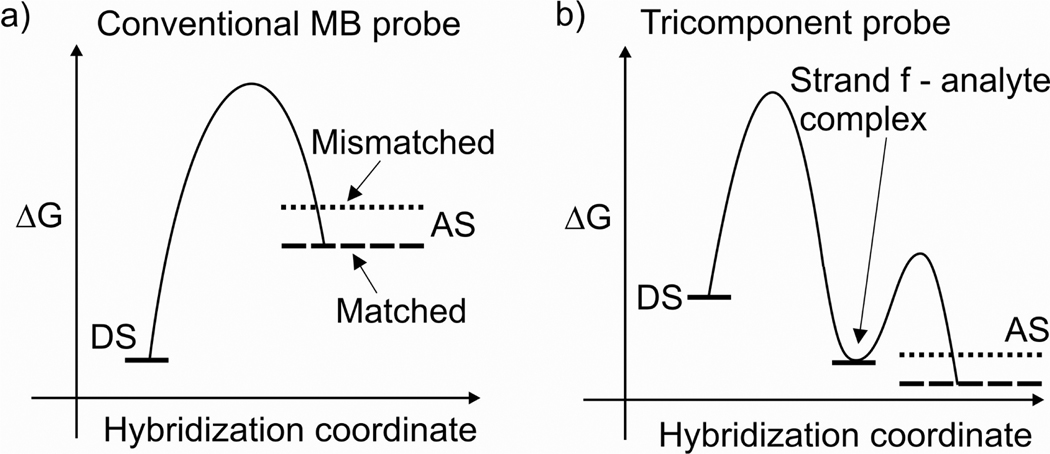
Diagrams in Figure 7 suggest the thermodynamic basis for the observed behaviour of the MB probe and the MB-based tricomponent probe. For the conventional MB probe approach (Figure 7a) the probe–analyte dissociated state (DS) is lower than the MB-analyte associated state (AS). Therefore, MB probe forms stable complex neither with mismatched nor with matched analytes. In the case of tricomponent probe the stable hybrid of strand f with the analyte drive the hybridization process (Figure 7b, local minimum on the curve). The energy of the local minimum is higher than the energy of probe-analyte AS for the fully matched target, but lower than that of the quadripartite complex for the mismatched target (compare relative positions of the dashed and dotted lines in Figure 7b). This disposition of energetic levels provides the basis for excellent discrimination of single base substitutions by the tricomponent probe: at these conditions the full quadripartite complex is formed only with the fully matched probe. The right positioning of the local minimum can be fine-tuned both by varying the concentrations of the adaptor strands and by adjusting the length of analyte-binding arm of strand m.
Figure 7.
Putative energy diagrams for hybridization of probes with stem-loop folded analytes. The red lines indicate the energy level of the mismatched probe-analyte associated state (AS), and the blue lines indicate the energy of AS of the probe complex with the fully matched analyte. a) Hybridization of the conventional MB probe. The dissociated sate (DS) of the system has lower energy than the associated state both for matched and mismatched complexes. Probe does not hybridize to the analyte. b) Hybridization of MB-based tricomponent probe. The minimum on the curve corresponds to the complex of strand f with the analyte. AS in this case corresponds to the quadripartite complex of the tricomponent probe with the analyte.
Conclusion
This study demonstrates the advantages of the MB-based tricomponent probe in the analysis of secondary structure-folded analytes. First, a single universal MB probe is sufficient for the analysis of many analytes, as well as several fragments of one analyte. Second, the structural flexibility of multicomponent probe allows both efficient hybridization to the extended self-complementary fragments of the analyte and the detection of single nucleotide differences between analytes. Importantly, the assay is carried out at room temperature in regular hybridization buffers and is completed in minutes. These properties, taken together with the real-time signal generation offered by the MB probe, might be useful in the detection of natural RNAs in living cells and single-stranded DNAs under mild hybridization conditions.
Experimental Section
All oligonucleotides (Table S1) were custom-made by Integrated DNA Technologies, Inc (Coralville, IA). All chemicals were purchased from Sigma-Aldrich (St. Louis, MO). The melting temperatures of the oligonucleotide were predicted using OligoAnalyzer 3.1 software (IDT).
For the fluorescence assay with MB probe MB1 (100 nM) and an analyte (1–1000 nM) were mixed in a buffer containing Tris-HCl (50 mM), pH 7.4, and MgCl2 (2 mM) and incubated at room temperature (22 °C) for 15 min. For the fluorescence assay with a tricomponent probe, strand m (100 nM), strand f (100 nM), UMB (50 nM), and an analyte (1–100 nM) were mixed in a buffer containing Tris-HCl (50 mM), pH 7.4, and MgCl2 (20 mM) and incubated at room temperature (22 °C) for 15 min. For the analysis of E coli 16S rRNA, the reaction mixture contained strand m16S (100 nM), strand f16S (1000 nM), UMB (50 nM) and rRNA (20 nM). Fluorescence spectra of the samples were recorded on a Perkin-Elmer (San Jose, CA) LS-55 Luminescence Spectrometer with a Hamamatsu xenon lamp (excitation at 485 nm; emission 517 nm). The data of three independent measurements are presented with an error margin of one standard deviation.
The discrimination factors were calculated according to the formula DF= 1-(Fmm-F0)/(Fm-F0), where F0, Fm, and Fmm are fluorescence intensities of the probe in the absence of the analyte, in the presence of fully complementary analyte or in the presence of the analyte containing single nucleotide substitution, respectively.
Supplementary Material
Acknowledgements
This study was supported by NHGRI R21 HG004060 and by UCF College of Science and Chemistry Department. CN was partially funded by an academic scholarship through The Burnett Honors College and the College of Medicine at UCF.
Footnotes
Supporting information for this article is available on the WWW under http://www.chemeurj.org/ or from the author.
References
- 1.a) Zhang H, Parameswaran P, Badalamenti J, Rittmann BE, Krajmalnik-Brown R. Methods Mol. Biol. 2011;733:107–128. doi: 10.1007/978-1-61779-089-8_8. [DOI] [PubMed] [Google Scholar]; b) Smith CJ, Osborn AM. FEMS Microbiol. Ecol. 2009;67:6–20. doi: 10.1111/j.1574-6941.2008.00629.x. [DOI] [PubMed] [Google Scholar]; c) Hou Y, Luo Q, Chen C, Zhou M. Pest. Manag. Sci. 2011 doi: 10.1002/ps.2161. [DOI] [PubMed] [Google Scholar]; d) Mortarino M, Garagiola I, Lotta LA, Siboni SM, Semprini AE, Peyvandi F. Haemophilia. 2011 doi: 10.1111/j.1365-2516.2011.02537.x. [DOI] [PubMed] [Google Scholar]; e) Tong J, Liu C, Summanen P, Xu H, Finegold SM. Anaerobe. 2011 doi: 10.1016/j.anaerobe.2011.03.004. [DOI] [PubMed] [Google Scholar]
- 2.a) Song J, Mooi WJ, Petronic-Rosic V, Shea CR, Stricker T, Krausz T. Adv. Anat. Pathol. 2011;18:229–234. doi: 10.1097/PAP.0b013e3182169b69. [DOI] [PubMed] [Google Scholar]; b) Kumar S, Dagar SS, Mohanty AK, Sirohi SK, Puniya M, Kuhad RC, Sangu KP, Griffith GW, Puniya AK. Naturwissenschaften. 2011 doi: 10.1007/s00114-011-0791-2. [DOI] [PubMed] [Google Scholar]; c) Sotelo-Silveira JR, Calliari A, Kun A, Elizondo V, Canclini L, Sotelo JR. Methods Mol. Biol. 2011;714:125–138. doi: 10.1007/978-1-61779-005-8_8. [DOI] [PubMed] [Google Scholar]; d) Uniacke J, Colón-Ramos D, Zerges W. Methods Mol. Biol. 2011;714:15–29. doi: 10.1007/978-1-61779-005-8_2. [DOI] [PubMed] [Google Scholar]
- 3.a) Huyghe A, Francois P, Schrenzel J. Infect. Genet. Evol. 2009;9:987–995. doi: 10.1016/j.meegid.2008.10.016. [DOI] [PMC free article] [PubMed] [Google Scholar]; b) Barken KB, Haagensen JA, Tolker-Nielsen T. Clin. Chim. Acta. 2007;384:1–11. doi: 10.1016/j.cca.2007.07.004. [DOI] [PubMed] [Google Scholar]; c) Hong-Geller E, Micheva-Viteva SN. Curr. Drug. Discov. Technol. 2010;7:86–94. doi: 10.2174/157016310793180657. [DOI] [PubMed] [Google Scholar]; d) Barker CA, Farha MA, Brown ED. Chem. Biol. 2010;17:624–632. doi: 10.1016/j.chembiol.2010.05.010. [DOI] [PubMed] [Google Scholar]
- 4.a) Browne KA. J. Am. Chem. Soc. 2005;127:1989–1994. doi: 10.1021/ja046369w. [DOI] [PubMed] [Google Scholar]; b) Kim Y, Yang CJ, Tan W. Nucleic Acids Res. 2007;35:7279–7287. doi: 10.1093/nar/gkm771. [DOI] [PMC free article] [PubMed] [Google Scholar]; c) Valencia-Burton M, McCullough RM, Cantor CR, Broude NE. Nat. Methods. 2007;4:421–427. doi: 10.1038/nmeth1023. [DOI] [PubMed] [Google Scholar]; d) Santangelo PJ, Lifland AW, Curt P, Sasaki Y, Bassell GJ, Lindquist ME, Crowe JE., Jr Nat. Methods. 2009;6:347–349. doi: 10.1038/nmeth.1316. [DOI] [PMC free article] [PubMed] [Google Scholar]; e) Park HY, Buxbaum AR, Singer RH. Methods Enzymol. 2010;472:387–406. doi: 10.1016/S0076-6879(10)72003-6. [DOI] [PMC free article] [PubMed] [Google Scholar]
- 5.a) Chandler DP, Newton GJ, Small JA, Daly DS. Appl. Environ. Microbiol. 2003;69:2950–2958. doi: 10.1128/AEM.69.5.2950-2958.2003. [DOI] [PMC free article] [PubMed] [Google Scholar]; b) Lane S, Evermann J, Loge F, Call DR. Biosens. Bioelectron. 2004;20:728–735. doi: 10.1016/j.bios.2004.04.014. [DOI] [PubMed] [Google Scholar]
- 6.a) Tan JC, Patel JJ, Tan A, Blain JC, Albert TJ, Lobo NF, Ferdig MT. Genomics. 2009;93:543–550. doi: 10.1016/j.ygeno.2009.02.007. [DOI] [PMC free article] [PubMed] [Google Scholar]; b) Chen C, Wang W, Wang Z, Wei F, Zhao XS. Nucleic Acids Res. 2007;35:2875–2884. doi: 10.1093/nar/gkm177. [DOI] [PMC free article] [PubMed] [Google Scholar]
- 7.a) Kushon SA, Jordan JP, Seifert JL, Nielsen H, Nielsen PE, Armitage BA. J. Am. Chem. Soc. 2001;123:10805–10813. doi: 10.1021/ja016310e. [DOI] [PubMed] [Google Scholar]; b) Armitage BA. Drug Discov. Today. 2003;8:222–228. doi: 10.1016/s1359-6446(03)02611-4. [DOI] [PubMed] [Google Scholar]; c) Gao Y, Wolf LK, Georgiadis RM. Nucleic Acids Res. 2006;34:3370–3377. doi: 10.1093/nar/gkl422. [DOI] [PMC free article] [PubMed] [Google Scholar]; d) Sekar MM, Bloch W, St John PM. Nucleic Acids Res. 2005;33:366–375. doi: 10.1093/nar/gki163. [DOI] [PMC free article] [PubMed] [Google Scholar]
- 8.Lahoud G, Timoshchuk V, Lebedev A, de Vega M, Salas M, Arar K, Hou YM, Gamper H. Nucleic Acids Res. 2008;36:3409–3419. doi: 10.1093/nar/gkn209. [DOI] [PMC free article] [PubMed] [Google Scholar]
- 9.a) Kierzek E, Ciesielska A, Pasternak K, Mathews DH, Turner DH, Kierzek R. Nucleic Acids Res. 2005;33:5082–5093. doi: 10.1093/nar/gki789. [DOI] [PMC free article] [PubMed] [Google Scholar]; b) Kubota K, Ohashi A, Imachi H, Harada H. Appl. Environ. Microbiol. 2006;72:5311–5317. doi: 10.1128/AEM.03039-05. [DOI] [PMC free article] [PubMed] [Google Scholar]; c) Kuhn H, Demidov VV, Coull JM, Fiandaca MJ, Gildea BD, Frank-Kamenetskii MD. J. Am. Chem. Soc. 2002;124:1097–1103. doi: 10.1021/ja0041324. [DOI] [PubMed] [Google Scholar]; d) Smolina IV, Demidov VV, Soldatenkov VA, Chasovskikh SG, Frank-Kamenetskii MD. Nucleic Acids Res. 2005;33:e146. doi: 10.1093/nar/gni151. [DOI] [PMC free article] [PubMed] [Google Scholar]; e) Smolina IV, Kuhn H, Lee C, Frank-Kamenetskii MD. Bioorg Med Chem. 2008;16:84–93. doi: 10.1016/j.bmc.2007.04.063. [DOI] [PubMed] [Google Scholar]; f) Wilks SA, Keevil CW. Appl. Environ. Microbiol. 2006;72:5453–5462. doi: 10.1128/AEM.02918-05. [DOI] [PMC free article] [PubMed] [Google Scholar]
- 10.Demidov VV, Frank-Kamenetskii MD. Trends Biochem. Sci. 2004;29:62–71. doi: 10.1016/j.tibs.2003.12.007. [DOI] [PubMed] [Google Scholar]
- 11.Grimes J, Gerasimova YV, Kolpashchikov DM. Angew. Chem. 2010;122:9134–9137. doi: 10.1002/anie.201004475. [DOI] [PMC free article] [PubMed] [Google Scholar]; Angew. Chem. Int. Ed. 2010;49:8950–8953. doi: 10.1002/anie.201004475. [DOI] [PMC free article] [PubMed] [Google Scholar]
- 12.a) Marras SA, Tyagi S, Kramer FR. Clin. Chim. Acta. 2006;363:48–60. doi: 10.1016/j.cccn.2005.04.037. [DOI] [PubMed] [Google Scholar]; b) Wang K, Tang Z, Yang CJ, Kim Y, Fang X, Li W, Wu Y, Medley CD, Cao Z, Li J, Colon P, Lin H, Tan W. Angew. Chem. 2009;121:870–885. doi: 10.1002/anie.200800370. [DOI] [PMC free article] [PubMed] [Google Scholar]; Angew. Chem. Int. Ed. Engl. 2009;48:856–870. doi: 10.1002/anie.200800370. [DOI] [PMC free article] [PubMed] [Google Scholar]; c) Li Y, Zhou X, Ye D. Biochem. Biophys. Res. Commun. 2008;373:457–461. doi: 10.1016/j.bbrc.2008.05.038. [DOI] [PubMed] [Google Scholar]; d) Venkatesan N, Seo YJ, Kim BH. Chem. Soc. Rev. 2008;37:648–663. doi: 10.1039/b705468h. [DOI] [PubMed] [Google Scholar]
- 13.a) Kolpashchikov DM. J. Am. Chem. Soc. 2006;128:10625–10628. doi: 10.1021/ja0628093. [DOI] [PubMed] [Google Scholar]; b) Gerasimova YV, Hayson A, Ballantyne J, Kolpashchikov DM. Chembiochem. 2010;11:1762–1768. doi: 10.1002/cbic.201000287. [DOI] [PMC free article] [PubMed] [Google Scholar]; c) Gerasimova YV, Peck S, Kolpashchikov DM. Chem. Commun. 2010;46:8761–8763. doi: 10.1039/c0cc03248d. [DOI] [PMC free article] [PubMed] [Google Scholar]
- 14.a) Churchill ME, Tullius TD, Kallenbach NR, Seeman NC. Proc. Natl. Acad. Sci. USA. 1988;85:4653–4656. doi: 10.1073/pnas.85.13.4653. [DOI] [PMC free article] [PubMed] [Google Scholar]; b) Lilley DMJ. Q. Rev. Biophys. 2000;33:109–159. doi: 10.1017/s0033583500003590. [DOI] [PubMed] [Google Scholar]
- 15.a) Bao G, Rhee WJ, Tsourkas A. Annu. Rev. Biomed. Eng. 2009;11:25–47. doi: 10.1146/annurev-bioeng-061008-124920. [DOI] [PMC free article] [PubMed] [Google Scholar]; b) Tyagi S. Nat. Methods. 2009;6:331–338. doi: 10.1038/nmeth.1321. [DOI] [PubMed] [Google Scholar]
- 16.a) Browne KA. J. Am. Chem. Soc. 2005;127:1989–1994. doi: 10.1021/ja046369w. [DOI] [PubMed] [Google Scholar]; b) Kim Y, Yang CJ, Tan W. Nucleic Acids Res. 2007;35:7279–7287. doi: 10.1093/nar/gkm771. [DOI] [PMC free article] [PubMed] [Google Scholar]
- 17.a) Kolpashchikov DM. Chem. Rev. 2010;110:4709–4723. doi: 10.1021/cr900323b. [DOI] [PubMed] [Google Scholar]; b) Cardullo RA, Agrawal S, Flores C, Zamecnik PC, Wolf DE. Proc. Natl. Acad. Sci. USA. 1988;85:8790–8794. doi: 10.1073/pnas.85.23.8790. [DOI] [PMC free article] [PubMed] [Google Scholar]; c) Mergny JL, Boutorine AS, Garestier T, Belloc F, Rougée M, Bulychev NV, Koshkin AA, Bourson J, Lebedev AV, Valeur B, Thuong NT, Helene C. Nucleic Acids Res. 1994;22:920–928. doi: 10.1093/nar/22.6.920. [DOI] [PMC free article] [PubMed] [Google Scholar]; d) Oser A, Valet G. Angew. Chem. Int. Ed. Engl. 1990;29:1167–1169. [Google Scholar]; e) Ebata K, Masuko M, Ohtani H, Kashiwasake-Jibu M. Photochem Photobiol. 1995;62:836–839. doi: 10.1111/j.1751-1097.1995.tb09144.x. [DOI] [PubMed] [Google Scholar]; f) Silverman AP, Kool ET. Chem. Rev. 2006;106:3775–3789. doi: 10.1021/cr050057+. [DOI] [PubMed] [Google Scholar]; g) Kolpashchikov DM. J. Am. Chem. Soc. 2005;127:12442–12443. doi: 10.1021/ja0529788. [DOI] [PubMed] [Google Scholar]; h) Kolpashchikov DM. ChemBioChem. 2007;8:2039–2042. doi: 10.1002/cbic.200700384. [DOI] [PMC free article] [PubMed] [Google Scholar]; i) Kolpashchikov DM. J. Am. Chem. Soc. 2008;130:2934–2935. doi: 10.1021/ja711192e. [DOI] [PMC free article] [PubMed] [Google Scholar]; j) Gerasimova YV, Cornett E, Kolpashchikov DM. ChemBioChem. 2010;11:811–817. doi: 10.1002/cbic.201000006. [DOI] [PMC free article] [PubMed] [Google Scholar]; k) Mokany E, Bone SM, Young PE, Doan TB, Todd AV. J. Am. Chem. Soc. 2010;132:1051–1059. doi: 10.1021/ja9076777. [DOI] [PMC free article] [PubMed] [Google Scholar]; l) Taniguchi Y, Nitta A, Park SM, Kohara A, Uzu T, Sasaki S. Bioorg. Med. Chem. 2010;18:8614–8167. doi: 10.1016/j.bmc.2010.10.007. [DOI] [PubMed] [Google Scholar]; m) Darius AK, Ling NJ, Mahesh U. Mol. Biosyst. 2010;6:792–794. doi: 10.1039/c001923b. [DOI] [PubMed] [Google Scholar]; n) Ren JT, Qin HX, Wang JH, Luedtke NW, Wang EK, Wang J. Anal. Bioanal. Chem. 2011;399:2763–2770. doi: 10.1007/s00216-011-4669-0. [DOI] [PubMed] [Google Scholar]
Associated Data
This section collects any data citations, data availability statements, or supplementary materials included in this article.


