

Abstract
Background. To investigate the potential immunostimulatory effect of interleukin (IL) 2 as a human immunodeficiency virus type 1 (HIV-1) vaccine adjuvant, we conducted a study of a plasmid coding for a fusion protein of IL-2 and immunoglobulin (IL-2/Ig).
Methods. This phase I trial evaluated an HIV-1 DNA vaccine with the plasmid cytokine adjuvant (IL-2/Ig) in 70 HIV-negative adults. Subjects received placebo (group C), adjuvant alone (group A), vaccine alone (group D), increasing doses of adjuvant concurrent with vaccine (groups T1–T4), or adjuvant given 2 days after vaccine (group T5).
Results. No significant differences in adverse events were observed between treatment groups. Cellular immune responses to envelope protein EnvA peptides were detected by interferon (IFN) γ and IL-2 enzyme-linked immunospot (ELISPOT) assays in 50% and 40% of subjects, respectively, in T4, and in 100% and 80% in T5. The median responses for groups T4 and T5, respectively, were 90 and 193 spot-forming cells (SFCs)/106 peripheral blood mononuclear cells (P = .004; T4 vs T5) for the IL-2 ELISPOT assay and 103 and 380 SFCs/106 PBMCs (P = .003; T4 vs T5) for the IFN-γ ELISPOT assay. A trend to more durable cellular immune responses in T5 was observed at 1 year (T5 vs T4/D; P = .07). Higher anti-Env antibody responses were detected with T5 than with T4.
Conclusions. Plasmid IL-2/Ig significantly increased immune responses when administered 2 days after the DNA vaccine, compared with simultaneous administration. These observations have important implications for the development of cytokine augmentation strategies.
Clinical Trials Registration. NCT00069030.
The development of a safe and effective vaccine against human immunodeficiency virus type 1 (HIV-1) is a major goal of biomedical research and public health efforts [1–5]. The precise immune responses that might provide protection against HIV infection remain undefined, and multiple approaches to vaccination against HIV-1 have therefore been studied [6–8]. Evidence suggests that virus-specific cytotoxic T lymphocyte CD8+ responses are particularly important for control of HIV-1 replication in humans [9, 10] and simian immunodeficiency virus (SIV) infection in nonhuman primates [11–13]. In addition, virus-specific CD4+ T cell responses have also been associated with control of HIV-1 viremia [14].
One approach to developing a vaccine against HIV-1 has been to use plasmid DNA that encodes HIV antigens and stimulates T-cell and antibody responses in mice and nonhuman primates and humans [3, 15–19]. This approach has been safe and partially efficacious, and coadministration of plasmid-encoded immunomodulator molecules has been used to improve DNA vaccine–elicited HIV-specific cellular immune responses in mice [20].
Interleukin (IL) 2 has been evaluated as a potential adjuvant to augment immune responses in HIV infection and as a potential antitumor agent. Given its short half-life, large systemic doses of IL-2 have been used in clinical studies [21–23]. However, the in vitro half-life of IL-2 can be prolonged by fusion of IL-2 with the Fc protein of immunoglobulin G (IgG) 2 and still retain IL-2 activity. The IL-2–immunoglobulin (IL-2/Ig) fusion protein has been shown to be significantly more effective than IL-2 alone in augmenting immune responses to HIV-1 gp120 plasmid DNA in mice [24]. Augmented immune responses have also been observed with use of a plasmid DNA coding IL-2/Ig. However, these data suggested that the timing of cytokine administration may be an important variable, because the highest immune responses were seen when plasmid IL-2/Ig was administered 2 days after the HIV-1 gp120 plasmid DNA vaccine, rather than concurrently with the vaccine. A subsequent study in rhesus monkeys showed that administration of plasmid IL-2/Ig was more effective than administration of IL-2/Ig protein in augmentation of immune responses to SIV DNA vaccine [25]. Vaccination of rhesus monkeys with DNA vaccines expressing SIVmac239 gag and SHIV-89.6P env, along with either plasmid IL-2/Ig (given 48 hours after DNA vaccination) or IL-2/Ig protein, and subsequently challenge with SHIV-89.6P, resulted in a low to undetectable viral load set point and lack of clinical disease [13]. These findings provided the rationale and guidance for the experimental design of the clinical trial that we conducted.
The clinical study was designed as a randomized, double-blind, placebo-controlled dose escalation phase I trial to determine the safety, tolerability, and immunogenicity of an HIV-1 DNA vaccine [3] administered with plasmid IL-2/Ig to HIV-1–uninfected healthy adults. The regimen of the maximum tolerated dose of plasmid IL-2/Ig administered simultaneously with the plasmid HIV-1 vaccine, was then compared with the regimen of IL-2/Ig administered 48 hours after the HIV-1 DNA vaccine.
METHODS
Participants and Study Design
The study was a multicenter, randomized, double-blind, placebo-controlled trial to evaluate the safety and immunogenicity of VRC-HIVDNA009-00-VP (DNA vaccine; Gag-Pol-Nef–multiclade Env) alone and in combination with escalating doses of VRC-ADJDNA004-IL2-VP (IL-2/Ig adjuvant) in 70 healthy HIV-negative volunteers. This study was conducted by the HIV Vaccine Trials Network (HVTN) at 7 clinical sites. The protocol was approved by the institutional review boards of all participating centers. Written informed consent was obtained from each subject before participation. This study was registered at ClinicalTrials.gov (NCT00069030).
The study schema is presented in Table 1. Groups T1–T4 received both the DNA vaccine (4.0 mg) and IL-2/Ig at doses of 0.1 (group T1), 0.5 (group T2), 1.5 (group T3), or 4.0 (group T4) mg in a dose-escalated design to determine the maximum tolerated dose for IL-2/Ig, because this was the first use of IL-2/Ig in humans. Group T5 received 4.0 mg of the DNA vaccine followed by sequential (48 hours later) administration of the maximum tolerated dose (4.0 mg) of IL-2/Ig. A safety review was performed when an IL-2/Ig dose tier was completed before proceeding to the next dose tier. Study preparations were administered under a double-blind allocation, with participants allocated to vaccine plus adjuvant (groups T1–T5 groups), vaccine alone (group D), adjuvant alone (groups A1–A5, with dose escalation as in groups T1–T5), or saline control (group C).
Table 1.
Schema for Administration of Study Products
| Dose, mg |
|||
| Regimen Group | Vaccine Recipients/Controls, No.a | DNA Vaccine | Plasmid IL-2/Igb |
| T1 | 5/6 | 4 | 0.1 |
| T2 | 5/6 | 4 | 0.5 |
| T3 | 10/6 | 4 | 1.5 |
| T4 | 10/6 | 4 | 4 |
| T5 | 10/6 | 4 | 4 |
| Total | 40/30 | … | … |
Each group included 6 control subjects: 2 receiving only phosphate-buffered saline only (group C), 2 receiving only the DNA vaccine (group D), and 2 receiving only the adjuvant (plasmid coding for the fusion protein of interleukin 2 and immunoglobulin [IL-2/Ig]) (groups A1–A5, with doses corresponding to those for groups T1–T5). The 10 subjects per group who received placebo or plasmid IL-2/Ig only (across the 5 groups) were pooled for analysis.
IL-2/Ig was administered simultaneously with the DNA vaccine in groups T1–T4 and 48 hours after the DNA vaccine in group T5.
Participants received vaccinations at 4 time points (0, 1, 2, and 6 months). All vaccinations were injected intramuscularly into the deltoid muscles with the Biojector 2000 Biojector Needle-Free Injection System (Bioject). Subjects were evaluated in the clinic on day 2 after each vaccination. Additional safety monitoring included assessments of a diary card for 72 hours after each vaccination; PHQ-9 screen for depression; renal function, creatine phosphokinase, hematology, chemistry, double-stranded DNA, and liver function tests; and assays for the development of anti-IL-2 antibodies. The presence of anti–IL-2 antibodies in fresh serum was assessed by validated enzyme-linked immunosorbent assay (ELISA), performed as described elsewhere [4], and results were reported within 1 week of blood sampling. Reactogenicity and adverse events were graded based on the HVTN Table for Grading Severity of Adverse Experiences (http://rsc.tech-res.com/Document/safetyandpharmacovigilance/Table_For_Grading_Severity_of Adult_Pediatric_Adverse_Events.doc). Blood samples for assessment of immunogenicity were collected at days 42 (2 weeks after second vaccination), 70 (2 weeks after third vaccination), 182 (2 weeks after fourth vaccination), 273, 364, and 546.
Vaccine and Adjuvant
Vaccine
VRC-HIVDNA009-00-VP (DNA vaccine) was composed of 4 closed circular plasmid DNA macromolecules [3]. Plasmid VRC-4306 expressed HIV-1 Gag/Pol/Nef polyproteins from clade B (50% by weight). Plasmids VRC-5305, VRC-2805, and VRC-5309 expressed HIV-1 envelope (Env) glycoprotein from clades A, B, and C, respectively (each plasmid is 16.7% by weight of the vaccine).
Adjuvant
The adjuvant VRC-ADJDNA004-IL-2-VP (IL-2/Ig) consisted of plasmid VRC-7000 (pVR1012 (x/s) hIL2Ig), which encoded the human IL-2/Ig fusion protein. The IL-2 was the exact native sequence without mutations. The Fc portion of IgG was incorporated to increase the avidity and serum half-life of IL-2. The IL-2/Ig fusion gene consisted of native human IL-2 fused to the Fc portion of IgG2 and has been described elsewhere [13]. It has IL-2 functional activity, divalent avidity, and a longer in vivo half-life than native IL-2. The IgG2 isotype was chosen because of its limited capacity to facilitate antibody-dependent cell-mediated cytotoxicity and complement fixation.
Control Preparation
Phosphate-buffered saline (PBS) was used as the control for both the vaccine and the adjuvant.
Laboratory Studies
Enzyme-Linked Immunospot Assays Performed on Fresh Cells
HIV-1–specific cellular immune responses were assessed by interferon (IFN) γ enzyme-linked immunospot (ELISPOT) assays, as described elsewhere [13, 25]. For each well, 200000 peripheral blood mononuclear cells (PBMCs) were plated. Overlapping 15 amino acid peptides spanning the homologous Env clade A, B, and C, Gag clade B, Pol clade B, and Nef clade B proteins were obtained from the Vaccine Research Center at the National Institutes of Health. Responses were calculated as spot-forming cells (SFCs) per 106 PBMCs. The criteria for positivity were >55 SFCs/106 PBMCs and >4 times background [26, 27].
Intracellular Cytokine Staining Assays Performed on Cryopreserved Cells
Intracellular cytokine staining (ICS) assays were performed with flow cytometry, using previously cryopreserved PBMCs to determine both HIV-specific CD4+ and CD8+ T-cell responses. The peptide sequences used were designed to incorporate the most frequent HIV 10-mers from the Los Alamos National Laboratory online database (http://www.hiv.lanl.gov/content/sequence/HIV/mainpage.html). Nine global potential T-cell epitope peptide pools encompassing 1407 total peptides were used (3 pools each for Pol potential T-cell epitopes and Env potential T-cell epitopes, 2 for Gag potential T-cell epitopes, and 1 for Nef potential T-cell epitopes peptides) [28–30]. The potential T-cell epitopes peptide pools are not specifically matched to the sequence of the vaccine antigens. The following gating strategy was used: we first gated on the singlicate (FSC-A vs FSC-H), followed by the living cells (FSC-A vs AVID), the lymphocytes (FSC-A vs SSC-A), and the CD3+ cells (CD3+ vs CD8+). After that, among the CD3+ cells, we gated for either CD4+ or CD8+ cells and looked at IL-2 or TNF-α versus IFN-γ.
ELISA Panel for HIV-1–Binding Antibodies
A standardized HIV-1–binding antibody multiplex assay [31] was used to measure binding antibody responses against HIV-1 envelopes: A1.con.env03.140 CF (consensus clade A envelope gp140 with deletions in the gp41 cleavage site and fusion domain [CF]), B.con.env03.140 CF (consensus clade B envelope gp140), C.con.env03.140 CF (consensus clade C envelope gp140), Con S gp140 CFI (a group M consensus Env gp140 with deletions in the gp41 cleavage site, fusion domain, and immunodominant region [CFI]), Con6 gp120/B (an artificial group M consensus envelope gp120 d) were purified from the culture supernatant of 293T cells infected with recombinant viruses expressing these Env genes, using methods described elsewhere [32] and p24 Gag (Protein Sciences). Serum HIV-1–specific IgG responses (1:50 dilution) against these proteins were measured on a Bio-Plex instrument (Bio-Rad). HIVIG, polyclonal IgG from HIV-1–infected subjects, was used as a positive control with a 10-point standard curve in each assay to determine equivalent antibody concentrations for each antigen.
Statistical Methods
The statistical analysis employed an intent-to-treat (ITT) principle; that is, all data from enrolled participants were used according to the initial randomization assignment, regardless of how many injections they received. A bootstrap procedure-based test adjusted for multiple peptide pools was used to determine the positivity of an ELISPOT assay response to a specific peptide pool [33]. One-sided Fisher exact tests adjusted for multiple peptide pools were used to determine the positivity of an ICS assay response to a specific peptide pool [30]. Neutralizing antibody assay response to an isolate is considered positive if the titer is ≥25. Binding antibody responses are considered positive if the mean fluorescence intensity (MFI) minus blank values are ≥732 MFI and both the MFI and the MFI minus blank values are >3 times the baseline (day 0) values.
Two-sided 95% confidence intervals (CIs) for the response rates were calculated using the score test method of Agresti and Coull [34]. Differences in immunogenicity response rates and magnitudes were tested with 2-sided Fisher exact tests and Wilcoxon rank sum tests, respectively. For comparison of the response rates between treatment groups, differences were considered significant if the 2-sided 95% CI for the difference in response rates between the 2 groups excluded 0. The magnitude of the T-cell immune response was calculated by summing across the maximum responses for each potential T-cell epitope peptide pool for each protein. All reported P values were not subject to multiple-group comparison adjustment. All analyses were performed using SAS (versions 9.1.3 and 9.2) and/or R (versions 2.7 and 2.12.1) statistical software.
RESULTS
Of the 70 subjects enrolled in this study, 67% were male; 51% were white, 37% African American or multiracial, and 7% Latino/Latina; and 60% were ≤30 years of age (age range, 18–40 years). All 70 volunteers received the first vaccination, 96% received the second, 87% received the third, and 70% received all 4 vaccinations. The primary reasons for discontinuation of vaccination were adverse experiences (n = 10), largely thought to be unrelated to vaccines, and inability to receive vaccination at the scheduled time (n = 9), largely as a result of safety pauses that were ultimately deemed to be unrelated to the study product.
Safety and Tolerability
Overall, both vaccine and IL-2/Ig were well tolerated. The most common symptoms associated with vaccination were mild pain and/or tenderness, experienced in 70% of subjects (Figure 1A and 1B). Overall systemic symptoms associated with vaccination were either absent or mild in >80% of subjects. Only 2 episodes of greater than moderate systemic reactogenicity were reported, including 1 episode each of malaise/fatigue in group T1 and nausea in group T5. Ten subjects (15%) had a temperature between 37.7°C and 38.6°C after a vaccination, and the remainder of subjects were afebrile after vaccination. No significant differences in local or systemic reactogenicity were noted among groups (Figure 1A and 1B). Fourteen serious adverse events (SAEs) were reported by 10 study volunteers; 13 were considered definitely or probably unrelated to the study preparation, and only 1 was deemed probably related (severe malaise in a subject in group T1). No significant differences in laboratory parameters were noted among groups. Anti–IL-2 antibodies were not detected.
Figure 1.


Safety assessment, showing maximum local reactogenicity (A) and maximum system reactogenicity (B) by treatment group. Subjects in group A received only the plasmid coding for the fusion protein of interleukin 2 and immunoglobulin (IL-2/Ig) (0.1–4 mg); those in C, phosphate-buffered saline (PBS); those in D, human immunodeficiency virus (HIV) DNA vaccine alone; and those in groups T1–T5, the HIV DNA vaccine and escalating doses of IL-2/Ig simultaneously with or, in group T5, 48 hours after the HIV DNA vaccine. HVTN, HIV Vaccine Trials Network.
Immunogenicity
Because only 70% of subjects received all 4 vaccinations, the primary immunogenicity analyses were directed to responses after the third vaccination by an ITT analysis. Groups T1–T3 were designed to allow rapid dose escalation of the IL-2/Ig plasmid to the target (maximum tolerated) dose of 4 mg in groups T4 and T5 and therefore to test the central question of the effect of the delay of administration of IL-2/Ig on immune responses.
HIV-1 T-Cell Responses
Response rates in fresh cells to homologous EnvA peptides matched to the vaccine antigen by IFN-γ and IL-2 ELISPOT assays were 80% and 40%, respectively, in group D, 50% and 40% in T4, and 100% and 80% in T5 (Table 2). The median responses to EnvA peptides for the IFN-γ assay were 5, 127, 103, and 380 SFCs/106 PBMCs for groups C, D, T4, and T5, respectively (P < .0001 for C vs D, P = .11 for D vs T5, and P = .003 for T4 vs T5). The median responses for the IL-2 assay were 5, 32, 90, and 193 for groups C, D, T4, and T5 (P = .006 for C vs D, .131 for D vs T5, and .004 for T4 vs T5) (Figure 2A and 2B). A similar response pattern was seen with EnvB. This difference in response rates was greatest for EnvC (Figure 2A and 2B), with significantly higher median response rates observed in the T5 group with the IFN-γ assay (4, 83, 55, and 355 SFCs/106 PBMCs for groups C, D, T4, and T5 [P < .0001 for C vs D, P = .038 for D vs T5, and P = .001 for T4 vs T5]) and the IL-2 assay (0, 37, 26, and 116 SFCs/106 PBMCs for groups C, D, T4, and T5 [P = .006 for C vs D, .112 for D vs T5, and .003 for T4 vs T5]). Almost no responses were identified to Gag, Pol, or Nef, consistent with findings of other studies using this DNA vaccine [3, 35].
Table 2.
Rates of Response to Homologous EnvA Peptides Measured by IL-2 and IFN-γ ELISPOT in Fresh PBMCs on Day 70
| IFN-γ ELISPOT assay |
IL-2 ELISPOT assay |
|||
| Group | Response rate, No. (%; 95% CI) | Median response (IQR), SFCs × 106 PBMCs | Response rate, No. (%; 95% CI) | Median response (IQR), SFCs × 106 PBMCs) |
| C | 0/19 (0; 0–17.6) | 5 (−2 to 28) | 0/19 (0; 0–17.6) | 5 (−2 to 28) |
| D | 8/10 (80; 44.4–97.5) | 127 (60–605) | 4/10 (40; 12.2–73.8) | 32 (11–358) |
| T1 | 4/5 (80; 28.4–99.5) | 2/5 (40; 5.3–85.3) | ||
| T2 | 4/5 (80; 28.4–99.5) | 2/5 (40; 5.3–85.3) | ||
| T3 | 6/9 (67; 29.9–92.5) | 4/9 (44; 13.7–78.8) | ||
| T4 | 5/10 (50; 18.7–81.3) | 103 (38–195) | 4/10 (40; 12.2–73.8) | 90 (10–128) |
| T5 | 10/10 (100; 69.2–100) | 380 (202–645) | 8/10 (80; 44.4–97.5) | 193 (135–211) |
Subjects in group C received only phosphate-buffered saline or the plasmid coding for the fusion protein of interleukin 2 and immunoglobulin (IL-2/Ig), those in group D received only the human immunodeficiency virus (HIV) DNA vaccine, those in T1–T4 received the HIV DNA vaccine simultaneously with escalating doses of IL-2/Ig (0.1, 0.5, 1.5, and 4 mg, respectively, for groups T1, T2, T3, and T4), and those in group T5 received IL-2/Ig 48 hours after the HIV DNA vaccine. Abbreviations: CI, confidence interval; ELISPOT, enzyme-linked immunospot; IFN, interferon; IL, interleukin; IQR, interquartile range; PBMCs, peripheral blood mononuclear cells; SFCs, spot-forming cells.
Figure 2.
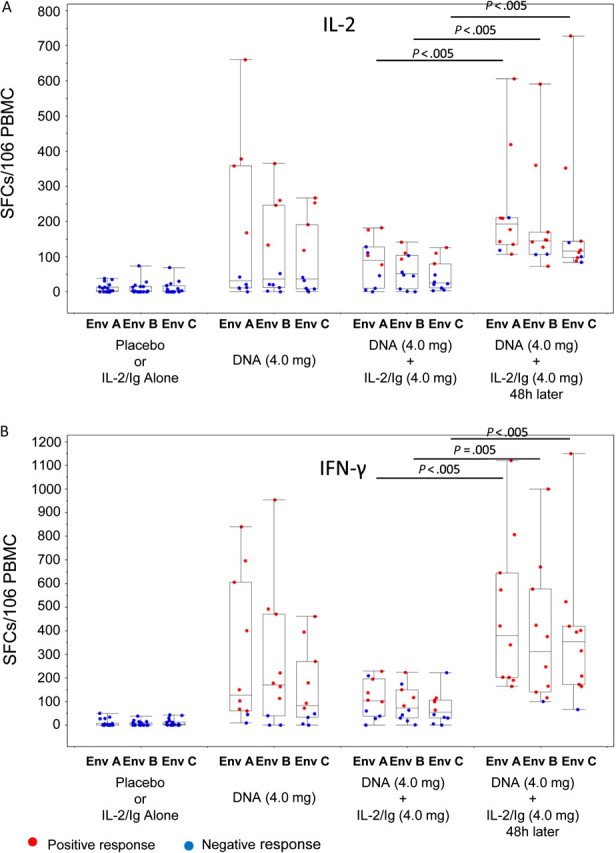
Magnitude of T cells secreting interleukin (IL) 2 (A) and interferon (IFN) γ (B) measured by enzyme-linked immunospot assay in the treatment groups. Studies were performed on fresh peripheral blood mononuclear cells (PBMCs) obtained on day 70 after 3 immunizations, and responses are shown to vaccine-matched EnvA, EnvB, and EnvC peptide antigens. Boxes indicate medians and interquartile ranges; whiskers extend to 1.5 times the interquartile range from the upper or lower quartile. SFCs, spot-forming cells.
A similar response pattern, though with lower response rates, was seen in ICS assays performed on cryopreserved cells. As measured by the IFN- γ/IL-2 ICS assay on cryopreserved cells using global potential T-cell epitope vaccine-unmatched peptides, the rates of CD3+ T cell response to any HIV antigen at day 70, 2 weeks after the third vaccination, were 0% for placebo with or without IL-2/Ig only, 44% for the DNA vaccine alone, 30% in group T4, and 60% in T5 (Table 3). At day 364, response rates were 0% for placebo with or without IL-2/Ig only, 33% for the DNA vaccine alone, 25% in group T4, and 67% in T5. The magnitude of the responses in the subjects receiving the DNA vaccine was higher than in those receiving placebo with or without IL-2/Ig at day 70 (P = .001) and 364 (P = .047). The magnitude of the responses was highest in the T5 group. There is a trend to a more durable response in the T5 group compared with group D or T4 (P = .07 for T5 vs either D or T4). These responses were predominantly targeted against envelope proteins, and few responses were detected against Gag, Pol, or Nef. The per-protocol response rates were similar to the ITT response rates.
Table 3.
Response Rates of Envelope-Specific T Cells as Measured by IL-2/IFN-γ Intracellular Cytokine Assay in Cryopreserved PBMCs on Days 70 and 364
| Response rate, No. (%; 95% CI) |
||
| Group | Day 70 | Day 364 |
| C | 1/19 (5; .1–26.0) | 0/12 (0; .0–26.5) |
| D | 4/9 (44; 13.7–78.8) | 3/9 (33; 7.5–70.1) |
| T1 | 2/4 (50; 6.8–93.2) | 1/4 (25; .6–80.6) |
| T2 | 2/5 (40; 5.3–85.3) | 2/5 (40; 5.3–85.3) |
| T3 | 4/9 (44; 13.7–78.8) | 3/9 (33; 7.5–70.1) |
| T4 | 3/10 (30; 6.7–65.2) | 2/8 (25; 3.2–65.1) |
| T5 | 6/10 (60; 26.2–87.8) | 4/6 (67; 22.3–95.7) |
Subjects in group C received only phosphate-buffered saline or the plasmid coding for the fusion protein of interleukin 2 and immunoglobulin (IL-2/Ig), those in group D received only the human immunodeficiency virus (HIV) DNA vaccine, those in groups T1–T4 received the HIV DNA vaccine simultaneously with escalating doses of IL-2/Ig (0.1, 0.5, 1.5, and 4 mg, respectively, for groups T1, T2, T3, and T4), and those in group T5 received IL-2/Ig 48 hours after the HIV DNA vaccine. Ex vivo CD3+ T cell responses were identified by intracellular cytokine staining using HIV-1 envelope global potential T-cell epitope peptide pools. Abbreviations: CI, confidence interval; IFN, interferon; IL, interleukin; PBMCs, peripheral blood mononuclear cells.
In general, the CD4+ cell responses were more frequent than CD8+ cell responses. CD4+ cell responses were observed in 4 of 9 subjects in the DNA vaccine–alone group (44.4%; 95% CI, 13.7%–78.8%), 3 of 10 in T4 (30%; 95% CI, 6.7%–65.2%), and 6 of 10 in T5 (60%; 95% CI, 26.2%–87.8%). These response rates were similar at day 364. CD8+ cell responses were observed in 1 of 9 subjects in the DNA vaccine–alone group (11.1%; 95% CI, .3%–48.2%), 0 of 10 in T4 (0%; 95% CI, 0%–30.8%), and 3 of 10 in T5 (30%; 95% CI, 6.7%–65.2%).
HIV-1–Binding Antibodies
At day 182, binding antibodies to MN gp120 by ELISA were not detected. Using the HIV-1–binding antibody multiplex assay, low concentrations (7.4–23 μg/mL HIVIG equivalents, median magnitude) of vaccine-elicited binding antibodies were detected in most subjects receiving the DNA vaccine alone (56%) and most of those receiving the DNA vaccine plus IL-2/Ig (100% for T2, 60% for T3, 11% for T4, and 50% for T5). There were no significant differences in anti-Env response rate or magnitude between participants given DNA vaccine alone versus DNA vaccine plus any dose of IL-2/Ig (groups T1–T5 combined). However, the median concentration of anti-Env antibodies (ConSgp140) was 2.4 μg/mL (HIVIG equivalents) for T4 compared with 14.2 μg/mL (HIVIG equivalents ) for T5 (P = .02). The low antibody response rate and magnitude with this vaccine regimen make it difficult to robustly compare the effect of the timing of IL-2/Ig administration. However, anti-Env antibody responses seemed higher when IL-2/Ig was given 2 days after the DNA vaccine, compared with simultaneous administration. No significant HIV neutralizing antibodies were detected.
DISCUSSION
These data demonstrate, for the first time, that an immunostimulatory cytokine plasmid and the timing of cytokine administration can significantly affect the immune responses elicited to a vaccine in humans. Administration of the plasmid DNA encoding IL-2/Ig given 48 hours after a plasmid DNA vaccine comprising HIV-1 clade A, B, and C envelopes and a clade B/Gag/Pol/Nef polyprotein significantly augmented T-cell responses, compared with IL-2/Ig simultaneous administration. These observations are consistent with findings from studies in murine and nonhuman primate models [13, 25], and they have important implications for future development of cytokine therapies used to augment immune responses [36, 37].
Augmented T-cell immune responses were observed with both IFN-γ and IL-2 ELISPOT assays, testing responses in fresh cells to homologous peptides from EnvA, EnvB, and EnvC. ELISPOT assays performed in frozen cells with potential T-cell epitope peptides showed a similar response pattern, albeit with lower rates of response than in fresh cells, indicating the likely increased sensitivity with the use of fresh cells and/or matched peptides in this setting [38].
ICS assays with potential T-cell epitope peptides on frozen cells showed a trend toward a more durable response at 1 year in the IL-2/Ig group that received IL-2/Ig 48 hours after vaccination, compared with the groups that received IL-2/Ig simultaneously with the DNA vaccine or the DNA vaccine alone. These data suggest that IL-2/Ig administration 48 hours after vaccination may affect the duration as well as the magnitude of T-cell responses. CD4+ responses were generally seen more frequently than CD8+ responses. ELISPOT responses were largely to the envelope proteins, and few responses were seen to Gag, Pol, or Nef.
As expected with a DNA-only vaccine, the humoral responses were relatively weak. Low-level but higher antibody responses were measured in the delayed IL-2/Ig compared with the simultaneous IL-2/Ig group suggesting that cytokine timing may influence antibody responses as well. Thus, further studies with more robust vaccine-elicited antibody responses are needed to assess the impact of cytokine administration on the humoral response.
IL-2/Ig plasmid was generally safe and well tolerated given alone or in combination with the DNA HIV vaccine. Unlike experience with IL-2 given parenterally at higher doses, which can be associated with significant toxicity [39–41], only 2 episodes of greater than moderate systemic reactogenicity were seen when IL-2/Ig was administered intramuscularly. Local reactions consisting of mild pain or tenderness at the injection site were the most commonly encountered side effects. No differences were seen in rates of local or systemic reactogenicity among the various treatment groups. The excellent safety profile of the IL-2/Ig delivered by DNA plasmid is likely to be a result of the lower dose of IL-2 delivered only to the vaccine site, probably with little systemic absorption [42].
The observation that administration of IL-2/Ig given 48 hours after DNA vaccination augments immune responses compared with simultaneous administration of DNA vaccine and IL-2/Ig is consistent with observations in mice and monkeys. The mechanism for the augmentation effect of IL-2/Ig given 48 hours after vaccination is not known. Because the IL-2/Ig plasmid probably has peak expression 1 day after administration, with expression rapidly tapering by the second day [42], the precise timing of IL-2 stimulation of antigen-specific cells may be a critical factor. Simultaneous administration of IL-2 and antigen may stimulate a broad cellular response, with relatively fewer antigen-specific cells stimulated by IL-2 than when IL-2 is administered 48 hours after these cells have already been stimulated by vaccine antigens. This would presumably mimic the events in natural infection, wherein IL-2 is typically secreted as part of a cytokine cascade after antigen is presented by antigen-presenting cells and triggers T cells. Therefore, it is not surprising that plasmid IL-2/Ig is most effective when delivered after the antigen. It is also possible that simultaneous administration of IL-2/Ig with vaccine antigen impairs the elicitation of the T cell responses. This further indicates the importance of the timing of cytokine administration on immune response, which was also observed in the animal models [24]. Ultimately, the mechanism is unclear, but we suspect it may be related to improved antigen presentation and T lymphocyte priming. The possibility of the adjuvant affecting T lymphocyte phenotype is of interest and worth exploring in future studies but was not specifically addressed in ours.
Taken together, these data demonstrate, for the first time in humans, that cytokine administration can augment immune responses to vaccination but that the timing of administration can have a significant effect on whether augmentation occurs. Further studies will be required to determine the optimal timing of regimens. These observations may have important implications for the design and interpretation of studies that use cytokines as adjuvants in humans [36, 37], although it is likely that optimal timing of administration of the cytokine may be different for each cytokine and for the type of immune response sought.
Notes
Acknowledgments.
We thank Michael Kishko, Judith T. Lucas, Vicki C. Ashley, and Kristy O. Long for expert technical assistance; Drs L. Liao and B. Haynes for providing the HIV-1 envelope proteins; and Dr Marcella Sarzotti-Kelsoe, Comprehensive Antibody-Vaccine Immune Monitoring Consortium, Central Quality Assurance Unit, for quality assurance oversight.
Financial support.
This work was funded by the National Institute of Allergy and Infectious Diseases, National Institutes of Health.
Potential conflicts of interest.
All authors: No reported conflicts.
All authors have submitted the ICMJE Form for Disclosure of Potential Conflicts of Interest. Conflicts that the editors consider relevant to the content of the manuscript have been disclosed.
References
- 1.Palella FJ, Jr, Delaney KM, Moorman AC, et al. Declining morbidity and mortality among patients with advanced human immunodeficiency virus infection. HIV Outpatient Study Investigators. N Engl J Med. 1998;338:853–60. doi: 10.1056/NEJM199803263381301. [DOI] [PubMed] [Google Scholar]
- 2.Letvin NL. Progress in the development of an HIV-1 vaccine. Science. 1998;280:1875–80. doi: 10.1126/science.280.5371.1875. [DOI] [PubMed] [Google Scholar]
- 3.Graham BS, Koup RA, Roederer M, et al. Phase 1 safety and immunogenicity evaluation of a multiclade HIV-1 DNA candidate vaccine. J Infect Dis. 2006;194:1650–60. doi: 10.1086/509259. [DOI] [PMC free article] [PubMed] [Google Scholar]
- 4.Goepfert PA, Tomaras GD, Horton H, et al. Durable HIV-1 antibody and T-cell responses elicited by an adjuvanted multi-protein recombinant vaccine in uninfected human volunteers. Vaccine. 2007;25:510–8. doi: 10.1016/j.vaccine.2006.07.050. [DOI] [PubMed] [Google Scholar]
- 5.Russell ND, Graham BS, Keefer MC, et al. Phase 2 study of an HIV-1 canarypox vaccine (vCP1452) alone and in combination with rgp120: negative results fail to trigger a phase 3 correlates trial. J Acquir Immune Defic Syndr. 2007;44:203–12. doi: 10.1097/01.qai.0000248356.48501.ff. [DOI] [PMC free article] [PubMed] [Google Scholar]
- 6.Buchbinder SP, Mehrotra DV, Duerr A, et al. Efficacy assessment of a cell-mediated immunity HIV-1 vaccine (the Step Study): a double-blind, randomised, placebo-controlled, test-of-concept trial. Lancet. 2008;372:1881–93. doi: 10.1016/S0140-6736(08)61591-3. [DOI] [PMC free article] [PubMed] [Google Scholar]
- 7.McElrath MJ, De Rosa SC, Moodie Z, et al. HIV-1 vaccine-induced immunity in the test-of-concept Step Study: a case-cohort analysis. Lancet. 2008;372:1894–905. doi: 10.1016/S0140-6736(08)61592-5. [DOI] [PMC free article] [PubMed] [Google Scholar]
- 8.Rerks-Ngarm S, Pitisuttithum P, Nitayaphan S, et al. Vaccination with ALVAC and AIDSVAX to prevent HIV-1 infection in Thailand. N Engl J Med. 2009;361:2209–20. doi: 10.1056/NEJMoa0908492. [DOI] [PubMed] [Google Scholar]
- 9.Musey L, Hughes J, Schacker T, Shea T, Corey L, McElrath MJ. Cytotoxic-T-cell responses, viral load, and disease progression in early human immunodeficiency virus type 1 infection. N Engl J Med. 1997;337:1267–74. doi: 10.1056/NEJM199710303371803. [DOI] [PubMed] [Google Scholar]
- 10.Ogg GS, Jin X, Bonhoeffer S, et al. Quantitation of HIV-1-specific cytotoxic T lymphocytes and plasma load of viral RNA. Science. 1998;279:2103–6. doi: 10.1126/science.279.5359.2103. [DOI] [PubMed] [Google Scholar]
- 11.Schmitz JE, Kuroda MJ, Santra S, et al. Control of viremia in simian immunodeficiency virus infection by CD8+ lymphocytes. Science. 1999;283:857–60. doi: 10.1126/science.283.5403.857. [DOI] [PubMed] [Google Scholar]
- 12.Jin X, Bauer DE, Tuttleton SE, et al. Dramatic rise in plasma viremia after CD8+ T cell depletion in simian immunodeficiency virus-infected macaques. J Exp Med. 1999;189:991–8. doi: 10.1084/jem.189.6.991. [DOI] [PMC free article] [PubMed] [Google Scholar]
- 13.Barouch DH, Santra S, Schmitz JE, et al. Control of viremia and prevention of clinical AIDS in rhesus monkeys by cytokine-augmented DNA vaccination. Science. 2000;290:486–92. doi: 10.1126/science.290.5491.486. [DOI] [PubMed] [Google Scholar]
- 14.Rosenberg ES, Billingsley JM, Caliendo AM, et al. Vigorous HIV-1-specific CD4+ T cell responses associated with control of viremia. Science. 1997;278:1447–50. doi: 10.1126/science.278.5342.1447. [DOI] [PubMed] [Google Scholar]
- 15.Eller MA, Eller LA, Opollo MS, et al. Induction of HIV-specific functional immune responses by a multiclade HIV-1 DNA vaccine candidate in healthy Ugandans. Vaccine. 2007;25:7737–42. doi: 10.1016/j.vaccine.2007.08.056. [DOI] [PubMed] [Google Scholar]
- 16.Catanzaro AT, Roederer M, Koup RA, et al. Phase I clinical evaluation of a six-plasmid multiclade HIV-1 DNA candidate vaccine. Vaccine. 2007;25:4085–92. doi: 10.1016/j.vaccine.2007.02.050. [DOI] [PubMed] [Google Scholar]
- 17.Wang B, Ugen KE, Srikantan V, et al. Gene inoculation generates immune responses against human immunodeficiency virus type 1. Proc Natl Acad Sci U S A. 1993;90:4156–60. doi: 10.1073/pnas.90.9.4156. [DOI] [PMC free article] [PubMed] [Google Scholar]
- 18.Shiver JW, Davies ME, Yasutomi Y, et al. Anti-HIV env immunities elicited by nucleic acid vaccines. Vaccine. 1997;15:884–7. doi: 10.1016/s0264-410x(96)00251-4. [DOI] [PubMed] [Google Scholar]
- 19.Tavel JA, Martin JE, Kelly GG, et al. Safety and immunogenicity of a Gag-Pol candidate HIV-1 DNA vaccine administered by a needle-free device in HIV-1-seronegative subjects. J Acquir Immune Defic Syndr. 2007;44:601–5. doi: 10.1097/QAI.0b013e3180417cb6. [DOI] [PMC free article] [PubMed] [Google Scholar]
- 20.Iwasaki A, Stiernholm BJ, Chan AK, et al. Enhanced CTL responses mediated by plasmid DNA immunogens encoding costimulatory molecules and cytokines. J Immunol. 1997;158:4591–601. [PubMed] [Google Scholar]
- 21.Goujard C, Marcellin F, Hendel-Chavez H, et al. Interruption of antiretroviral therapy initiated during primary HIV-1 infection: impact of a therapeutic vaccination strategy combined with interleukin (IL)-2 compared with IL-2 alone in the ANRS 095 Randomized Study. AIDS Res Hum Retroviruses. 2007;23:1105–13. doi: 10.1089/aid.2007.0047. [DOI] [PubMed] [Google Scholar]
- 22.Recchia F, Saggio G, Amiconi G, et al. Multicenter phase II study of chemo-immunotherapy in the treatment of metastatic renal cell carcinoma. J Immunother. 2007;30:448–54. doi: 10.1097/CJI.0b013e31802ff843. [DOI] [PubMed] [Google Scholar]
- 23.Middleton M, Hauschild A, Thomson D, et al. Results of a multicenter randomized study to evaluate the safety and efficacy of combined immunotherapy with interleukin-2, interferon-α2b and histamine dihydrochloride versus dacarbazine in patients with stage IV melanoma. Ann Oncol. 2007;18:1691–7. doi: 10.1093/annonc/mdm331. [DOI] [PubMed] [Google Scholar]
- 24.Barouch DH, Santra S, Steenbeke TD, et al. Augmentation and suppression of immune responses to an HIV-1 DNA vaccine by plasmid cytokine/Ig administration. J Immunol. 1998;161:1875–82. [PubMed] [Google Scholar]
- 25.Barouch DH, Craiu A, Kuroda MJ, et al. Augmentation of immune responses to HIV-1 and simian immunodeficiency virus DNA vaccines by IL-2/Ig plasmid administration in rhesus monkeys. Proc Natl Acad Sci U S A. 2000;97:4192–7. doi: 10.1073/pnas.050417697. [DOI] [PMC free article] [PubMed] [Google Scholar]
- 26.Dubey S, Clair J, Fu TM, et al. Detection of HIV vaccine-induced cell-mediated immunity in HIV-seronegative clinical trial participants using an optimized and validated enzyme-linked immunospot assay. J Acquir Immune Defic Syndr. 2007;45:20–7. doi: 10.1097/QAI.0b013e3180377b5b. [DOI] [PubMed] [Google Scholar]
- 27.Moodie Z, Huang Y, Gu L, Hural J, Self SG. Statistical positivity criteria for the analysis of ELISpot assay data in HIV-1 vaccine trials. J Immunol Methods. 2006;315:121–32. doi: 10.1016/j.jim.2006.07.015. [DOI] [PubMed] [Google Scholar]
- 28.Horton H, Thomas EP, Stucky JA, et al. Optimization and validation of an 8-color intracellular cytokine staining (ICS) assay to quantify antigen-specific T cells induced by vaccination. J Immunol Methods. 2007;323:39–54. doi: 10.1016/j.jim.2007.03.002. [DOI] [PMC free article] [PubMed] [Google Scholar]
- 29.Shulman N, Bellew M, Snelling G, et al. Development of an automated analysis system for data from flow cytometric intracellular cytokine staining assays from clinical vaccine trials. Cytometry A. 2008;73:847–56. doi: 10.1002/cyto.a.20600. [DOI] [PMC free article] [PubMed] [Google Scholar]
- 30.Li F, Malhotra U, Gilbert PB, et al. Peptide selection for human immunodeficiency virus type 1 CTL-based vaccine evaluation. Vaccine. 2006;24:6893–904. doi: 10.1016/j.vaccine.2006.06.009. [DOI] [PubMed] [Google Scholar]
- 31.Tomaras GD, Yates NL, Liu P, et al. Initial B cell responses to transmitted human immunodeficiency virus type 1: virion binding immunoglobulin M (IgM) and IgG antibodies followed by plasma anti-gp41 antibodies with ineffective control of initial viremia. J Virol. 2008;82:12449–63. doi: 10.1128/JVI.01708-08. [DOI] [PMC free article] [PubMed] [Google Scholar]
- 32.Liao HX, Sutherland LL, Xia SM, et al. A group M consensus envelope glycoprotein induces antibodies that neutralize subsets of subtype B and C HIV-1 primary viruses. Virology. 2006;353:268–82. doi: 10.1016/j.virol.2006.04.043. [DOI] [PMC free article] [PubMed] [Google Scholar]
- 33.Moodie Z, Price L, Gouttefangeas C, et al. Response definition criteria for ELISPOT assays revisited. Cancer Immunol Immunother. 2010;59:1489–501. doi: 10.1007/s00262-010-0875-4. [DOI] [PMC free article] [PubMed] [Google Scholar]
- 34.Agresti A, Coull BA. Order-restricted tests for stratified comparisons of binomial proportions. Biometrics. 1996;52:1103–11. [PubMed] [Google Scholar]
- 35.Catanzaro AT, Koup RA, Roederer M, et al. Phase 1 safety and immunogenicity evaluation of a multiclade HIV-1 candidate vaccine delivered by a replication-defective recombinant adenovirus vector. J Infect Dis. 2006;194:1638–49. doi: 10.1086/509258. [DOI] [PMC free article] [PubMed] [Google Scholar]
- 36.Baden L, Elizaga M, Parker S, et al. Phase I trials of a prophylactic HIV-1 gag vaccine with IL-12 or IL-15 DNA molecular adjuvant (HVTN060 and 063) AIDS Vaccine Meet. 2009 In press. [Google Scholar]
- 37.Parker S, Elizaga M, Kim D, et al. Phase I trial of a prophylactic HIV-1 gag-pol-env DNA plasmid vaccine with IL-12 or IL-15 DNA molecular adjuvants (HVTN 070) AIDS Vaccine Meet. 2010 In press. [Google Scholar]
- 38.Barouch DH, O'Brien KL, Simmons NL, et al. Mosaic HIV-1 vaccines expand the breadth and depth of cellular immune responses in rhesus monkeys. Nat Med. 2010;16:319–23. doi: 10.1038/nm.2089. [DOI] [PMC free article] [PubMed] [Google Scholar]
- 39.Abrams D, Levy Y, Losso MH, et al. Interleukin-2 therapy in patients with HIV infection. N Engl J Med. 2009;361:1548–59. doi: 10.1056/NEJMoa0903175. [DOI] [PMC free article] [PubMed] [Google Scholar]
- 40.Negrier S, Escudier B, Lasset C, et al. Recombinant human interleukin-2, recombinant human interferon alfa-2a, or both in metastatic renal-cell carcinoma. Groupe Francais d'Immunotherapie. N Engl J Med. 1998;338:1272–8. doi: 10.1056/NEJM199804303381805. [DOI] [PubMed] [Google Scholar]
- 41.Kovacs JA, Vogel S, Albert JM, et al. Controlled trial of interleukin-2 infusions in patients infected with the human immunodeficiency virus. N Engl J Med. 1996;335:1350–6. doi: 10.1056/NEJM199610313351803. [DOI] [PubMed] [Google Scholar]
- 42.Barouch DH, Truitt DM, Letvin NL. Expression kinetics of the interleukin-2/immunoglobulin (IL-2/Ig) plasmid cytokine adjuvant. Vaccine. 2004;22:3092–7. doi: 10.1016/j.vaccine.2004.01.065. [DOI] [PubMed] [Google Scholar]