Abstract
Optical imaging using near-infrared light is used for noninvasive probing of tissues to recover vascular and molecular status of healthy and diseased tissues using hemoglobin contrast arising due to absorption of light. While multimodality optical techniques exist, visualization techniques in this area are limited. Addressing this issue, we present a simple framework for image overlay of optical and magnetic resonance (MRI) or computerized tomographic images which is intuitive and easily usable, called NIRViz. NIRViz is a multimodality software platform for the display and navigation of Digital Imaging and Communications in Medicine (DICOM) MRI datasets and 3D optical image solutions geared toward visualization and coregistration of optical contrast in diseased tissues such as cancer. We present the design decisions undertaken during the design of the software, the libraries used in the implementation, and other implementation details as well as preliminary results from the software package. Our implementation uses the Visualization Toolkit library to do most of the work, with a Qt graphical user interface for the front end. Challenges encountered include reslicing DICOM image data and coregistration of image space and mesh space. The resulting software provides a simple and customized platform to display surface and volume meshes with optical parameters such as hemoglobin concentration, overlay them on magnetic resonance images, allow the user to interactively change transparency of different image sets, rotate geometries, clip through the resulting datasets, obtain mesh and optical solution information, and successfully interact with both functional and structural medical image information.
Keywords: MRI, Multimodality imaging, NIRViz, Visualization Toolkit, Insight Segmentation Toolkit
Introduction
Near-infrared (NIR) diffuse optical imaging has gained considerable interest in the last couple of decades for providing functional information of biological tissues in vivo. The images of total hemoglobin, oxygen saturation, water, and scattering from optical techniques give an insight into tissue metabolism and vasculature. This has applications in breast cancer diagnosis [1–3], monitoring response of breast cancer patients to neoadjuvant chemotherapy [4–6], monitoring hemodynamics of neonates through brain imaging [7–9], and small animal imaging [10, 11]. Clinical trials are underway, and FDA-approved optical imagers are now in use. Recent years have seen a surge in 3D optical imaging to provide volumetric assessment of diseased tissues [8, 12–15]. Interest has evolved in coupling optical techniques with other high-resolution modalities such as magnetic resonance imaging (MRI), X-ray, and computerized tomography (CT) for providing high-resolution functional multimodality information [16, 17]. This is akin to other multimodality functional imaging techniques such as positron emission tomography–computed tomography and dynamic contrast-enhanced MRI. Visualization tools for viewing these 3D multimodality datasets, fusion, and coregistration have been limited, and yet, these tools are necessary for interpretation and analysis of the imaging data especially as the patient population in clinical trials increase. In this type of multimodality imaging, anatomical information from MRI or X-ray is incorporated into optical image reconstruction process. The image reconstruction itself is an inverse problem in which the diffusion equation for light propagation is solved using finite element techniques.
Generally, medical image visualization platforms work with either image space or mesh space. Image space refers to manipulation of image data such as from Digital Imaging and Communications in Medicine (DICOM), Tiff, and Jpeg formats. Mesh space refers to manipulation of mesh data and corresponding solutions in formats such as Vtk, nod/element files, Stl, Abacus, and Ansys formats. Some examples of image space software are 3D Slicer [18], VR-Render [19], and OsiriX [20]. These have an expanded functionality such as image segmentation, adjusting for compression, and sophisticated coregistration techniques, which have a trade-off on the simplicity and ease of use of the software. Since optical solutions are in mesh space, these software make it difficult to import optical solutions. There is the possibility of saving mesh solutions into image formats by extrapolation, but it is difficult for these to be converted into image space in a flexible and regular manner. Other software like Paraview and Tecplot allow display and manipulation of mesh space by importing mesh and solution files, viewing isosurfaces to be created, changing scale of values, and so on. However, these do not lend themselves to multimodality image coregistration. Multimodality optical image visualization requires integrating mesh space with image space, and hence, we needed to create a new platform that would allow manipulation of both spaces without the burden of additional functionality such as image segmentation [21] and analysis which makes the software complex and limits usability as a simple visualization tool.
NIRViz is primarily designed to view surface and volume-reconstructed estimates of NIR parameters overlaid on MRI volume. These parameters include concentrations of oxy- and deoxyhemoglobin, water, scatter, and extended indices of total hemoglobin and oxygen saturation. The functionality of NIRViz can also be used to view estimates of reconstructed optical fluorescence overlaid on MRI or CT for small animal imaging. Since most optical imaging modalities involving image reconstruction use the finite element method [22] or, recently, boundary element method [23], the software is designed to read surface and volume data in corresponding format using mesh files, and any geometry contained therein can be overlaid on the MRI or CT images they were derived from. Thus, in addition to being able to overlay fluorescence and optical data, the software can visualize solutions from other imaging modalities that use finite element mesh (FEM) techniques and store reconstructed images in mesh files.
Our goal in this work has been to build a customized and seamless 3D display, overlay, and navigation platform for interpretation of image-guided optical estimates from biological tissues that is simple and intuitive to use and extendable to other optical techniques such as fluorescence for molecular imaging. In particular, our motivation was to provide clinician users (both technical and nontechnical) as well as academic users with a simple and intuitive MRI and optical image viewer and interpreter. We have used the open-source Visualization Toolkit (VTK) [24] for the surface and volume rendering of optical data. Insight Segmentation Toolkit (ITK) [25] was used for the segmentation software filters and I/O readers. Qt [26] was used for the user interface because of its functionality as a cross-platform graphical user interface, and its robust integration with the different windowing systems of the various platforms. The Grassroots DiCoM (GDCM) library [27] was used for loading and reslicing the medical images. We present the development path and results obtained using this software. Also addressed are some challenges faced during the development of the software and solutions we used to overcome these.
Methods
Libraries
Most open-source imaging software systems attempt to be cross-platform by targeting the lowest common denominator graphical user interface for different platforms. For graphical user interfaces (GUIs), this is the X windowing system. Unfortunately, even though the software runs correctly on different platforms when implemented using the X windowing system, the look and feel of the application do not usually match the target platform. The result is generally a functioning but ineffective and unintuitive application, which ends up unused, and the user usually resorts to a case-by-case overlaying technique. In the design of NIRViz, the ability to run on multiple platforms with the application matching the look and feel of the target platforms was deemed important. As the software was primarily designed for overlaying reconstructed images on top of some source image, the ability to reslice and cross-section the displayed data, in both the mesh and image space, was also a major target for the software system. The choices of software libraries reflect this need for a native-looking cross-platform application that allows the user to manipulate the data in both image and mesh space.
The Qt library provides the framework for a cross-platform graphical user interface, and it provides an excellent event management system with which to drive the GUI. The library supports all three major platforms (Windows, Mac, and Linux and its variants) and generates applications that look at home in these different graphical environments. The Qt library was also a natural choice for the GUI since it provided an easy integration with the VTK library. The VTK library provides the core functionality of the application and is used in the display of both the FEM mesh and DICOM image formats. In addition to providing excellent readers for the mesh surface and volume format, the VTK library provides a pipeline framework that allows the user to interact with the images and modify the images, without the need to write and reread the data from disk. The library also comes with a kitchen sink array of functions with which to reslice and cross-section the data. The ITK and GDCM libraries support I/O of MRI files in DICOM format. The GDCM library was chosen to read and preprocess the DICOM images (manipulate the pixel intensity, display the DICOM images in different orientations, etc.) again because of its close integration with VTK.
As can be experienced by the multitude of libraries supporting parts of the DICOM format (GDCM, DCMTK) [27, 28], reading and parsing DICOM files is difficult. Most details are taken care of by the DICOM parsing libraries (details such as finding the proper window/level for the image, finding the number of slices in the DICOM image set, or reading other metadata embedded in the DICOM image such as patient name, age, etc.), but others are much harder to get right. Specifically, problems were encountered with displaying all the DICOM files in a geometrically consistent manner. A DICOM image can be acquired in several orientations, and how the DICOM image is resliced is influenced by these acquisition orientations. Ideally, NIRViz should start with the original MRI data and create reformatted images in the other two orthogonal planes. VTK and GDCM have classes to support the reslicing, but these classes assume that the DICOM images were acquired using axial view. In our dataset, we had exampled images that were acquired in both coronal or sagittal views, with the result that when we used these VTK/GDCM classes for visualizing the DICOM files, the different plane geometries appeared in incorrect windows. Allowing the user to specify manually the orientation in which the DICOM data were acquired (as axial, sagittal, or coronal projections) and manually reformatting the DICOM data to be initially in the axial projection resolved this issue.
The NIRViz application is composed of four major software libraries, all implemented in C++, and a fifth, used for the building process. Logically, the program sits on a Qt codebase, which composes most of the user interface. The VTK libraries provide visualization support, while the ITK and GDCM libraries support I/O of DICOM files. Before any software development was done, the software libraries had to be downloaded and built into binaries. In particular, these versions of the libraries were downloaded:
VTK version 5.2.1
ITK version 3.10.2
GDCM version 2.0.12
CMake version 2.6.2
Qt version 4.5.0
Compilation
CMake is a Kitware technology that allows for easy compilation of any software project. The Kitware (www.kitware.com) libraries and the GDCM library were all compiled with CMake. With CMake, one can quickly discover all the files and libraries that the system being built depends on, and can automatically configure the build system to locate these files upon compilation. ITK, GDCM, and VTK all used CMake for the compilation process, but Qt was downloaded as a prebuilt binary from the Trolltech (www.trolltech.com) website. VTK was built so that it had Qt GUI support (an option in the CMake build system), GDCM was built to use the VTK libraries, and ITK was built so that it used the just compiled GDCM library for DICOM I/O (also options in the CMake build system). Altogether, the entire compilation took 2 h when it ran without any errors. The build platform (the computer architecture on which the software was compiled on) was an Apple MacBook, with 2-GHz Intel Core 2 Duo processors, 2-GB, 1,067-MHz memory, and an NVIDIA GeForce 9400M graphics chip with 256 MB of memory. The main application was developed using the Qt 4.5 SDK, and used the built-in “make” system (qmake) to compile, link the libraries, and run the resulting executable.
One important area of troubleshooting involved correct compilations of the software libraries. The libraries interacted in unexpected ways in the different environments, specifically for some environments, most notably windows, entire development environments had to be built from the ground up. Almost all of the major development tools (compilers, SDKs, etc.) in the Windows environment are proprietary, so an open-source solution had to be found. By downloading and compiling “minimalist GNU tools for Windows” (www.mingw.org), we were able to overcome this limitation.
Results
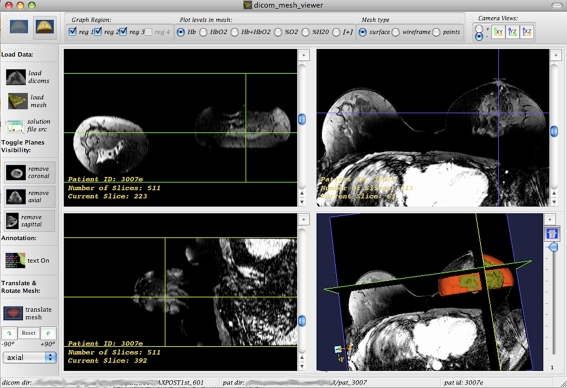
Physical Layout The physical layout of the NIRViz application mirrors those of mainstream visualization applications (e.g., 3D Slicer and Mimics). The application has a classic four-window layout where the coronal, axial, sagittal, and 3D windows are arranged in a grid-like pattern of resizable windows. This is shown in Fig. 1 for MRI volume of breast with associated optical data. When the user loads a DICOM image set, the coronal, axial, and sagittal windows hold the corresponding geometry, and the 3D window holds an interactive 3D view of the three planes in space. One can adjust the window/level of the loaded DICOM set through intuitive mouse control.
Fig. 1.
A four-panel window grid display of NIRViz application is shown. The window consists of four grids for axial, coronal, sagittal, and 3D overlaid display. Each of the windows can be maximized using + button on the right hand top corner
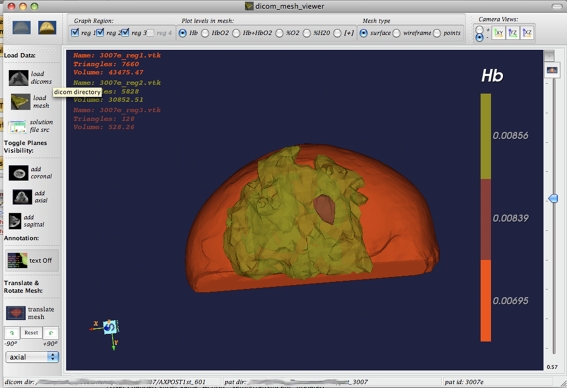
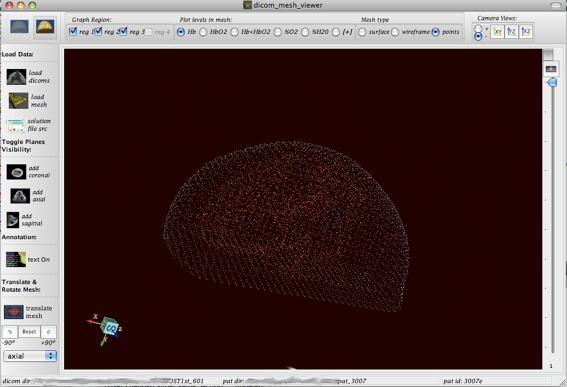
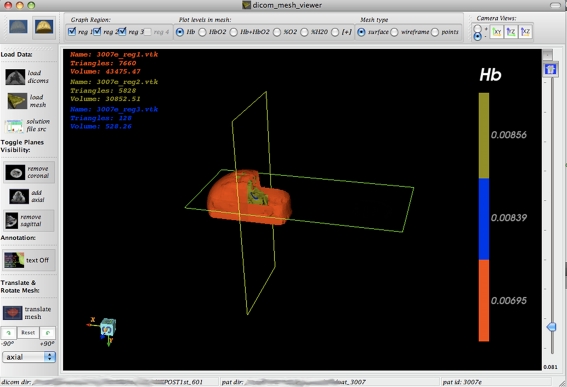
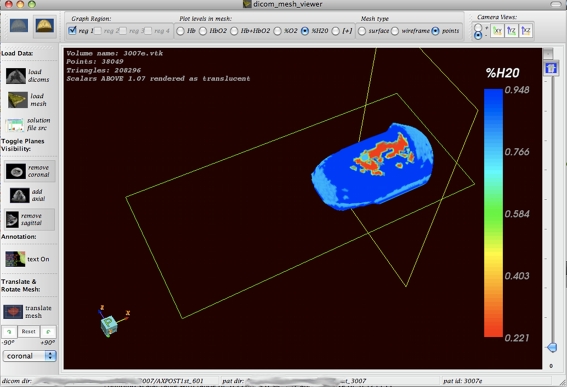
FEM File Loading The application allows for FEM geometry surface or volume geometry files to be loaded and visualized in the 3D window as shown in Fig. 1 (right bottom). The meshes are displayed in 3D, and are overlaid on the DICOM image set in this window such that the geometries coincide. Once loaded, one can visualize the surface meshes as regular surface (Fig. 2), wireframe (Fig. 3), or point data. One can also control the color and transparency of the loaded mesh images, for both the surface and volume meshes, as well as maximize the window by simply clicking on the + button at the corner of the window (as maximized in Figs. 2 and 3). This is applicable to every one of the subwindows.
Fig. 2.
An example of surface mesh loaded into the workspace is shown. The 3D window (bottom right panel in Fig. 1) has been maximized to show as much geometry as possible. The orthogonal DICOM planes have been hidden. The optical solution for deoxyhemoglobin is shown for the different tissues in the breast
Fig. 3.
Surface mesh is shown as points in space. Only the reconstructed x, y, and z points in space are plotted in this image
3D DICOM Image Slicing and Rotation The DICOM set loaded into the 3D window can be rotated so that any side of the DICOM image can be viewed. One can also adjust the planes in the three orthogonal positions (coronal, axial, and sagittal) so that a different slice of the DICOM image set is shown. The contrast of the images can be varied by the standard left mouse click in any window containing a DICOM image and up or down track (to increase/decrease the DICOM image contrast). The contrast (window/level) settled on in this adjustment will apply to all DICOM images containing windows in the application. The contrast of the mesh, i.e., the transparency of the meshes, can be controlled by the slider bar situated to the right of the 3D mesh display window. This slider controls the transparency of the mesh rendered for surface meshes and decides which pixels in a volume image are rendered as transparent and which as opaque (the slider value is the cutoff point) when a volume mesh is loaded. When this slider is toggled to control the DICOM images loaded in the 3D window (by means of a pushbutton above the slider), it controls the transparency of the DICOM image.
Mesh Dragging and Rotation Once the mesh files have been loaded, one can rotate and drag them independently of the DICOM set. This feature allows for manual coregistration of the two image sets for situations when the datasets are not automatically coregistered.
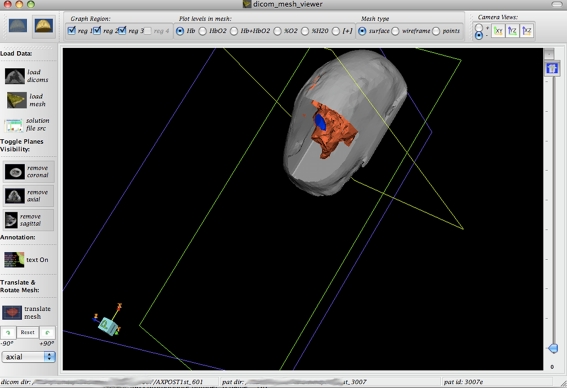
Mesh Slicing Once the mesh and the DICOM image set have been loaded into the 3D window, the three orthogonal DICOM planes slice the mesh image, such that one can see inside the mesh with the DICOM image forming a background of the cut. In this way, reconstructed mesh data appear on top of the DICOM image as an overlaid image. Figures 4 and 5 show the cross-sectioning of the mesh at specific planes of the DICOM images.
Fig. 4.
Same mesh as Figs. 2 and 3 but with the DICOM planes’ visibility enabled is displayed. Notice how the planes slice the mesh to reveal the internal geometry. In this image, the DICOM planes’ opacity has been decreased all the way to transparent using the slider bar on the right. The slider bar can toggle between transparency of DICOM and mesh using button on top right below the − sign
Fig. 5.
Alternate view of same dataset as in Fig. 4. Here, the mesh colors have been changed, and one DICOM plane (the axial one) has been disabled so that one can see into the “wedge” of the mesh image. Additional information for the surfaces relating to triangles and volume is also displayed
Volume Mesh Overlay and Cross-Sectioning A volume mesh read as coordinate x, y, and z points and alpha values for each coordinate point can be loaded into the 3D window in which the three orthogonal DICOM slices reside. As illustrated in Figs. 6 and 7, the DICOM slices can then be used to section/cut through the volume in such a way that the internal areas of the volume are visible, with the orthogonal DICOM slices forming a skeletal background of the patient anatomy and the volume mesh appearing to fill in the details of the DICOM image in the foreground. For the overlaying technique described above to be successful, the volume mesh has to be situated in the same place in space (in the 3D coordinate system) as the DICOM images. This was not initially the case because of the way the segmentation algorithm used to make the volume mesh exported the final mesh file. Any segmentation algorithm is supposed to preserve the original geometry of the pixels in a DICOM dataset when a mask is made from it. With the segmentation algorithm/package we were using (Mimics, www.materialise.com/mimics), this was not the case, which made automatic coregistration difficult especially for volume meshes. We provided a manual coregistration option as a solution. The manual coregistration system allowed the user to drag the mesh geometry into place over the DICOM geometry, thus undoing any translation effects of the segmentation algorithm/package. This was not needed for image segmentation done using ITK since ITK preserved the pixel coordinates from mask to mesh, allowing for far easier automatic coregistration.
Fig. 6.
A volume mesh with solution for water content in the tissue is displayed. The volume solution reveals smoothly varying tissue properties. In this image, the mesh is sliced by the two visible (coronal and sagittal) DICOM planes
Fig. 7.
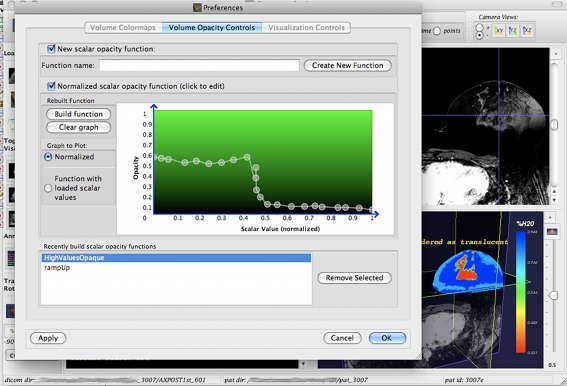
Interactive tool for adjusting the volume mesh opacity is shown. By selecting the opacity on the y-axis for each scalar value on the x-axis, the user can determine which pixels in the volume mesh are displayed as transparent and which ones are opaque. In this way, one can make the mesh translucent in the outer shell and opaque in the inner shell
Varying Transparency of Volume and Surface Data The interface provides special controls when handling volume data, because in addition to image-wide transparencies, we can toggle the transparency of each alpha (essentially pixel) value in the volume. Through a preference pane (as seen in Fig. 7), one can build a transfer function that determines which alpha values in the volume are to be rendered as transparent, and which as opaque. In this way, one can highlight areas of interest in the volume mesh by making pixels associated with these areas opaque, while disregarding the rest by making them transparent. A similar preference pane for controlling the different NIR parameter colors is also provided. These capabilities in manipulating the volume transparency are provided to aid the slicing/cutting of the volume with the DICOM slices and can be used in tandem with the slicing feature.The above feature set represents the core features of the NIRViz application. Other features were implemented, but these served mainly as support features for the ones detailed above. For example, in order to allow for slicing and cross-sectioning of the mesh files using the DICOM dataset, the user is allowed to use any of the three orthogonal slices in any number of combinations. For example, in order to extract a quadrant of the mesh image (as detailed in Fig. 2), the user would choose to enable the visibility of all planes, but the user would choose to enable the visibility of the coronal and axial planes (Fig. 3) to get a wedge of the mesh image. Other supporting features, such as documentation control over the mesh colors, control over the placement of documentation text, control over the overall orientation of the 3D image, etc., are included and detailed in the application documentation. NIRViz works especially well when the mesh and geometry files are already aligned, and one does not have to drag them explicitly to align them.
Discussion
The initial iteration of the software offers encouraging results. With limited resources available (one main developer and one supervisor/design manager), the software successfully provided a platform for optical image overlay on MRI and CT images.
The whole software project was commissioned to allow for novel uses of the ITK and VTK in biomedical software applications. Both libraries represent a huge body of work by the Kitware (www.kitware.com) to provide libraries for the segmentation and visualization of medical information. By leveraging the years, and probably hundreds of man-months that went into the development of these libraries, we were hoping to provide a solution to one of the more underdeveloped areas of software design, that of biomedical visualization applications. Our particular version of this application displayed reconstructed mesh files in the context of the DICOM images that they were acquired from. The files not only showed geometry information but also had extra information in the form of hemoglobin concentrations found with optical techniques in the tissues such as breast. Both DICOM image slices and surface/volume meshes with solutions were visualized in a way that integrated structural information from MRI with functional information from optical methods to create multimodal display. In this task, we were successful. A few challenges lie ahead. Making the application responsive when loading big volume meshes is one of the challenges, and using an oblique plane to slice the meshes and automatic coregistration for volume solutions are other challenges which we plan to explore and address in future work.
References
- 1.Cerussi A, et al. In vivo absorption, scattering, and physiologic properties of 58 malignant breast tumors determined by broadband diffuse optical spectroscopy. Journal of Biomed Opt. 2006;11(4):044005–04400516. doi: 10.1117/1.2337546. [DOI] [PubMed] [Google Scholar]
- 2.Chance B, et al. Breast cancer detection based on incremental biochemical and physiological properties of breast cancers: a six-year, two-site study. Acad Radiol. 2005;12(8):925–933. doi: 10.1016/j.acra.2005.04.016. [DOI] [PubMed] [Google Scholar]
- 3.Poplack SP, et al. Electromagnetic breast imaging: results of a pilot study in women with abnormal mammograms. Radiology. 2007;243(2):350–359. doi: 10.1148/radiol.2432060286. [DOI] [PubMed] [Google Scholar]
- 4.Jiang S, et al. Evaluation of breast tumor response to neoadjuvant chemotherapy with tomographic diffuse optical spectroscopy: case studies of tumor region-of-interest changes. Radiology. 2009;252(2):551–560. doi: 10.1148/radiol.2522081202. [DOI] [PMC free article] [PubMed] [Google Scholar]
- 5.Cerussi A, et al. Predicting response to breast cancer neoadjuvant chemotherapy using diffuse optical spectroscopy. PNAS. 2007;104(10):4014–4019. doi: 10.1073/pnas.0611058104. [DOI] [PMC free article] [PubMed] [Google Scholar]
- 6.Zhou C, et al. Diffuse optical monitoring of blood flow and oxygenation in human breast cancer during early stages of neoadjuvant chemotherapy. J Biomed Opt. 2007;12(5):051903. doi: 10.1117/1.2798595. [DOI] [PubMed] [Google Scholar]
- 7.Hebden JC, et al. Three-dimensional optical tomography of the premature infant brain. Phys Med Biol. 2002;47(23):4155–4166. doi: 10.1088/0031-9155/47/23/303. [DOI] [PubMed] [Google Scholar]
- 8.Austin T, et al. Three dimensional optical imaging of blood volume and oxygenation in the neonatal brain. Neuroimage. 2006;31(4):1426–1433. doi: 10.1016/j.neuroimage.2006.02.038. [DOI] [PubMed] [Google Scholar]
- 9.Joseph DK, et al. Diffuse optical tomography system to image brain activation with improved spatial resolution and validation with functional magnetic resonance imaging. Applied Optics. 2006;45(3):8142–8151. doi: 10.1364/AO.45.008142. [DOI] [PubMed] [Google Scholar]
- 10.Nothdurft RE, et al. In vivo fluorescence lifetime tomography. J Biomed Opt. 2009;14:024004. doi: 10.1117/1.3086607. [DOI] [PubMed] [Google Scholar]
- 11.Hyde D, et al. Hybrid FMT-CT imaging of amyloid-beta plaques in a murine Alzheimer’s disease model. Neuroimage. 2009;44(4):1304–1311. doi: 10.1016/j.neuroimage.2008.10.038. [DOI] [PubMed] [Google Scholar]
- 12.Carpenter C, et al. Methodology development for three-dimensional MR-guided near infrared spectroscopy of breast tumors. Optics Express. 2008;16(22):17903–17914. doi: 10.1364/OE.16.017903. [DOI] [PMC free article] [PubMed] [Google Scholar]
- 13.Culver JP, et al. Three-dimensional diffuse optical tomography in the parallel plane transmission geometry: Evaluation of a hybrid frequency domain/continuous wave clinical system for breast imaging. Med Phys. 2003;30(2):235–247. doi: 10.1118/1.1534109. [DOI] [PubMed] [Google Scholar]
- 14.Dehghani H, Pogue BW, Shudong J, Brooksby B, Paulsen KD. Three dimensional optical tomography: resolution in small object imaging. Applied Optics. 2002;42(16):3117–3128. doi: 10.1364/AO.42.003117. [DOI] [PubMed] [Google Scholar]
- 15.Eppstein MJ, et al. Three-dimensional Bayesian optical image reconstruction with domain decomposition. IEEE Trans Med Imaging. 2001;20(3):147–162. doi: 10.1109/42.918467. [DOI] [PubMed] [Google Scholar]
- 16.Brooksby B, et al. Imaging breast adipose and fibroglandular tissue molecular signatures using hybrid MRI-guided near-infrared spectral tomography. Proc Nat Acad Sci USA. 2006;103(23):8828–8833. doi: 10.1073/pnas.0509636103. [DOI] [PMC free article] [PubMed] [Google Scholar]
- 17.Carpenter C, et al. Image-guided optical spectroscopy provides molecular-specific information in vivo: MRI-guided spectroscopy of breast cancer hemoglobin, water & scatterer size. Optics Letters. 2007;32(8):933–935. doi: 10.1364/OL.32.000933. [DOI] [PubMed] [Google Scholar]
- 18.www.slicer.org. 3D Slicer.
- 19.http://www.ircad.fr/softwares/vr-render/Documentation/5_2D-MPR.html. VR Render.
- 20.http://www.osirix-viewer.com/AboutOsiriX.html, Osirix.
- 21.Azar F, et al. Standardized platform for coregistration of nonconcurrent diffuse optical and magnetic resonance breast images obtained in different geometries. J Biomed Opt. 2007;12(5):051902. doi: 10.1117/1.2798630. [DOI] [PubMed] [Google Scholar]
- 22.Dehghani H, et al. Numerical modelling and image reconstruction in diffuse optical tomography. Philos Transact A Math Phys Eng Sci. 2009;367(1900):3073–3093. doi: 10.1098/rsta.2009.0090. [DOI] [PMC free article] [PubMed] [Google Scholar]
- 23.Srinivasan S, et al. A boundary element approach for image-guided near-infrared absorption and scatter estimation. Med Phys. 2007;34(11):4545–4557. doi: 10.1118/1.2795832. [DOI] [PubMed] [Google Scholar]
- 24.Schroeder, W., The Visualization Toolkit, 3rd edition. 2003: Kitware, Inc.
- 25.Ibanez, L., et al., The ITK Software Guide, 2nd edition. 2005: Kitware Inc.
- 26.http://qt.nokia.com/products, Qt.
- 27.Malaterre, M., GDCM Reference Manual, 1st edition. 2008: http://gdcm.sourceforge.net/gdcm.pdf.
- 28.http://DICOM.offis.de/dcmtk, DCMTK.


