

Abstract
Multi-scale modeling has become a productive strategy for quantifying interstitial cells of Cajal (ICC) network structure-function relationships, but the lack of large-scale ICC network imaging data currently limits modeling progress. The SNESIM (Single Normal Equation Simulation) algorithm was utilized to generate realistic virtual images of small real wild-type (WT) and 5-HT2B-receptor knockout (Htr2b−/−) mice ICC networks. Two metrics were developed to validate the performance of the algorithm: (i) network density, which is the proportion of ICC in the tissue; (ii) connectivity, which reflects the degree of connectivity of the ICC network. Following validation, the SNESIM algorithm was modified to allow variation in the degree of ICC network depletion. ICC networks from a range of depletion severities were generated, and the electrical activity over these networks was simulated. The virtual ICC networks generated by the original SNESIM algorithm were similar to that of their real counterparts. The electrical activity simulations showed that the maximum current density magnitude increased as the network density increased. In conclusion, the SNESIM algorithm is an effective tool for generating realistic virtual ICC networks. The modified SNESIM algorithm can be used with simulation techniques to quantify the physiological consequences of ICC network depletion at various physical scales.
Index Terms: Gastroenterology, image generation, interstitial cells of Cajal, SNESIM
I. Introduction
Contractile behavior in much of the gastrointestinal (GI) tract is coordinated by low frequency waves of depolarization termed slow waves [1], which are initiated and actively propagated by networks of specialized pacemaker cells called interstitial cells of Cajal (ICC) [2]. ICC loss and injury is a major focus of current research interest, as it is now recognized to be a major histological abnormality in several motility disorders [1], most notably gastroparesis [3], an increasingly recognized disorder in which gastric emptying is delayed [4], and slow transit constipation [5].
Although ICC loss is assumed to play a key role in gastric dysmotility, the functional significance of ICC depletion for tissue and organ function remains uncertain. Experimental strategies for quantifying ICC network structure-function relationships are limited, and multi-scale modeling has therefore become a productive strategy [6]. However, a lack of large-scale tissue volume ICC network imaging data currently limits modeling progress.
This paper presents a novel in silico methodology to generate realistic virtual ICC networks across a spectrum of ICC depletions by using a modified SNESIM (Single Normal Equation Simulation) algorithm [7] - a geostatistical algorithm developed in the petroleum industry for building numerical models of the geological formations which host oil reservoirs [8]. Then, in conjunction with multi-scale simulation techniques, ICC structure-function relationships can be quantified across multiple physical scales.
II. Methods
A. Virtual Network Generation
The original SNESIM algorithm generates virtual images, of any size, with similar structural properties to a user-supplied training image that contains the desired image characteristics. The algorithm generates the virtual image starting from a coarse grid, and then recursively refines the grid by including all pixels halfway between any two currently adjacent pixels until all pixels of the virtual image are simulated. The coarseness of the first grid is determined by a user-defined parameter termed the highest multi-grid level. Each time the grid is refined the multi-grid level decreases by 1, and the grid that contains all pixels to be simulated corresponds to multi-grid level 1.
The data template, which is also user-supplied, contains the relative locations of neighbors with respect to a central pixel that are to be examined to determine the value of that central pixel. This set of neighbors is termed the data search neighborhood (DSN). At each grid level, the input training image is scanned by the data template to compute the search tree. This search tree stores multiple-point statistics, which express the conditional probability of finding ICC at two or more locations simultaneously, of the training image. Following that, the virtual image is generated sequentially using a pixel-based technique, where the local conditional probability density function (PDF) at each pixel is calculated using the previously computed search tree [8].
Below is a summary of the specific steps taken by the original SNESIM algorithm. For the full description, refer to [7], [8].
Starting from the highest multi-grid level, the training image was scanned using the inputted data template to generate the search tree for this multi-grid level. The data template was centered on each pixel of the training image at the current multi-grid level and the observed data event defined by the values at the central pixel and at the locations of the DSN was recorded in the search tree.
A random path that visits all pixels in the virtual image at the current multi-grid level once only was defined.
The data template was centered on each undetermined pixel along the random path and the data event presented by the DSN was retained. The proportions of central values exhibited by the training image under the current data event was retrieved from the search tree generated in 1). If the number of occurrences of this data event in the training image is under the minimum threshold of occurrences defined by the user, the furthest location of the DSN is dropped from the data event and the proportions of central values under this new data event was re-retrieved. The proportions of central values was then used to calculate the local conditional PDF. If all locations in the DSN were dropped but there were still not enough occurrences, the local conditional PDF was replaced with the global marginal PDF.
The PDF found in 3) was adjusted to account for the local marginal PDF, and a simulated value for the current undetermined pixel was drawn from this adjusted PDF. This simulated pixel was added into the virtual image and could be used to inform subsequently simulated pixels.
Steps 3) to 4) were repeated until all pixels in the random path were simulated.
The multi-grid level was decreased by 1 and steps 1) to 5) were repeated. All previously simulated pixels in the higher multi-grid levels were retained to inform the pixels to be simulated at that multi-grid level. The algorithm was terminated when multi-grid level 1 was completed.
To validate the capability of SNESIM to replicate ICC networks, two-dimensional (2D) stacks of small intestinal myenteric ICC confocal images from wild-type (WT) and 5-HT2B-receptor knockout (Htr2b−/−) mice were used as the training images for the SNESIM algorithm (Fig. 1A and B). Normally, serotonin acts on 5-HT2B-receptors to increase proliferation of ICC, and Htr2b−/− mice show ICC depletion [9]. The black pixels represent ICC, while the white pixels represent the background tissue matrix, which was assumed to be passively conducting tissue (PCT). The WT and Htr2b−/− network images were both 512×512 pixels in the x-y plane, and represented physical dimensions of 316×316×7 μm and 316×316×8 μm respectively. The degree of similarity between the virtual ICC networks and their real counterpart was assessed using the following two metrics:
- Density metric (ρ): This is defined as the proportion of the image that is populated by ICC:
where NICC and NTotal are the number of pixels representing ICC and the total number of pixels in the image respectively. The density of an image can range from 0 to 1, with 0 indicating that no ICC are present, while 1 indicates that only ICC are present.(1) - Connectivity metric (c): This metric reflects the connectivity of the ICC network. Each group of immediately connected ICC pixels of an ICC network, termed as an ICC island, can be visualized as a separate object. Then, the connectivity of the network can be measured by:
where Ii is the number of pixels in the ith ICC island, n is the total number of ICC islands throughout the network, and NICC is as defined in (1). This metric is a normalized weighted average of the ICC island sizes, where more weight is placed on larger islands. The connectivity metric can range from 0 to 1, with a larger value indicating a higher level of connectivity of the ICC network.(2)
Fig. 1.
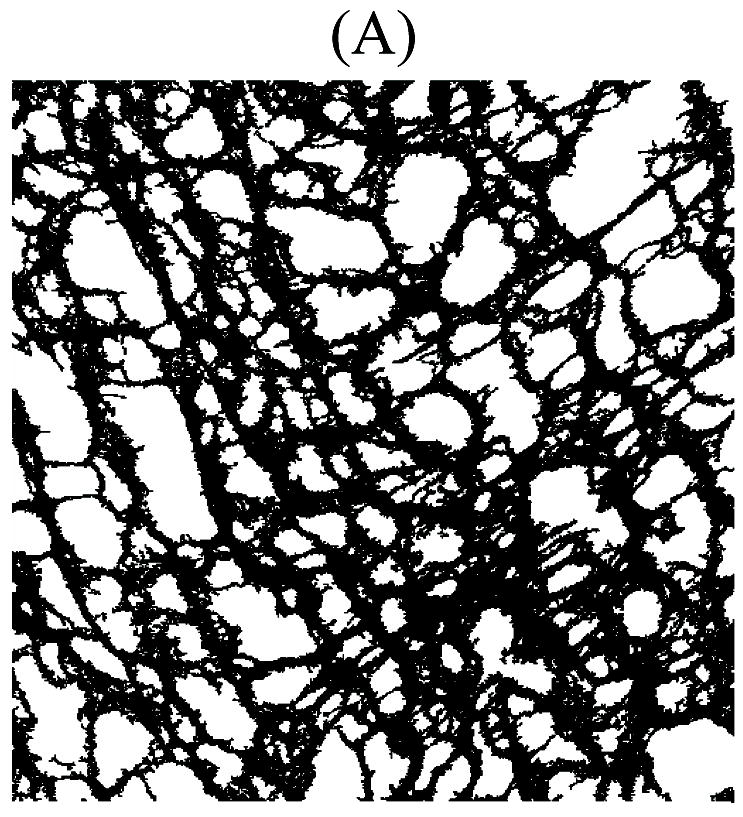
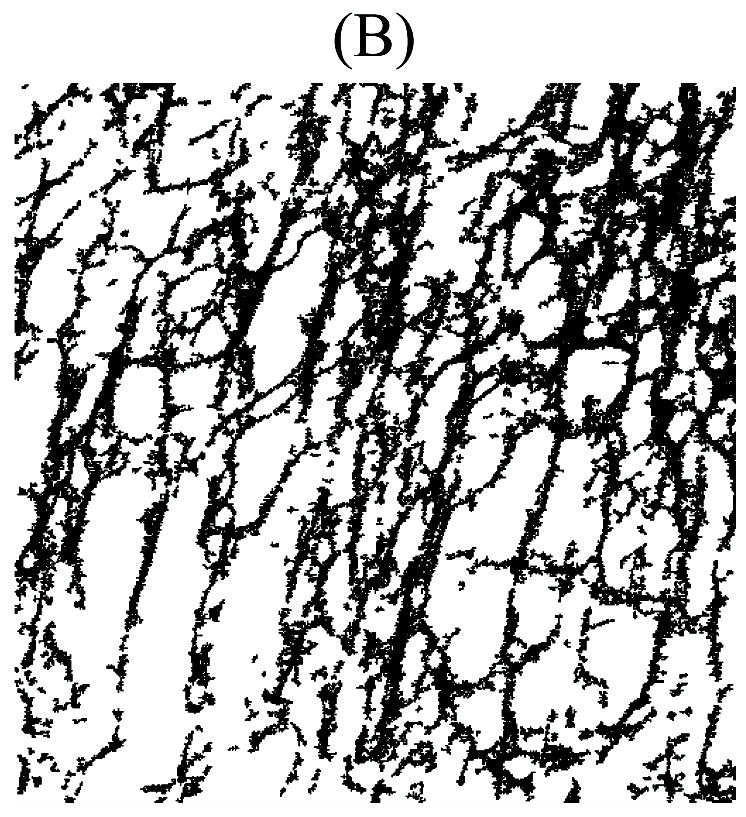
Two dimensional stacks of WT (A) and Htr2b−/− (B) mice small intestinal myenteric ICC, which represent physical dimensions of 316×316×7 μm and 316×316×8 μm respectively.
Three virtual ICC networks were generated using each of the WT and Htr2b−/− network images from Fig. 1 as training images. When generating these virtual networks, the highest multi-grid level was set to 5; the data template employed consisted of 2 concentric circular search areas: (1) a fine inner 4 pixel radius area with sampling resolution of 1 pixel, and (2) a coarse outer 100 pixel radius area with sampling resolution of 20 pixels; and the minimum threshold of data event occurrences was defined as 6. The virtual networks generated were of the same physical dimensions and pixel resolution as the training image used. The network assessment metrics described above were calculated for all images in both sets of real and virtual ICC networks, and the relative error of the virtual network metrics to the real counterpart metrics were computed to determine the level of similarity between the real and virtual networks.
Once the SNESIM algorithm was validated via the above metrics, it was then applied to generate virtual ICC networks throughout a range of depletion severities. Further modifications were applied to the SNESIM algorithm to allow interpolation of varying degrees of ICC network depletion severity in these networks. First, two training images were used to generate the virtual image instead of one, with each training image depicting an extreme in the ICC depletion spectrum. The two training images used were 300×300 pixel portions of the WT and Htr2b−/− networks shown in Fig. 1A and B rotated so that the network orientations of the two images were visually similar. Second, an interpolation factor (ϕ) was calculated:
| (3) |
where ρtarget, ρWT, and ρHtr2b−/− were the user defined target network density, WT, and Htr2b−/− network training image densities respectively. Provided that the target density lies between the densities of the two training images, the interpolation factor ranges from 0 to 1, with a smaller value indicating more similarity towards the WT ICC network. It should be noted that the network density of virtual images generated by the modified SNESIM algorithm may deviate from the target network density since the algorithm is stochastic. Third, the search trees for both training images were calculated and then weighted by the interpolation factor for each multi-grid: the search tree of the WT training image was weighted by 1-ϕ whereas the search tree of the Htr2b−/− training image was weighted by ϕ. Finally, these two weighted search trees were summed and the virtual image was generated using the combined search tree.
Three virtual ICC networks were generated using the modified SNESIM algorithm at each of the target densities: 0.35, 0.40, 0.45, and 0.50 (i.e., twelve networks altogether), which corresponds to interpolation factors of: 0.91, 0.65, 0.39, and 0.14 respectively.
B. Electrical Activity Simulation
The simulation of electrical activity over the virtual ICC networks was conducted using the bidomain equations, as described by Du et al. [6], [10]. Briefly, the virtual ICC network was discretized into a single element finite element grid, with each grid point corresponding to a pixel in the virtual ICC network image. The electrical activity within the ICC and PCT was modeled by a simplified version of the Corrias and Buist ICC model [6], [11] and a passive cell model with a zero ion conductance term respectively using the open modeling standard CellML [12]. The continuum-based bidomain equations were employed in the multi-scale tissue model, and the models were solved using the finite element technique [6].
Electrical activity was simulated over the twelve networks generated by the modified SNESIM algorithm for 500 ms with a time step of 1 ms. The average current density magnitude over the network was used to quantify electrical activation [6].
III. Results and Discussion
A. Virtual Network Generation
One virtual network from both WT and Htr2b−/− categories is shown in Fig. 2A and B. The metric values and relative errors of the WT real and virtual ICC networks are displayed in Table I, and those for the Htr2b−/− real and virtual ICC networks are displayed in Table II.
Fig. 2.
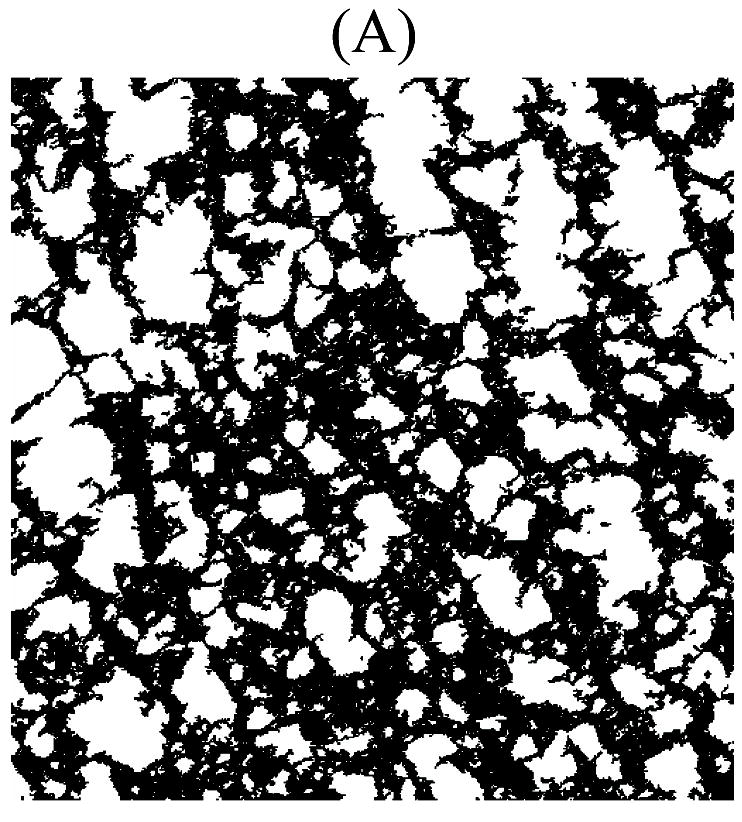
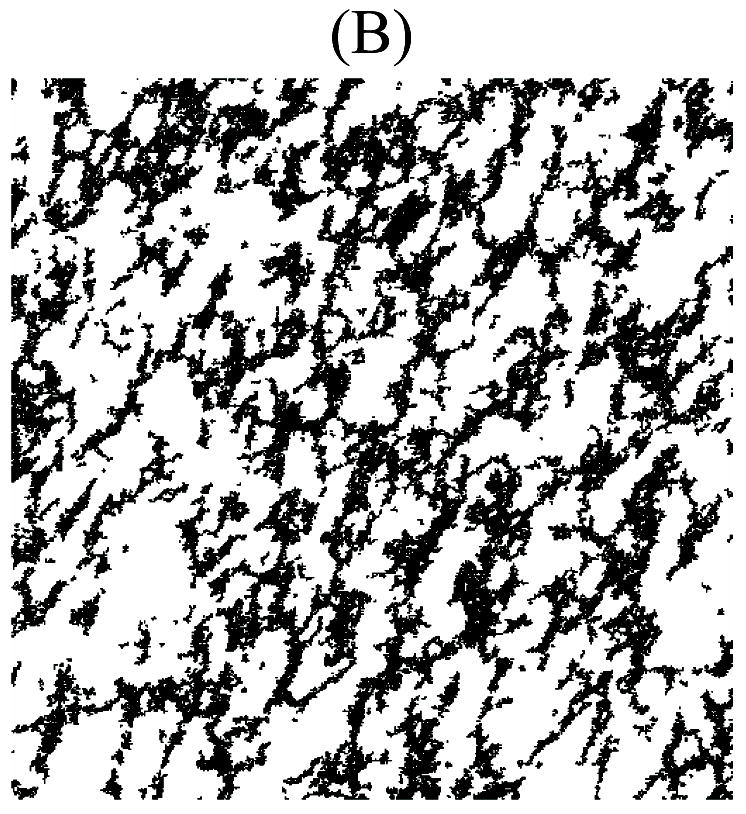
Virtual ICC networks replicating structural properties of the WT (A) and Htr2b−/− (B) ICC networks from Fig. 1A and B. These virtual networks are at the same pixel resolution and represent the same physical dimensions as that of their real counterpart from Fig. 1A and B.
TABLE I.
Metrics and relative errors for WT real and virtual ICC networks
| Metric | Real | Virtual 1 | Virtual 2 | Virtual 3 | |
|---|---|---|---|---|---|
| Density | Actual | 0.512 | 0.510 | 0.518 | 0.506 |
| Error (%) | - | 0.33 | 1.23 | 1.15 | |
| Connectivity | Actual | 0.999 | 0.995 | 0.989 | 0.995 |
| Error (%) | - | 0.36 | 0.94 | 0.33 |
TABLE II.
Metrics and relative errors for Htr2b−/− real and virtual ICC networks
| Metric | Real | Virtual 1 | Virtual 2 | Virtual 3 | |
|---|---|---|---|---|---|
| Density | Actual | 0.325 | 0.322 | 0.324 | 0.326 |
| Error (%) | - | 0.80 | 0.22 | 0.37 | |
| Connectivity | Actual | 0.843 | 0.594 | 0.808 | 0.636 |
| Error (%) | - | 29.46 | 4.08 | 24.47 |
The selection of the data template used by the SNESIM algorithm was critical to the virtual network generation. With a larger DSN, the appropriate value of the central pixel being simulated could be more accurately determined. In particular, neighbors far away from the central pixel were necessary to capture the long-range structural properties of the real ICC networks. However, a larger DSN also incurred more CPU time and RAM to generate the virtual networks. Therefore, an accuracy-speed trade-off existed when selecting the data template to be used.
When using the original SNESIM algorithm to generate virtual ICC networks that replicate the WT and Htr2b−/− networks, the density of the virtual networks closely mimicked that of the real networks, with relative errors consistently around 1% in both the WT and Htr2b−/− networks. The connectivity of ICC networks was accurately replicated when generating virtual WT networks, with errors under 1%, but variations in the connectivity of virtual Htr2b−/− networks were present. This was because the virtual Htr2b−/− networks contained minor gaps that were a few pixels in width between ICC islands. Although these gaps did not physically separate the islands by a great distance, the connectivity metric implemented was sensitive to all island separations regardless of separation distance, and hence these gaps greatly influenced the value of this metric. Overall, the SNESIM algorithm was able to realistically replicate both WT and Htr2b−/− ICC networks, although the virtual Htr2b−/− ICC networks lacked some finer structural details.
B. Electrical Activity Simulation
The maximum current density magnitude through time achieved in each of the twelve virtual networks generated by the modified SNESIM algorithm was plotted against the respective network assessment metric values (Fig. 3A and B).
Fig. 3.
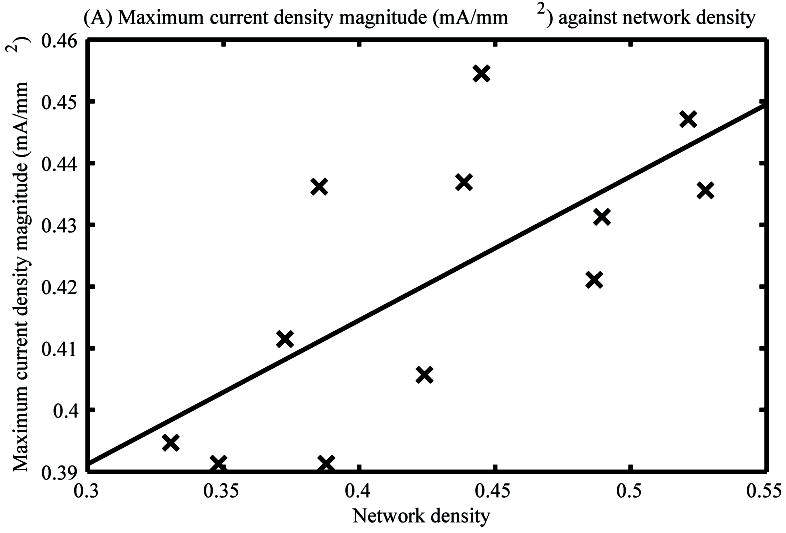
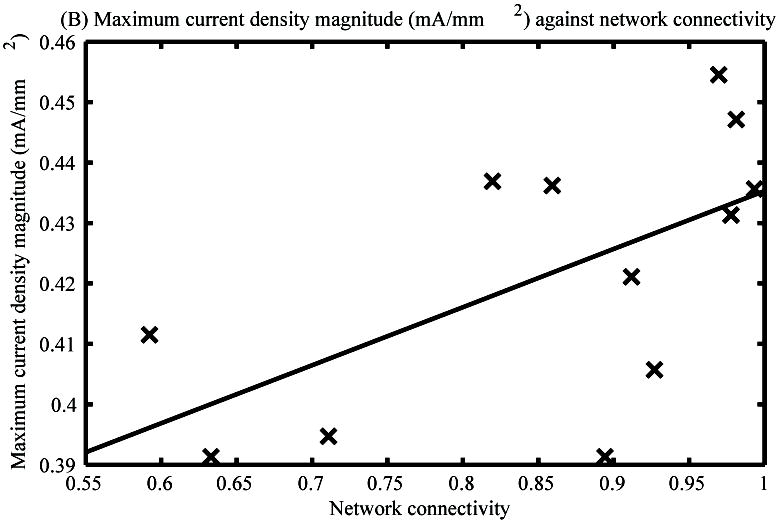
Maximum current density magnitudes of the twelve virtual ICC networks generated by the modified SNESIM algorithm against the network density (A) and connectivity (B) metrics of the respective networks.
The maximum current density magnitudes of the virtual networks through time were significantly correlated with the density metric (p<0.05) (Fig. 3A), with a correlation coefficient of 0.70. An increasing trend in maximum current density was observed as network density increased.
IV. Conclusion
This study presents a novel in silico methodology to quantify the relationship between cellular depletion of ICC and the resultant electrical activity at the tissue level. By using small real images of ICC networks as training images, the modified SNESIM algorithm presented here can generate realistic virtual ICC networks at varying levels of depletion severities. Electrical activity over these virtual networks can then be evaluated in a multi-scale simulation environment. This methodology can be implemented to further investigate the physiological consequences of ICC network depletion at various different physical scales.
The connectivity metric revealed minor differences in the simulated Htr2b−/− network images. For future work, additional modifications to the SNESIM algorithm, such as those proposed by Stien et al. [13] where the virtual image is iteratively generated so that the multiple-point statistics of the real images are strictly reproduced, can be implemented to capture finer structural details of the real ICC networks. Also, although both ICC loss and injury have been identified in motility disorders such as gastroparesis [3], this study has only addressed ICC loss. In future, the cellular models utilized could be modified to imitate injury as done previously in the cardiac field to model myocardial ischemia [14], [15], as long as the experimental data was available to guide the modeling.
Acknowledgments
The authors would like to thank Sebastien Strebelle and Andre Journel of the Stanford Center for Reservoir Forecasting for making the original SNESIM algorithm source code available, and Dr. Vivek Tharayil for his assistance with the immunohistochemistry for detecting ICC.
J. Gao is supported by a University of Auckland Health Research Doctoral Scholarship. This work is partially funded by grants from the New Zealand Health Research Council, the Riddet Institute, and the National Institutes of Health (DK57061, DK68055, DK64775).
Contributor Information
Jerry Gao, Auckland Bioengineering Institute, The University of Auckland, Auckland, New Zealand (phone: 649-373-7599-89742; fax: 649-367-7157; jgao032@aucklanduni.ac.nz).
Peng Du, Auckland Bioengineering Institute, The University of Auckland, Auckland, New Zealand.
Rosalind Archer, Department of Engineering Science, The University of Auckland, Auckland, New Zealand.
Greg O’Grady, Auckland Bioengineering Institute and the Department of Surgery, The University of Auckland, Auckland, New Zealand.
Simon J. Gibbons, Enteric Neuroscience Program, Division of Gastroenterology and Hepatology, Mayo Clinic College of Medicine, Rochester, MN, USA
Gianrico Farrugia, Enteric Neuroscience Program, Division of Gastroenterology and Hepatology, Mayo Clinic College of Medicine, Rochester, MN, USA.
Leo K. Cheng, Auckland Bioengineering Institute, The University of Auckland, Auckland, New Zealand
Andrew J. Pullan, Auckland Bioengineering Institute and Department of Engineering Science, The University of Auckland, Auckland, New Zealand; Riddet Institute, Palmerston North, New Zealand; and Department of Surgery, Vanderbilt University, Nashville, TN, USA
References
- 1.Huizinga J, Zarate N, Farrugia G. Physiology, injury and recovery of interstitial cells of Cajal: basic and clinical science. Gastroenterology. 2009;137:1548–1556. doi: 10.1053/j.gastro.2009.09.023. [DOI] [PMC free article] [PubMed] [Google Scholar]
- 2.Farrugia G. Interstitial cells of Cajal in health and disease. Neurogastroenterol Motil. 2008 May;20(Suppl 1):54–63. doi: 10.1111/j.1365-2982.2008.01109.x. [DOI] [PubMed] [Google Scholar]
- 3.Grover M, Farrugia G, Lurken MS, Bernard CE, Faussone-Pellegrini MS, Smyrk TC, Parkman HP, Abell TL, Snape WJ, Hasler WL, Unalp-Arida A, Nguyen L, Koch KL, Calles J, Lee L, Tonascia J, Hamilton Fa, Pasricha PJ. Cellular Changes in Diabetic and Idiopathic Gastroparesis. Gastroenterology. 2011 Feb; doi: 10.1053/j.gastro.2011.01.046. On-line Ahead of Press. [DOI] [PMC free article] [PubMed] [Google Scholar]
- 4.Wang YR, Fisher RS, Parkman HP. Gastroparesis-related hospitalizations in the United States: trends, characteristics, and outcomes, 1995-2004. Am J Gastroenterol. 2008 Feb;103:313–322. doi: 10.1111/j.1572-0241.2007.01658.x. [DOI] [PubMed] [Google Scholar]
- 5.He C, Burgart L, Wang L, Pemberton J, Young-Fadok T, Szurszewski J, Farrugia G. Decreased interstitial cell of cajal volume in patients with slow-transit constipation. Gastroenterology. 2000;118(no 1):14–21. doi: 10.1016/s0016-5085(00)70409-4. [DOI] [PubMed] [Google Scholar]
- 6.Du P, O’Grady G, Gibbons SJ, Yassi R, Lees-Green R, Farrugia G, Cheng LK, Pullan AJ. Tissue-specific mathematical models of slow wave entrainment in wild-type and 5-HT(2B) knockout mice with altered interstitial cells of Cajal networks. Biophys J. 2010 May;98:1772–1781. doi: 10.1016/j.bpj.2010.01.009. [DOI] [PMC free article] [PubMed] [Google Scholar]
- 7.Strebelle S. Conditional simulation of complex geological structures using multiple-point statistics. Math Geol. 2002;34:1–21. [Google Scholar]
- 8.Strebelle S, Journel A. Reservoir Modeling Using Multiple-Point Statistics. Proceedings of SPE Annual Technical Conference and Exhibition. 2001 Sep; [Google Scholar]
- 9.Tharayil VS, Wouters MM, Stanich JE, Roeder JL, Lei S, Beyder a, Gomez-Pinilla PJ, Gershon MD, Maroteaux L, Gibbons SJ, Farrugia G. Lack of serotonin 5-HT2B receptor alters proliferation and network volume of interstitial cells of Cajal in vivo. Neurogastroenterol Motil. 2010 Apr;22:462–469. e109–e110. doi: 10.1111/j.1365-2982.2009.01435.x. [DOI] [PMC free article] [PubMed] [Google Scholar]
- 10.Du P, O’Grady G, Davidson J, Cheng L, Pullan A. Multi-scale modeling of gastrointestinal electrophysiology and experimental validation. Crit Rev Biomed Eng. 2010;38:1–30. doi: 10.1615/critrevbiomedeng.v38.i3.10. [DOI] [PMC free article] [PubMed] [Google Scholar]
- 11.Corrias A, Buist ML. Quantitative cellular description of gastric slow wave activity. Am J Physiol Gastrointest Liver Physiol. 2008 Apr;294:G989–G995. doi: 10.1152/ajpgi.00528.2007. [DOI] [PubMed] [Google Scholar]
- 12.Lloyd CM, Halstead MDB, Nielsen PF. CellML: its future, present and past. Prog Biophys Mol Biol. 2004;85:433–450. doi: 10.1016/j.pbiomolbio.2004.01.004. [DOI] [PubMed] [Google Scholar]
- 13.Stien M, Kolbjørnsen O, Hauge R, Abrahamsen P. Modification of the snesim algorithm. 2007 [Google Scholar]
- 14.Jie X, Trayanova N. Mechanisms for initiation of reentry in acute regional ischemia phase 1b. Heart Rhythm. 2010;7(no 3):379–386. doi: 10.1016/j.hrthm.2009.11.014. [DOI] [PMC free article] [PubMed] [Google Scholar]
- 15.Shaw R, Rudy Y. Electrophysiologic effects of acute myocardial ischemia: a theoretical study of altered cell excitability and action potential duration. Cardiovasc Res. 1997;35(no 2):256. doi: 10.1016/s0008-6363(97)00093-x. [DOI] [PubMed] [Google Scholar]