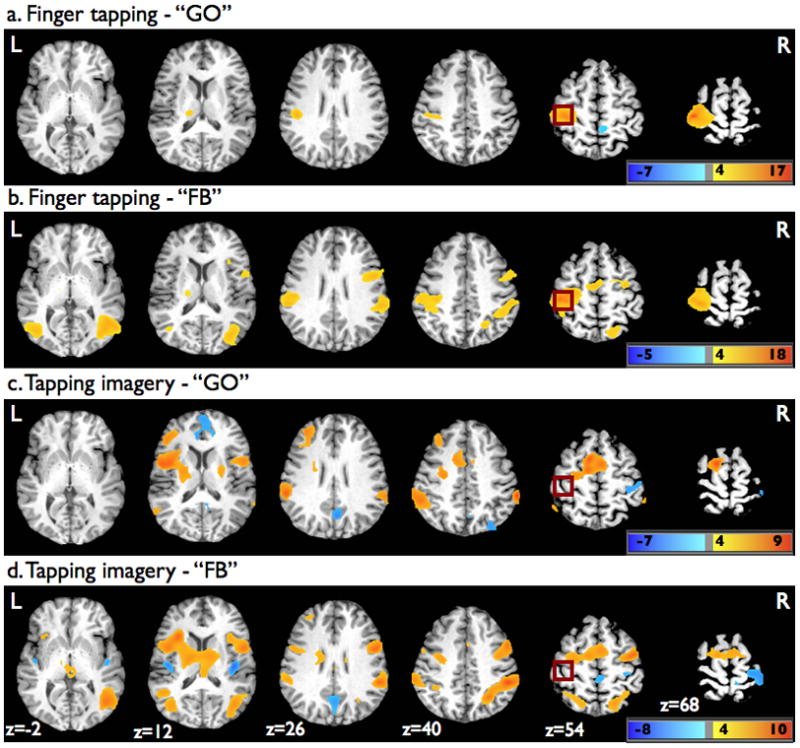
Figure 4.

Superimposed statistical parametric maps on axial brain slices of one participant’s brain showing significant activation changes from baseline during the finger tapping (a) GO and (b) FB tasks, as well as the tapping imagery (c) GO and (d) FB tasks. For display purpose, the parametric maps were thresholded at p=0.001 (uncorrected) using a voxel cluster size threshold of 50 voxels. Dark red square shows approximate location of ROIm.
